BTC Turning AroundMy last post was a little premature.
We got an inverted hammer on multiple timeframes looking like we might even get a morning star
the 50 day ma might reject the deathcross and rejections can be more powerful then breakthroughs
i think the bears are exhausted
! Seeing huge signs of reversal all across the board
TA

After strong upward movement, BTC can correct to support levelHello traders, I want share with you my opinion about Bitcoin. By observing the chart, we can see that the price a not long time ago started to trades in an upward channel, where it at once rebounded from the resistance line and declined to the support line, breaking the 43200 support level, which coincided with the support zone. After this, the price tried to rise to the support zone, but failed and soon it bounced from this zone and declined back to the support line of the channel. Next, BTC repeated movement up, and this time, the price broke the support level. But later price in a short time declined to support line of the channel, after which BTC made impulse up to the 45700 resistance level, which coincided with the resistance line of the channel and seller zone. Then price declined back to the support line and soon made a strong upward impulse to 48000 points, thereby exiting from the channel and breaking the resistance level. After this movement, BTC recently started to decline and at the moment it trades below the 45700 level. So, possibly Bitcoin can continue to decline to support level. Therefore I set my target at the 43200 support level, and then we'll see where BTC continues to move. Please share this idea with your friends and click Boost 🚀

Euro can make downward impulse to 1.0875 level from pennantHello traders, I want share with you my opinion about Euro. Looking at the chart, we can see how the price rebounded from the support level, which coincided with the buyer zone, and in a short time rose to the resistance level. Then the price started to decline in a downward channel, where the EUR declined to 1.0725 points, thereby breaking the 1.0875 level. After this, the price rebounded from the support line and in a short time rose back to the 1.0875 level, exiting from the channel. Later price broke the support level and continued to move up to the 1.1010 resistance level, which coincided with the seller zone. But firstly, the Euro rebounded and corrected, after which it made a strong upward impulse to the resistance line, thereby forming an upward pennant pattern and breaking the resistance level. Then price bounced from this line and soon declined to the support line, breaking the 1.1010 level one more time. And now, the price continues to trades very close to this line, and possibly Euro can bounce from the support line to the resistance line and then make an impulse down to the support level, thereby exiting from the pennant pattern. So, that's why I set my target at the 1.0875 level. Please share this idea with your friends and click Boost 🚀

British Pound, after rise movement, can start decline to 1.2610Hello traders, I want share with you my opinion about British Pound. Looking at the chart, we can see how the price some days ago declined to the support line and at once rebounded up to the support level, which coincided with the buyer zone. In a short time, GBP broke this level and tried to rise higher, but failed and started to decline in a downward channel, where it declined to the support line, thereby breaking the 1.2610 support level. After this, the price rebounded from the support line of the channel and made a strong upward impulse to the resistance level, which coincided with the seller zone, breaking the 1.2610 level again and exiting from the downward channel. Also, GBP started to trades in the range, where it, after an upward impulse made a correction to the support level and then rose to the seller zone. But a not long time ago it declined back, making a fake breakout of 1.2790 and then rolled up. Now, the price continues to rise in range, and in my mind, the British Pound can one more little grow and then start to decline to a support level, which coincides with the bottom part of the range. For this case, I set my target at the 1.2610 support level. Please share this idea with your friends and click Boost 🚀

Ethereum can reach top part of range and then start to fallHello traders, I want share with you my opinion about Ethereum. By observing the chart, we can see that the price some days ago declined to the support level, which coincided with the buyer zone and mirror line, after which ETH at once rebounded and started to rise. In a short time price rose to 2445 points, thereby breaking the resistance level, but soon it around down and fell to the mirror line. Soon, ETH broke the mirror line and some time traded below this line. After this, Ethereum rose to this line, breaking the 2360 level again, and even later ETH made a fake breakout of the mirror line, after which the price made a downward impulse to the buyer zone, breaking the resistance level one more time. Next, the price entered to range, where it quickly rose to the top part, after which the price rebounded and declined to the 2200 support level. Also, ETH made a fake breakout of this level, after which it in a short time back up, and now Ethereum continues to trades in range. So, possibly price can reach the top part of the range and then start to decline to the support level. For this case, I set my target at 2200 support level. Please share this idea with your friends and click Boost 🚀

After strong upward impulse, BTC can make correction to 44150Hello traders, I want share with you my opinion about Bitcoin. Looking at the chart, we can see how the price some days ago reached the resistance line of the downward channel, which is located in the support area, but at once rebounded and continued to decline in the channel. Later BTC fell to the support level, which coincided with the support line of the channel and buyer zone, but then the price rebounded and made impulse up to the resistance line. After this, Bitcoin bounced and declined until to support line of the channel, thereby breaking the 42000 level, but soon price rebounded and rose back, making a fake breakout of this level. Next, the price some time traded near the 42000 level and later rebounded up to the resistance line of the downward channel. In a short time, BTC exited from the channel and made a strong upward impulse to 45900 points, thereby breaking the 44150 level, which coincided with the support area. Recently it started to decline and possibly Bitcoin can make a correction to a current support level. For this case, I set my target at this level - 44150. Please share this idea with your friends and click Boost 🚀


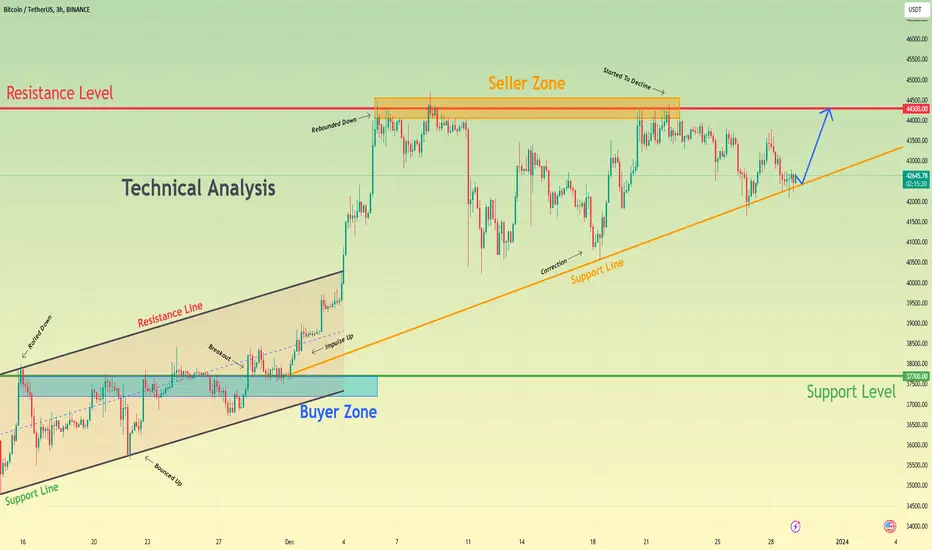
Bitcoin can rebound up from support line to resistance levelHello traders, I want share with you my opinion about Bitcoin. Looking at the chart, we can see how the price some days ago rose in an upward channel, where it reached the 37700 support level, which coincided with the buyer zone, but firstly it rolled down to the support line of the channel. After this, BTC bounced up to the 37700 level, broke it, and later made a retest to this level. Next, the price entered a triangle, where it rebounded from the support line, which coincided with the support level and made an upward impulse to the resistance level, thereby exiting from the channel. When, BTC reached the 44300 resistance level, which is located in the seller zone, the price at once rebounded and made a correction to support line of the triangle. Then price tried to rise back, but after which Bitcoin reached the seller zone, the price declined back to the support line of the triangle, where it continues to trades near to this day. In my mind, Bitcoin can fall to this line, making a correction again, and then price rebound up to the resistance level. So, this is why I set my target at the 44300 level. Please share this idea with your friends and click Boost 🚀
Btc (1d) Zoom out and see the picture Aligning perfect with etfI've created a video explaining the importance of whats going on here but as you can see in the chart it's great when tp suggestions align with previous important price levels

OMG CUP AND HANDLE(1d)(Bullish)chart says it all!
This is a Classic Huge cup and handle on the daily timeframe. Volume aligns as it should and the pullback looks great.
OMG was a huge contender in the past so i'm very excited

Flow (Bullish)(4hr)We've seen a healthy pull back, some ranging around the fib, after breaking down looks like it's gonna uptrend back and reject the breakdown, rejections come with some serious price movement in the adverse direction.
The way volume is still on a healthy increase, i'm going with we'll be on our way back up shortly!

BTC 4 hr Rejected S/R flip (Bullish)We're ranging here between fib lines. We can see the s/r line i added that seems significant in this range. Looks like there was a breakdown that was rejected turning into a MA bounce and looking like it's gonna breakout here very soon

Bullish on ioi - usdtThis fib looking good on the daily
Just had a 50 & 200 ma cross recently
Ranging here around the .5 fib which is a lovely fib to see the highest response to!

ACENT - Bull Hammer at the end of Downtrend! Volume Increasing, went down to bottom fib and looking to make a come back!
Bull Hammer at the end of Downtrend!

Psychology of the Bitcoin Chart The Bitcoin chart is a fascinating piece of art. Everyone seems to trade it, but they know it will constantly out-perform every currency worldwide. Bitcoin has recently made new highs in other currencies, but nobody seems to understand, and want to only chart it in the U.S. Dollar, What they don't understand, is that "1 Bitcoin = 1 Bitcoin, Always & Forever " .
Historically, we have always commenced a bull-market with a Rising wedge pattern, which is usually defined as bearish. This is also known as a "Bear Trap". I have highlighted these trends with large yellow circles & trendlines.
While searching the Bitcoin chart for any signs of a correction or bull market, I noticed something extraordinary. Bitcoin seems to have the same cycle every bull market. There are always 11 points to a bull market. I have highlighted these with Small circles & Path's.
1. The Anticipation Phase
Early signs of a bullish trend, marked by a brief dip that tests investor nerves.
2. Initiation of Correction
The beginning of a corrective phase, as the market adjusts from initial gains.
3. Shaking Out Weak Holders
A phase where less committed investors exit the market, leaving behind those with stronger conviction.
4. Euphoric Climax
The peak of optimism in the bull market, often characterized by significant price highs.
5. Maximum Fear Drop
A sharp decline creating a moment of maximum fear, testing the resilience of market participants.
6. Recovery Attempt
A temporary rebound from the initial peak, resembling a "dead-cat bounce."
7. Confirmation of Correction
A confirmation that the correction is ongoing, establishing a new low in the market.
8. Second Peak or Further Correction
A subsequent attempt to reach new highs or a further correction, shaping the overall market trajectory.
9. Preparations for Final Drop
The last descent before a potential significant downturn, often associated with heightened uncertainty.
10. Illusory New Bull Market
A deceptive rebound, leading some traders to believe a new bull market is beginning when, in reality, it marks the end of the current cycle.
11. Oversold Territory:
The most extreme point of a bullish cycle, signaling the imminent transition into a bear market phase.
Thank you, everyone, for taking the time to read this. My hope is that this provides reassurance and empowers everyone to make informed decisions, seizing the opportunity to secure profits at the peak.
The Bull Market Has Begun.

INTC in depth TA - INTEL bullish?hey guys its amir whats up?
so NASDAQ:INTC let analyze:
first of all ill start by saying that intel is on uptred for over 6 months. now lets get into details:
- you can see that intel is trading in a uptrend channel for over 6 months, every time the price touched at the bottom trend line the bounced up and every time it touched the upper trend they dropped down, we recently touched the bottom trend line and the price did bounced from there.
- we have on the way up some more major supports and resistances right now the price is in the middle of a support and resistance so for perfect entry ill wait till the price will reach to one of the cyan x's which marks solid entries points.
- lets talk about the MA's, first the 50MA, clear uptrend. 200MA, turned uptrend 3 months ago.
Now lets look at our indicators:
- RMACD crossed bullish about two weeks ago, and now losing a lot of momentum so I think we should wait the RMACD to make a bearish cross and wait till its will cross bullish again, or to see if the momentum is getting stronger in the coming days.
- Volume tells me that its better wait a bit more to see what is going on there.
- good buying pressure moves between moderate and strong buying pressure.
so in conclusion i'd say that now the best thing to do is to wait a little more at least till the price will reach to one of these cyan x's and there we can manage the risk reward in our favor.
price prediction is about $40

Amazon TA -Swing Idea - Going up?hey guys its amir whats up?
so NASDAQ:AMZN first of all its not a secret that amazon its an absolute monster company, one of the strongest of them all. So lets analyze:
- Amazon just touched a support trendline since 2018 acts as support and got bounced (also daily time frame closed hammer candlestick, ill see later how I upload to this idea more updates in different time frames)
- price touched fib 0.328 which perfectly sits on the trendline and bounced from there.
- 50 MA getting a bullish shape (not strong yet but still attempting to go bullish) and 200 ma shows a fight between bulls and bears but still the bulls are dominating.
- we see that we are getting buying pressure (bottom indicator marked by arrows and circles)
- I see that the volume in the about 6 months is actually very controlled and stable which is pretty good I mean you dont want huge spikes and flip flops keep it stable all the way the better. Since April 22 you can see in the volume that the bears were in control, watch at all the red bars and watch the drop of the stock in that area. and for the last few months they just fade away in a stable way.
// so to summerize, I do think that AMZN have great stracture, and they have more room to push forward in the coming weeks/months.
maybe to get inside the trade right now its a bit early because needed some more confirmations, but I probably will enter now because I can set my stop loss very close and if its will reach than not a big deal just cut it, and if I'll have more confirmations soon i will add more to the position.
The main TP points are : 147.73, 163.50, 177.76
for me great risk reward trade.
let me know what you think guys <3

$DYDX : Cultivating Opportunity: An In-Depth AnalysisA comprehensive analysis of CRYPTOCAP:DYDX , presently valued at $2.36 as of the current writing, unveils a series of significant patterns and indicators. Most notably, an intricate Triple + Double bottom formation has materialized, complemented by a consistent series of ascending peaks and troughs in the Relative Strength Index (RSI). This steadfast progression is further underscored by the multitude of price interactions with resistance thresholds. Contextualized within the backdrop of Bitcoin's lateral or ascending movement, discernible price milestones come into focus, including $2.92, $3.70, and $4.52. Beyond these intermediate benchmarks, the prospect of a substantial surge, potentially reaching $6, emerges as a distinct possibility.
#NFA

BTC Professional Analysis on $Bitcoin Weekly #NFAMake it or break it moment is right here.
40k+ breaks channel or 9k if failure here. Just like the old-school game of pong, once that ball bounces at the top and doesn't break whatever it touched, it goes in the other direction. Bitcoin doesn't break up here, it breaks down to Goblin-town aka bottom of channel in blue.

GM TA - General Motors going downhey guys whats up its amir
So General Motors, what exactly do we have here:
- Beautiful bearish flag just got broke down
- I want you to notice to the RMACD we had last week a bull trigger and got rejected and now were closing a bearish trigger, and exactly the same happened in the drop last time (vertical lines) its a sign that the bears are stronger than the bulls.
- Watch at the volume indicator, for about two years you can see clearly who have control on the stock look at all the red bars, clearly the bears are in charge here.
- Good risk reward ratio 1:3 its fine.
defintely work for me.
*not financial advisor*

KATANA INU. KATA/USDT 1D. Mem-coin. Chart.Here's Kata Inu mem coin chart.
Very technical instrument. In the main trend we can see an uptrend forming.
Secondary trend potential Cup. Previously falling wedge has been formed which has recently broken above.
Right now descending channel is forming with an amplitude of 102%.
In case of breakout of this channel - potential of 200% is opened. Then, midterm, if price breaks above the resistance of the cup - more 200% potential is there.
Also there's a potential uptrend channel forming which is shown on the chart.
The coin is moving very technically.

CHFJPY - Following The Trend ↗️Hello TradingView Family / Fellow Traders. This is Richard, also known as theSignalyst.
CHFJPY has been overall bullish trading inside the rising broadening wedge in red, and it is currently retesting the lower trendline.
Moreover, the blue level is a strong support.
🏹 So the highlighted purple circle is a strong area to look for buy setups as it is the intersection of the blue demand and lower blue trendline.
As per my trading style:
As CHFJPY is sitting around the purple circle zone, I will be looking for bullish reversal setups (like a double bottom pattern, trendline break , and so on...)
📚 Always follow your trading plan regarding entry, risk management, and trade management.
Good luck!
All Strategies Are Good; If Managed Properly!
~Rich

MAHSEAMLES - Moving into the next OrbitThe stock has been has been rising from the low from the beginning of the year. It has been consolidating for almost two months. Also we saw "SPRING" pattern during the re-accumulation.
Relative Strength, Money Flow and Buying pressure all positive. Today the stock is trying to move out of the re-accumulation zone. A positive close with volume support above 502 will take the stock to higher levels.
