SILVER BEST PLACE TO BUY FROM|LONG
SILVER SIGNAL
Trade Direction: long
Entry Level: 5,701.3
Target Level: 5,814.5
Stop Loss: 5,626.2
RISK PROFILE
Risk level: medium
Suggested risk: 1%
Timeframe: 1h
Disclosure: I am part of Trade Nation's Influencer program and receive a monthly fee for using their TradingView charts in my analysis.
✅LIKE AND COMMENT MY IDEAS✅
Techincalanalysis

GBP/USD BULLISH BIAS RIGHT NOW| LONG
Hello, Friends!
Bullish trend on GBP/USD, defined by the green colour of the last week candle combined with the fact the pair is oversold based on the BB lower band proximity, makes me expect a bullish rebound from the support line below and a retest of the local target above at 1.324.
Disclosure: I am part of Trade Nation's Influencer program and receive a monthly fee for using their TradingView charts in my analysis.
✅LIKE AND COMMENT MY IDEAS✅

XAUUSD–Volume Profile buy scenario around 4,200, target 4,265+XAUUSD–Volume Profile buy scenario around 4,200, target 4,265+
Brian – Prioritize buying with the trend, use VAL to position entry
Market snapshot
At the end of the US session yesterday, gold had a strong increase and then stabilized, currently moving sideways around 4,216 on H1.
The structure is still an uptrend, the current decline is mainly a technical correction within the value area.
On the chart, the 4,264–4,265 area is marked as important resistance, where if broken, the medium-term uptrend could be unleashed more strongly.
Volume Profile & key price areas
The VAL (Value Area Low) of the Volume Profile is currently around 4,200 – this is an area where the market has previously accepted a large volume of trades, suitable for trend-following buys.
A deeper support area is around 4,164 (Supportsides on the chart), where buyers have previously intervened very clearly.
Above: 4,265 – confirmed resistance, if broken will strengthen the scenario of gold heading to higher price areas, matching the "super cycle 5,000 USD" story in the long term.
Trading plan for next week (according to H1 & Volume Profile)
Priority scenario – Buy at VAL with the trend
Buying area: around 4,200 (VAL of Volume Profile).
Can flexibly range 4,198–4,203 depending on spread and market conditions.
Idea: wait for the price to pull back to the VAL area, observe H1 candle reactions (long lower tail, rejection candles...) before entering the order.
Immediate targets:
TP1: area 4,240–4,245
TP2: 4,265 – important resistance marked as "important resistance, confirming medium term increase".
If the price closes clearly above 4,265 and successfully retests, consider holding part of the position or finding additional entry points, according to the scenario of expanding to higher areas in the new cycle.
Defensive scenario – Deep support
If the 4,200 area does not hold, the 4,164 area will be the next support to watch.
Closing H1/D1 below 4,164 will be a signal to reduce short-term expectations and wait for a new structure instead of trying to "buy every dip".
Fundamental context – Reasons gold is still supported
Gold is heading for its best growth year since 1979, with an increase of over 60% in 2025 – this is the context of a true bull market, not just a recovery wave.
YTD performance of XAU outperforms BTC, showing that large capital flows prioritize stability and gold's safe haven role.
Current supporting factors: US bond yields cooling, USD weakening.
Geopolitical tensions escalating, Russia–US negotiations have not brought clear breakthroughs.
The market prices in nearly a 90% chance of the Fed cutting rates at the next meeting, making non-yielding assets like gold more attractive.
Follow Brian to share the Gold scenario together

$1INCH/USDT ANALYSISOn the 3-day chart of 1INCH/USDT, the price is trading inside a long-term descending triangle pattern, capped by a strong downtrend line from the previous major high near $0.60. The horizontal support zone around $0.16–$0.18 has repeatedly held since early 2025, acting as a major accumulation base. Each dip into this area has been met with buying pressure, shown by long lower wicks and volume spikes, confirming it as a strong demand zone. However, momentum remains weak as the candles are still forming below the Ichimoku cloud, keeping the broader trend bearish.
Currently, 1INCH is consolidating near $0.19, facing resistance from the descending trendline and lower edge of the cloud near $0.22–$0.24. A decisive breakout and close above that zone would be the first sign of a potential trend reversal, possibly targeting $0.28–$0.32 in the mid-term. But if the price fails to hold above the $0.16–$0.18 support and breaks down, it could extend lower toward $0.13–$0.14, which is the next major liquidity pocket. Overall, the structure remains bearish-neutral, with accumulation signs at the base but no confirmed reversal until a breakout above the descending trendline.

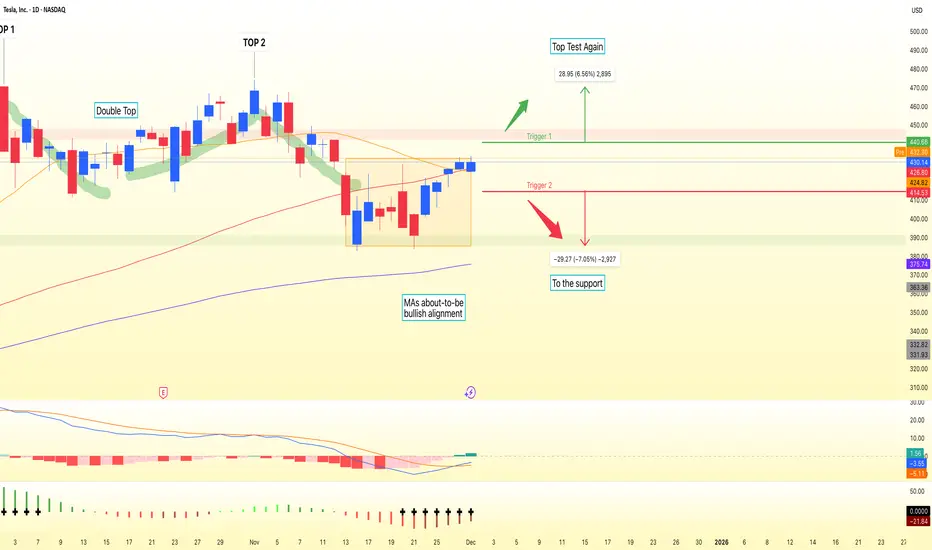
TSLA Range Breakout SetupTesla on the daily chart is stuck in a tight battleground between structure and momentum. Price is consolidating below the 20- and 60-day moving averages after a bearish Market Structure Shift in early November, while still holding above the long-term 120-day moving average. The result is a classic Bear Flag look: a sharp downside pole followed by a choppy, upward-sloping consolidation between the $400 demand zone and $440 supply zone.
As long as TSLA trades inside this band, it’s a range game. The primary path is continuation lower if the Bear Flag resolves as expected. A daily close below roughly $415 would put pressure on the $400 support and open the way toward the $385 area, aligning with the flag breakdown logic and recent downside momentum. For this bearish continuation view, a sustained close back above $430–440 would effectively invalidate the pattern and suggest sellers are losing control.
On the flip side, a clean daily close above $440 would flip the script, clearing both key moving averages and turning the zone into support. That breakout could unlock a move toward the prior October swing region around $470, with the idea invalidated if price drops back into the range and especially below $400. This is a study, not financial advice. Manage risk and invalidations.
Thought of the Day 💡: Often the edge is in letting the market show its hand at the extremes of the range, not in guessing the next candle.
-------------------------
Thanks for your support!
If you found this idea helpful or learned something new, drop a like 👍 and leave a comment, I’d love to hear your thoughts!
CAD/CHF BEARS ARE STRONG HERE|SHORT
Hello, Friends!
CAD-CHF uptrend evident from the last 1W green candle makes short trades more risky, but the current set-up targeting 0.571 area still presents a good opportunity for us to sell the pair because the resistance line is nearby and the BB upper band is close which indicates the overbought state of the CAD/CHF pair.
Disclosure: I am part of Trade Nation's Influencer program and receive a monthly fee for using their TradingView charts in my analysis.
✅LIKE AND COMMENT MY IDEAS✅

NZD/CAD SHORT FROM RESISTANCE
NZD/CAD SIGNAL
Trade Direction: short
Entry Level: 0.801
Target Level: 0.800
Stop Loss: 0.802
RISK PROFILE
Risk level: medium
Suggested risk: 1%
Timeframe: 1h
Disclosure: I am part of Trade Nation's Influencer program and receive a monthly fee for using their TradingView charts in my analysis.
✅LIKE AND COMMENT MY IDEAS✅

EURUSD SMC ICT ANALYSISMarket mostly move from external range liquidity to internal range liquidity.
now in eurusd , market has already taken buy side trendline liquidity & form strong bearish reaction which mean we can expect selling move.
4hr bullish ob is unmitigate , which increase the chance of selling.
Currently smc market structure is bearish , which signal selling looks valid.

USOIL BEARS WILL DOMINATE THE MARKET|SHORT
Hello, Friends!
USOIL pair is in the uptrend because previous week’s candle is green, while the price is obviously rising on the 4H timeframe. And after the retest of the resistance line above I believe we will see a move down towards the target below at 58.36 because the pair overbought due to its proximity to the upper BB band and a bearish correction is likely.
Disclosure: I am part of Trade Nation's Influencer program and receive a monthly fee for using their TradingView charts in my analysis.
✅LIKE AND COMMENT MY IDEAS✅

EUR/GBP BEARS ARE GAINING STRENGTH|SHORT
Hello, Friends!
EUR/GBP pair is trading in a local downtrend which know by looking at the previous 1W candle which is red. On the 4H timeframe the pair is going up. The pair is overbought because the price is close to the upper band of the BB indicator. So we are looking to sell the pair with the upper BB line acting as resistance. The next target is 0.873 area.
Disclosure: I am part of Trade Nation's Influencer program and receive a monthly fee for using their TradingView charts in my analysis.
✅LIKE AND COMMENT MY IDEAS✅

USD/JPY BUYERS WILL DOMINATE THE MARKET|LONG
Hello, Friends!
We are going long on the USD/JPY with the target of 155.896 level, because the pair is oversold and will soon hit the support line below. We deduced the oversold condition from the price being near to the lower BB band. However, we should use low risk here because the 1W TF is red and gives us a counter-signal.
Disclosure: I am part of Trade Nation's Influencer program and receive a monthly fee for using their TradingView charts in my analysis.
✅LIKE AND COMMENT MY IDEAS✅

GOLD LONG FROM SUPPORT
GOLD SIGNAL
Trade Direction: long
Entry Level: 4,043.86
Target Level: 4,189.14
Stop Loss: 3,946.77
RISK PROFILE
Risk level: medium
Suggested risk: 1%
Timeframe: 9h
Disclosure: I am part of Trade Nation's Influencer program and receive a monthly fee for using their TradingView charts in my analysis.
✅LIKE AND COMMENT MY IDEAS✅

EUR/AUD SELLERS WILL DOMINATE THE MARKET|SHORT
Hello, Friends!
We are going short on the EUR/AUD with the target of 1.771 level, because the pair is overbought and will soon hit the resistance line above. We deduced the overbought condition from the price being near to the upper BB band. However, we should use low risk here because the 1W TF is green and gives us a counter-signal.
Disclosure: I am part of Trade Nation's Influencer program and receive a monthly fee for using their TradingView charts in my analysis.
✅LIKE AND COMMENT MY IDEAS✅

TSLA: Hold or SellHello Traders,
Regarding the technical point of view!
Telsa have been previously overbought. there are two resistances on its way! 1st the dynamic and 2nd the static one!
A triangle shape has been formed!
If you have it right now, I'm more with keeping it!
But you may find more profitable stocks to buy!

XAU/USD: Buy Gold at 4,217 or FVG 4,182!📊 Market Structure
Gold continues to maintain a strong upward structure after creating a series of BoS continuously from the 4,156 USD region.
This morning's H1 breakout pushed the price above the short-term peak, confirming that the BUY side is in full control.
The price is currently returning to retest the Demand intraday 4,217 – 4,210 USD area — this is the first support area where buyers can continue to push the upward wave.
If the pullback is deeper, gold may reach the FVG 4,182 – 4,172 USD area, coinciding with fibo 0.5 – 0.618 → the most attractive discount area in this wave.
The main trend remains bullish as long as the price stays above:
• 4,217 – Demand 1
• 4,182 – FVG Discount
• 4,156 – Key Demand Zone
💎 Key Technical Zones
• Demand Zone 1: 4,217 – 4,210
• FVG Discount: 4,182 – 4,172
• Strong Demand (structure holding bottom): 4,156
• Target Zones:
– 4,285
– 4,309
– 4,321
– 4,342
– 4,369 (liquidity above peak)
🎯 Trading Plan – Prioritize BUY
1️⃣ BUY 1 – Retest Demand 4,217
When the price touches 4,217 – 4,210 with confirmation signals (long wick, H1 engulfing).
• Entry: 4,217 – 4,210
• SL: below 4,200
• TP1: 4,285
• TP2: 4,309
• TP3: 4,342
• TP4: 4,369
→ Quick setup – follow the momentum.
2️⃣ BUY 2 – Deep Pullback to FVG 4,182
In case the price shakes strongly before continuing to push the wave.
• Entry: 4,182 – 4,172
• SL: below 4,156
• TP: 4,217 → 4,285 → 4,342
→ This is the “best” price area to accumulate BUY in the session.
🧠 Vincent’s View
H1 shows a strong upward structure, clear momentum. The current adjustment is just a technical pullback before hitting the upper liquidity levels.
As long as gold stays above 4,182 – the trend remains bullish and the targets 4,285 – 4,342 are entirely feasible.
“Smart money buys the dip — not the hype.” ⚜️
⏰ Timeframe: 1H
📅 Updated: 01/12/2025
✍️ Analysis by: Captain Vincent

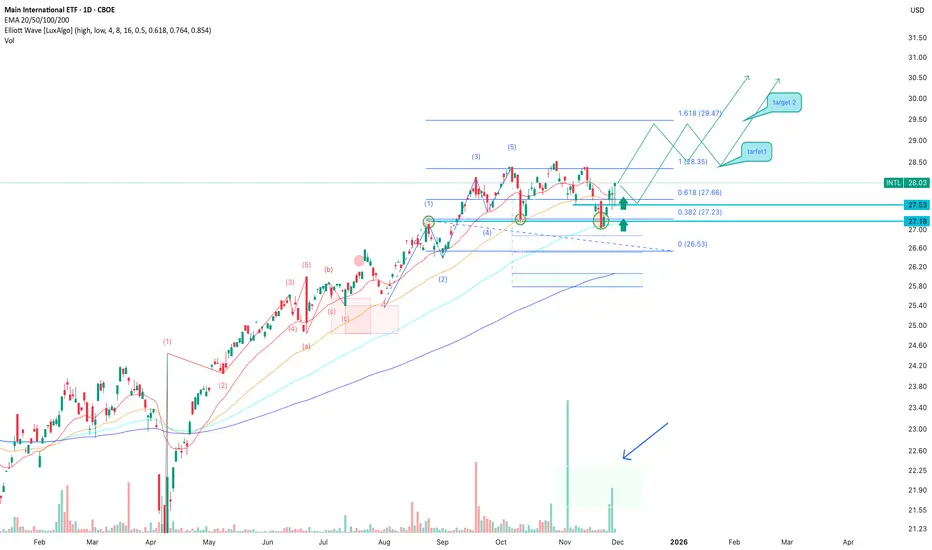
INTL: Bulls Defend Support — Buy Zone ActiveINTL remains one of the more stable international ETFs, and recent weeks show growing interest from larger players — rising volume at local lows signals accumulation. Fundamentally, the ETF is supported by diversified exposure to global companies, relatively low volatility, and renewed capital inflows into international markets as the USD cools off. This macro backdrop creates a solid foundation for a medium-term continuation of the uptrend, especially if expectations of potential Fed easing stay in place.
Technically, the price continues to defend the key support area at 27.50–27.20, where buying activity has appeared multiple times. The decline looks like a correction inside a broader bullish structure, while EMA 20/50/100 indicate a possible recovery. The Elliott wave structure also keeps the potential for a new impulsive move. A confirmed breakout above 28.35 would open the path toward 29.47 as the first target. The optimal entry is either after a confirmed hold above 28.00 or on a retest of 27.50–27.20 if a reversal signal forms.
NG1! SENDS CLEAR BEARISH SIGNALS|SHORT
NG1! SIGNAL
Trade Direction: short
Entry Level: 4.849
Target Level: 4.149
Stop Loss: 5.315
RISK PROFILE
Risk level: medium
Suggested risk: 1%
Timeframe: 1D
Disclosure: I am part of Trade Nation's Influencer program and receive a monthly fee for using their TradingView charts in my analysis.
✅LIKE AND COMMENT MY IDEAS✅

AUD/USD BEARS ARE GAINING STRENGTH|SHORT
Hello, Friends!
We are now examining the AUD/USD pair and we can see that the pair is going up locally while also being in a uptrend on the 1W TF. But there is also a powerful signal from the BB upper band being nearby, indicating that the pair is overbought so we can go short from the resistance line above and a target at 0.649 level.
Disclosure: I am part of Trade Nation's Influencer program and receive a monthly fee for using their TradingView charts in my analysis.
✅LIKE AND COMMENT MY IDEAS✅

AAPL SELLERS WILL DOMINATE THE MARKET|SHORT
AAPL SIGNAL
Trade Direction: short
Entry Level: 278.86
Target Level: 262.87
Stop Loss: 289.53
RISK PROFILE
Risk level: medium
Suggested risk: 1%
Timeframe: 6h
Disclosure: I am part of Trade Nation's Influencer program and receive a monthly fee for using their TradingView charts in my analysis.
✅LIKE AND COMMENT MY IDEAS✅

NZD/USD BEARISH BIAS RIGHT NOW| SHORT
Hello, Friends!
The BB upper band is nearby so NZD-USD is in the overbought territory. Thus, despite the uptrend on the 1W timeframe I think that we will see a bearish reaction from the resistance line above and a move down towards the target at around 0.554.
Disclosure: I am part of Trade Nation's Influencer program and receive a monthly fee for using their TradingView charts in my analysis.
✅LIKE AND COMMENT MY IDEAS✅

GBP/USD BEST PLACE TO SELL FROM|SHORT
Hello, Friends!
Previous week’s green candle means that for us the GBP/USD pair is in the uptrend. And the current movement leg was also up but the resistance line will be hit soon and upper BB band proximity will signal an overbought condition so we will go for a counter-trend short trade with the target being at 1.297.
Disclosure: I am part of Trade Nation's Influencer program and receive a monthly fee for using their TradingView charts in my analysis.
✅LIKE AND COMMENT MY IDEAS✅

ANFIBO XAUUSD – Fibonacci Breakout and Continuation Plan
Hi guys, Anfibo’s here!
XAUUSD Weekly Trading Plan
Overall Picture
On the 4H chart, gold has broken out of the previous descending trendline and is now trending inside a rising bullish channel. Price is pushing toward the upper boundary of this channel, and the next key reaction zone is where:
The new uptrend channel resistance
The old descending trendline (now potential resistance)
And the Fibonacci extension cluster
all line up around the 4240s.
This is where I expect the market to show its hand:
Either give a short-term corrective pullback,
Or consolidate and build energy for a continuation rally toward the higher Fibonacci extensions (2.618 around the 4370–4380 zone).
Macro Context – Why USD Still Matters
From a macro perspective, the U.S. Government and Treasury have a direct impact on the U.S. Dollar Index (DXY) through:
Fiscal policy (budgets, new laws, spending programs)
Announcements from the administration
Treasury funding needs and issuance
At the same time, U.S. GDP data is a core driver of dollar sentiment:
Stronger‐than‐expected GDP → supports DXY → often weighs on gold.
Weaker GDP or slowdown signals → pressures DXY → tends to support gold.
So while the chart is clearly giving us a bullish technical structure, the strength or weakness of upcoming U.S. data will strongly influence whether gold can sustain a breakout beyond these Fibonacci levels or get capped and pull back deeper.
Trading Plan – Using Fibonacci and Structure
For next week, I’m working with one tactical short setup at resistance and one continuation buy setup on the dip.
>>> Scenario #1 – Short-Term SELL at Fibonacci Resistance
If price extends into the confluence zone around 4240+ and shows rejection, I’ll treat it as a counter-trend sell opportunity:
Sell entry: 4241 – 4243
Stop loss: 4248
Take profit levels:4210-4194-4165-4120
Idea: fade the first touch into the Fibonacci + trendline resistance box, targeting a corrective leg back towards mid-channel support and potentially the lower part of the structure around 4120 if sellers step in aggressively.
>>> Scenario #2 – BUY the Continuation from 4194 Support
If the market respects the breakout and only offers a shallow pullback, I’ll look to join the trend from the key support / Fibonacci area:
Buy entry: around 4194
Stop loss: 4185
Take profit levels:
TP1: 4210
TP2: 4235
TP3: higher extension zone toward the 2.618 area (4370+ if momentum continues)
Idea: use 4194 as a continuation buy zone, where broken resistance + Fib support align, aiming to ride the next impulsive leg higher inside the ascending channel.
Key Technical Levels for the Week
Resistance / Sell zone: 4241 – 4243
Intermediate resistance: 4235, then higher at the Fib extension band near 4370–4380
Support / Buy zone: 4194
Deeper supports: 4165 and 4120 (bottom of corrective structure)
As long as price holds above the 4165–4120 block on a closing basis, the medium-term bias remains bullish.
Risk Management
Treat the sell setup as tactical / short-term against higher timeframe bullish structure.
Always wait for clear confirmation (rejection wick, slowdown, or shift in 4H / 1H structure) at 4240s before entering shorts.
Keep Risk:Reward ≥ 1:2 on both scenarios; avoid forcing trades in the middle of the range.
Do not hold opposing positions simultaneously – follow the scenario the market confirms first.
If strong fundamentals (e.g., very strong GDP, hawkish fiscal tone) push DXY sharply higher or lower, be ready to reassess the bias instead of clinging to the plan.
Conclusion
Gold has flipped from a descending structure to a rising channel, and Fibonacci confluences are giving us clear, objective levels to work with next week. Whether price reacts with a short-term pullback from 4240s or respects 4194 as continuation support, we already know:
Where to sell tactically,
Where to buy with the trend,
And how our risk is defined.
LET THE LEVELS GUIDE YOU, TRADE WITH CONFIDENCE, AND STAY DISCIPLINED, GUYS! 💛📈

XAUUSD – Weekly Scenario: Target Expands to 4,580 RegionXAUUSD – Weekly Scenario: Target Expands to 4,580 Region
Brian – Only prioritize buying if the price remains above 3,996
1. Market Overview – Breaks Triangle, Confirms Uptrend
On the D1 frame, gold has clearly broken out of the accumulation triangle that lasted for weeks.
The sixth candle closed above the descending trendline – which has been the main resistance for a long time – indicating:
Buying power has returned to control the market.
There is a high probability that this is a confirmation of the medium-term uptrend.
Above, the 4,246 region is considered the next “trend confirmation point”:
If the price breaks and holds above 4,246, the path to higher regions, especially 4,360–4,380 and 4,560–4,580, will open according to the Fibonacci expansion roadmap on the chart.
In summary: moving into next week, the current structure supports the bullish scenario, viewing corrections mainly as opportunities to buy.
2. Technical Structure – From Breakout to Fibonacci Levels
The breakout from the triangle occurred after a series of higher lows, bouncing from the lower ascending trendline → leaning towards accumulation, not distribution.
Below the current price are important demand/support regions:
The trendline area around 4,110 – an area to watch for entry plans.
Deeper are the 4,040 and 3,920 regions if a strong correction occurs.
Above, the technical “roadmap” is quite clear:
Point 1: 4,246 – near resistance + retest of the old supply area.
Point 2: 4,360–4,380 – old ATH/peak area, coinciding with the 1.0 Fibonacci region on the chart.
Point 3: 4,560–4,580 – 1.618 Fibonacci region, also the expansion target for the medium-term bullish scenario.
As long as D1 maintains the higher high – higher low pattern and does not break 3,996, the priority remains to view gold in the “buy the dip” frame.
3. Price Zones & Trading Ideas for Next Week
This is not personalized advice, but how Brian is mapping the chart for himself:
Main Scenario – Buy on Trendline/Support
Watch area: around the ascending trendline area of 4,110.
If early in the week there is a correction to this area with a nice candle reaction on H4/D1 (long lower tail, bullish engulfing…), that is the area I prioritize for finding a Buy entry point.
Target roadmap:
Target 1: 4,246 – resistance & trend confirmation area.
If break & retest 4,246 successfully from above, the next bullish wave could expand to 4,360–4,380.
Extended Target: 4,560–4,580 according to 1.618 Fibonacci as shown in the image.
Secondary Scenario – Use Fibonacci Area When Price Exceeds 4,246
When gold exceeds and holds above 4,246, then the 4,360–4,380–4,580 areas will be:
Areas to partially take profit / move SL to protect profits.
At the same time, short pullbacks from this area, if still respecting the uptrend structure, can continue to be opportunities to buy more with the final target of 4,580.
Invalidation Level:
Closing D1 below 3,996 will ruin the current uptrend structure.
At that point, I will stop the medium-term buy strategy, stand aside to observe and wait for a new structure, instead of holding onto the old view.
4. Fundamental Perspective – Why is Gold Still Supported?
On the macro side, gold is being affected by the interplay of:
Tariffs & trade tensions → increasing demand for defense, hedging policy risks.
War and geopolitical conflicts → maintaining gold’s classic “safe haven” role.
End of interest rate cycle: after a long period of interest rates being “pumped” high, the market is increasingly focused on the question “when” rather than “if” they will decrease. This makes non-yielding assets like gold more attractive in the eyes of long-term capital.
Overall, the current fundamental picture is limiting the deep decline of gold: each strong drop often soon sees bottom-fishing buying power, as long as the technical structure is not broken.
5. Strategy & Risk Management
In the coming week, Brian’s bias is quite clear:
→ Prioritize buying on corrections, as long as the price remains above 3,996.
The trendline area around 4,110 is the first place I pay attention to for the buy scenario; if the market is “more generous” and pulls deeper to 4,040–4,000 but still maintains the uptrend structure, that is an even more attractive price for a medium-term position.
Most importantly:
The order volume must be suitable for the account.
Have a plan to move SL/take profit when the price approaches each point 4,246 → 4,360 → 4,580, instead of trying to “hold the peak.”
