XRP mid-term TAXRP army is having difficult times, Ripple is far from falling, in fact it's turning more and more bearish including the long-term trend. Current pivot support area is around $1.25 exactly the same area during the last flash drop.
Technical Analysis

USDJPY Bullish Structure Approaches High-Risk Supply AreaUSDJPY (30-Minute) – Bullish Continuation Into a Critical Reversal Zone
This USDJPY 30-minute chart clearly shows strong bullish momentum after a clean breakout from a symmetrical consolidation structure. Price action respects structure, volume behavior, and key zones, making this setup ideal for short-term and intraday traders who wait for confirmation rather than chasing price.
Market Structure & Price Action
USDJPY was previously trading inside a tight consolidation / wedge-like structure, showing indecision and compression. This phase acted like a spring — storing energy before the move. Once price broke above the upper trendline, buyers stepped in aggressively, confirming a valid bullish breakout.
After the breakout, price formed higher highs and higher lows, which confirms that the market is now in a short-term bullish trend. The impulsive candles following the breakout show strong buyer conviction, not a weak or false move.
Breakout Confirmation & Momentum
The breakout was not random. It occurred after multiple rejections inside the structure, indicating that sellers were getting weaker. Once resistance was broken, price did not immediately pull back deeply — a classic sign of trend strength.
Momentum remains bullish as long as price holds above the breakout level. However, price is now approaching a pre-marked supply / reversal zone, which increases the probability of a reaction.
Key Resistance & Reversal Zone
The highlighted green area represents a high-probability reversal zone, where:
Previous selling pressure exists
Liquidity is likely resting above highs
Smart money may look to take profits
The chart specifically highlights a “Volume Burst” zone, meaning if price enters this area with increasing volume, it could signal either:
A final push (liquidity grab), or
Exhaustion leading to a reversal
At this level, blind buying is risky. The note “Pattern Needed” is very important — traders should wait for clear confirmation before taking any position.
Trading Scenarios to Watch
Bullish Scenario:
If price breaks and closes above the reversal zone with strong volume and structure continuation, it would indicate buyers are still in control, opening the door for further upside continuation.
Bearish / Pullback Scenario:
If price forms a rejection pattern (such as a bearish engulfing candle, long upper wick, or lower high) inside this zone, it may signal a short-term correction or deeper pullback, targeting previous breakout levels.
Trading Psychology & Execution
This chart is a perfect example of why patience matters. The move is already extended, and chasing price here carries poor risk-to-reward. The smart approach is:
Let price come into the zone
Watch how it reacts
Enter only after confirmation
This is how professional traders protect capital and trade probabilities, not emotions.
Summary
USDJPY remains bullish overall, but price is now testing a critical decision-making area. The next move will depend on price behavior and volume reaction inside the reversal zone. Stay disciplined, wait for confirmation, and let the market show its hand before committing to a trade.

BTCUSDT 30M Analysis – Liquidity, Reversal & Retest AnalysisBTCUSDT (Bitcoin Perpetual) – 30M Liquidity, Reversal & Retest Analysis
This 30-minute BTCUSDT perpetual chart presents a clean smart-money narrative, showing how price reacted from a discount reversal zone and is now approaching a major supply / decision area where the next directional move will be defined.
Strong Sell-Off & Liquidity Flush
On the left side of the chart, Bitcoin experiences a sharp bearish impulse, breaking market structure and accelerating to the downside. This move is aggressive, emotional, and volume-driven — a classic liquidity flush designed to trigger panic selling and stop-losses from late buyers.
This impulsive drop sets the stage for a potential mean reversion rather than continuation.
Discount Reversal Zone Reaction
Price taps into a clearly marked Reversal Zone near the lows. This area aligns with:
Discount pricing
Prior demand
Sell-side liquidity being fully taken
The reaction is immediate and strong, confirming institutional buying interest. Long wicks and strong bullish candles indicate absorption of selling pressure and the beginning of a controlled recovery.
Shift in Market Structure (Internal BOS)
Following the bounce, BTC prints a clean bullish impulse, breaking internal lower highs. This suggests a short-term shift in structure, transitioning from bearish continuation to bullish corrective or reversal mode.
This move is not random — it is technically supported by liquidity and structure alignment.
Approach Into Supply / Premium Zone
Price is now rallying directly into a previous supply / resistance zone, highlighted in green. This area previously caused strong selling pressure and is considered a premium zone where smart money typically looks for shorts, not fresh longs.
The chart clearly notes:
Volume Burst expected on first touch
Retesting phase inside the zone
Need for a bearish confirmation pattern
This means buyers are likely pushing price up to distribute positions, while sellers wait for confirmation to enter.
Key Scenario Expectations
At current levels, BTC is at a make-or-break zone:
Bearish Scenario (High Probability):
If price forms rejection wicks, bearish engulfing, or lower timeframe structure breaks, this zone can act as a distribution area, leading to a pullback or deeper correction.
Bullish Continuation Scenario:
A strong 30M close above the supply zone with sustained volume would invalidate the short idea and open the path toward higher liquidity targets.
Until confirmation appears, patience is critical.
Trading Psychology Insight
This chart reflects a common trap:
Retail traders chase the bullish move after a strong bounce, while smart money waits at premium levels to fade the rally. The note “Need Any Bearish Pattern” reinforces the importance of confirmation over prediction.
Overall Bias
Short-term: Bullish correction
Current zone: High-risk longs / potential short setup
Best strategy: Wait for bearish confirmation inside supply
Market behavior: Liquidity-driven, not trend-driven
Final Thought
This BTCUSDT setup is a textbook example of buying fear at discount and selling strength at premium. The next move will not come from guessing — it will come from reaction and confirmation at this key zone.
⚠️ Always manage risk and wait for confirmation. This is a technical perspective, not financial advice.

XAUUSD (Gold Spot) – 2H Market Structure & Liquidity AnalysisXAUUSD (Gold Spot) – 2H Market Structure & Liquidity Analysis
This 2-hour XAUUSD chart clearly highlights a liquidity-driven market, where price is reacting precisely around key supply, demand, and liquidity levels. The structure shows how smart money manipulation plays out before the next directional move.
Higher Timeframe Liquidity Sweep & Rejection
At the top of the chart, price sweeps the previous 1D high, labeled as “1D Sweep / Rejection”. This is a classic liquidity grab, where buy-side liquidity above the highs is taken, followed by an aggressive rejection. The long upper wick confirms strong selling pressure from premium levels, signaling that institutions used this area to distribute positions rather than continue higher.
This rejection shifts market bias from bullish continuation to range or corrective behavior.
Cold Squeeze & Compression Phase
On the left side, price consolidates inside a tight range marked as “Cold Squeeze”. This area represents low volatility and order accumulation, where both buyers and sellers are trapped. Such zones often precede strong impulsive moves, and in this case, price eventually expands out of the range with increased volatility.
Supply Used & Rising Wedge Formation
As price moves lower, we see a labeled “Supply Used” zone, meaning sellers previously active here have already been absorbed. Following that, price forms a rising wedge / ascending channel, which is a bearish corrective structure rather than true bullish strength.
This wedge acts as a pullback within a broader bearish context, allowing smart money to reload sell positions while retail traders chase longs.
QFL Reaction & Weak Highs
Near the mid-section of the chart, price reacts around a QFL (Quasimodo / Failed Low-High concept) area. The highs formed here are weak and overlapping, showing lack of momentum. This confirms that buyers are struggling to push price higher sustainably.
Indecision Zone & Any-Side Break
On the right side, price enters a tight consolidation marked as “Any-side Break”. This zone represents market indecision, where liquidity is building on both sides. A strong candle close above or below this range will likely trigger a sharp impulsive move as stop orders get activated.
Until that break happens, the market remains neutral and reactive, favoring short-term scalps rather than aggressive directional trades.
Key Reversal Zone Below
Below current price, a clearly marked Reversal Zone sits around the discount area. This zone aligns with:
Previous demand
Liquidity resting below equal lows
A potential mitigation area for bullish reaction
If price breaks down from the current range, this zone becomes a high-probability bounce or reversal area, especially if bullish confirmation appears on lower timeframes.
Overall Market Bias
Short-term bias: Neutral → Waiting for range breakout
Above range: Possible stop-hunt but expect selling pressure again
Below range: High probability move toward the reversal / demand zone
Smart money behavior: Liquidity sweeps, false breakouts, and controlled distribution
Trading Insight
This chart is a textbook example of liquidity engineering. Instead of chasing direction, the smarter approach is to wait for confirmation after the any-side break, then align entries with liquidity targets and higher timeframe context.
Patience here is key — the market is loading fuel, not yet revealing direction.
⚠️ Note: Always wait for confirmation and manage risk properly. This analysis is based on price action and liquidity concepts, not financial advice.

CHFJPY: Waiting for Breakout 🇨🇭🇯🇵
CHFJPY is trading in a strong bullish trend on a daily.
The price is currently testing a resistance based on a current ATH.
If the market breaks and closes above 196.4 level today,
I will expect another wave up.
Next goal will be 197.0 level then.
❤️Please, support my work with like, thank you!❤️
I am part of Trade Nation's Influencer program and receive a monthly fee for using their TradingView charts in my analysis.

Gold Is Quiet — But Pressure Is BuildingGold is maintaining a bullish continuation structure, not showing signs of distribution.
- Trend: Price is moving inside a rising channel with higher lows intact.
- Structure: Pullbacks are corrective and shallow, showing buyers defending each dip.
- Dynamic Support: Price is holding above EMA 34 & EMA 89 → bullish control remains.
Key Levels:
- Target 1: 4,348
- Target 2 (Old ATH): 4,379
Outlook
Primary scenario: Consolidation → push to Target 1 → extension toward Old ATH.
Alternative: Short-term pullback to channel support to reload before continuation.
Focus:
As long as price holds above the rising channel and EMAs, bias stays bullish.
Patience here is part of the trade.

Smart Money Is Testing Patience — Not Selling YetEthereum is currently consolidating inside a clear range, not breaking trend.
- Structure: Price rejected from the resistance zone and dropped into the lower range, but support is holding.
- Behavior: The sideways movement near support shows liquidity absorption, not panic selling.
Key Levels:
- Support zone remains intact
- Resistance zone is still the ceiling to watch
Outlook
Primary scenario: Range hold → base formation → rebound toward range high / resistance
Invalidation: Only a clean breakdown below the support zone changes the bias
Key Focus:
Do not chase candles. Let the market show direction after accumulation.

Gold Is Not Hesitating — It Is Building Energy for a New ATH.Gold on the H1 timeframe continues to display a bullish consolidation directly below the previous high at 4,380 , a structure that typically precedes continuation rather than reversal. Price is holding firmly inside a well-defined range, with higher lows forming repeatedly while pullbacks remain shallow and controlled. This behavior signals absorption of supply, not distribution sellers are active near resistance, but they are failing to push price into acceptance below the support zone. As long as Gold holds above the 4,260–4,270 support area, the broader bullish structure remains intact.
From a market-structure perspective, this sideways action below ATH reflects strength. In strong trends, markets often pause near highs to build liquidity before expanding again. The repeated tests of the upper range, combined with higher lows, suggest pressure is coiling rather than fading. A clean acceptance above 4,380 would likely unlock a break into new ATH territory , while failure to break simply extends the consolidation phase, not invalidates the trend.
From a macro standpoint, conditions remain supportive for Gold. U.S. monetary policy expectations continue to lean toward easing in 2025, keeping real yields capped and limiting sustained USD strength. At the same time, ongoing geopolitical risks and global economic uncertainty continue to underpin safe haven demand. These factors reduce the probability of a deep corrective sell-off and favor sideways-to-higher price action instead.
Bottom line: Gold is not topping it is positioning. As long as support holds, the technical and macro alignment favors a breakout above the previous high. Patience is required, but the bias remains firmly bullish until proven otherwise.

Ethereum Is Compressing After Repeated Sell-OffOn the H1 timeframe, Ethereum continues to show a clear bearish structure, defined by a series of sharp impulsive sell-offs followed by weak, overlapping consolidations. Each prior bounce has failed to develop into a meaningful recovery, and price continues to form lower highs, confirming that sellers remain in control. The current sideways movement near 2,840 is corrective in nature, not a base for reversal.
Structurally, ETH is displaying a classic bearish pause: volatility expansion to the downside, followed by tight compression with declining momentum. This type of price behavior typically precedes continuation, not reversal. As long as price remains capped below the recent breakdown area, the probability favors another leg lower, with downside liquidity sitting below the current consolidation range.
From a macro and U.S. policy perspective, Ethereum remains under pressure from the same forces weighing on broader crypto markets. The Federal Reserve’s restrictive monetary stance, elevated real yields, and a relatively firm USD continue to drain liquidity from risk assets. In addition, ETH lacks a near-term narrative strong enough to offset macro headwinds, especially in an environment where capital remains selective and risk appetite is subdued.
Bottom line:
Ethereum is not building strength it is absorbing supply after repeated sell-offs. Until macro conditions ease or ETH reclaims key resistance with acceptance, rallies should be treated as temporary pauses within a broader bearish sequence, with downside continuation remaining the higher-probability scenario.

Bitcoin Is Stabilizing After the Sell-OffOn the H4 timeframe, Bitcoin is currently trading inside a clear range, bounded by a well-defined support zone near 85,200 and a resistance zone around 90,500. The sharp drop from resistance confirms strong sell-side pressure at the highs, while the subsequent bounce from support shows that buyers are still defending key demand. However, price action in the middle of the range remains overlapping and corrective, signaling balance rather than trend continuation.
From a technical structure perspective, BTC has not yet reclaimed any major lower high. The current recovery leg is shallow and lacks impulsive follow through, suggesting it is a reactive bounce, not a trend reversal. As long as price remains below the 90,500 resistance band, upside moves should be treated as range rotations. A failure to hold above the mid-range would open the door for another test of the lower support zone, where liquidity is concentrated.
From a macro and U.S. policy standpoint, conditions continue to weigh on crypto markets, including Bitcoin. The Federal Reserve remains in a restrictive policy regime, keeping interest rates elevated and liquidity tight. High real yields and a strong USD environment reduce the attractiveness of non-yielding and high-risk assets like BTC. In addition, ongoing uncertainty around U.S. fiscal dynamics and regulatory pressure keeps institutional flows cautious, limiting upside momentum.
Bitcoin is not breaking down aggressively, but it is also not ready to trend higher. This is a range-bound market shaped by macro headwinds and liquidity restraint. Until BTC can reclaim resistance with acceptance — or macro conditions shift decisively toward risk-on the higher-probability path remains rotation within the range, not a sustained breakout. Patience and respect for structure remain critical here.

GBP/USD Is Trapped in a RangeOn the H1 timeframe, GBP/USD is currently consolidating inside a clearly defined range, capped by a resistance zone near 1.3450–1.3460 and supported by a demand area around 1.3315–1.3320. The sharp rejection from resistance followed by a strong bounce off support confirms that both buyers and sellers are active, keeping price compressed rather than trending. Current price action is overlapping and corrective, typical of a market waiting for a catalyst.
From a technical structure standpoint, the rebound from support lacks impulsive follow-through. Higher highs have not been reclaimed, and price is still trading below the key resistance ceiling. As long as GBP/USD remains below the 1.3450 zone, upside moves should be viewed as range rotations, not trend continuation. A clean acceptance above resistance would be required to unlock bullish continuation; otherwise, price risks drifting back toward the lower boundary of the range.
From a macro and policy perspective, GBP/USD remains heavily influenced by diverging expectations between the Federal Reserve and the Bank of England. The Fed’s restrictive stance and relatively strong U.S. data continue to support the USD, limiting upside for GBP. At the same time, the UK outlook remains fragile, with growth concerns and uncertainty around how long the BoE can maintain restrictive policy without further economic strain. This macro imbalance keeps GBP/USD in balance rather than allowing directional expansion.
Bottom line:
GBP/USD is not trending it is waiting. With macro forces keeping both sides cautious, price is likely to continue rotating between support and resistance until a clear policy or data driven catalyst emerges. The edge lies in respecting the range and waiting for confirmation, not anticipation.

Ethereum Is Still Under Sell-Side ControlOn the H4 timeframe, Ethereum remains firmly embedded in a bearish market structure, defined by a sequence of lower highs and lower lows. Each rebound is shallow and corrective, failing at clearly marked resistance levels around 3,260 → 3,170 → 3,020 , which confirms that sellers continue to defend supply aggressively. These stepped reactions lower are characteristic of distribution within a downtrend, not accumulation for reversal. The current bounce from ~2,830 lacks impulsive strength and remains below reclaimed structure, keeping downside risk active.
From a price-structure perspective, ETH is now trading in a weak recovery leg after a sharp sell-off, with price vulnerable to another rejection below 2,860–2,900 . As long as ETH fails to reclaim 3,020 with acceptance, any upside should be treated as a sell-side rotation rather than a bullish signal. A break back below the current base would expose the major support zone around 2,700–2,650 , which acts as the next liquidity magnet on the chart.
From a macro and U.S. policy standpoint, conditions remain unfavorable for crypto, including Ethereum. U.S. monetary policy is still effectively restrictive, with real yields elevated and liquidity expansion limited. The Fed’s stance of keeping policy tight for longer continues to suppress risk appetite, especially for high-beta assets like ETH. In addition, ongoing regulatory uncertainty and risk-off positioning into year-end reduce speculative inflows, reinforcing downside pressure rather than supporting a sustainable recovery.
Ethereum is not forming a confirmed bottom it is still operating under sell-side dominance. Until price reclaims key resistance levels and macro liquidity conditions improve, the higher-probability path remains range → rejection → continuation toward lower demand . Patience is critical here; the edge lies in respecting structure, not anticipating reversal.

Gold Is Accumulating for a Break — Not HesitatingGold on H1 continues to consolidate inside a clear accumulation zone after the impulsive upside move, with price holding above key support and forming higher lows. This price behavior reflects absorption rather than distribution, as sellers repeatedly fail to force acceptance below the range while buyers defend dips. Compression beneath the old ATH is a classic pre-expansion structure, where the market builds liquidity before choosing direction. As long as the accumulation floor holds, the technical bias remains bullish, with a breakout above the previous ATH as the primary resolution.
From a macro perspective, the backdrop remains supportive for Gold. Expectations around U.S. monetary policy continue to favor rate cuts in 2025, keeping real yields capped and limiting sustained USD strength. At the same time, year-end positioning, thinning liquidity, and ongoing geopolitical uncertainty reinforce demand for safe-haven assets. These factors reduce the probability of a deep corrective sell-off and favor consolidation resolving higher rather than breaking down.
In short, Gold is not stalling it is aligning technical structure with macro support. A clean acceptance above the accumulation high would likely unlock continuation toward new highs, while failure to break simply extends the buildup phase. Patience remains the edge until expansion confirms intent.

BTC Is Not Bottoming Yet — This Is a Controlled Sell-Side On the H4 timeframe, Bitcoin continues to trade within a clear downtrend structure. Each rebound has produced a lower high, followed by renewed selling that prints lower lows. The sideways boxes on the chart are not accumulation phases; they function as distribution / position-unwinding zones within a broader bearish trend, where price pauses to build liquidity before continuing lower. At this stage, BTC is still inside a weak corrective bounce and has not reclaimed any key structure that would justify a trend reversal narrative.
Key technical levels to respect:
- Near-term resistance / supply: 87.7k–88.0k (marked resistance zone). Failure to accept above this area keeps rallies corrective.
- Range support / demand: 85.1k–85.3k (range low). A clean break below this zone would confirm downside continuation.
- Structural liquidity target: 74.8k, the next major downside magnet if the range resolves lower.
Expected price behavior:
BTC is likely to continue short-term ranging, producing several push-and-fail attempts below resistance before rotating back toward the range low. A decisive breakdown of the range floor would open the path toward the 74.8k liquidity zone. Only a sustained reclaim and acceptance above 87.7k–88.0k would invalidate the current bearish structure.
Macro & U.S. Policy: Why Conditions Remain Unfavorable for Crypto
1) Monetary policy remains restrictive.
Despite expectations for gradual easing in 2025, U.S. monetary policy is still firmly in restrictive territory. This environment limits risk appetite and historically weighs on high-beta assets like crypto when liquidity expansion is absent.
2) Policy uncertainty suppresses risk-on behavior.
Ongoing ambiguity around the Fed’s policy path and broader U.S. macro direction keeps markets cautious. In such conditions, Bitcoin tends to move sideways or trend lower rather than sustain impulsive upside moves.
3) Regulatory and headline risk persists.
While long-term regulatory clarity may ultimately benefit the crypto space, near-term developments around regulation and oversight continue to act as headline risk, reinforcing defensive positioning especially during periods of thinner liquidity.
Conclusion:
Technically, BTC remains under sell-side control on H4, and macro conditions in the U.S. do not yet support a clean risk-on reversal. Until Bitcoin reclaims key resistance and breaks the sequence of lower highs, the higher-probability scenario remains range → breakdown → continuation toward lower demand.

Ethereum Is Still Under PressureEthereum on H1 remains locked inside a well-defined descending channel, with price continuing to respect the trendline resistance and failing to regain the key resistance zone around the 2,920–2,950 area. The recent bounce from the lows lacks impulsive strength and is forming overlapping price action, indicating a corrective rebound rather than a trend change. As long as ETH remains capped below channel resistance, downside risk stays active, with price vulnerable to another rotation lower toward the support zone near 2,780–2,750 and potentially deeper if selling pressure accelerates.
From a macro perspective, this technical weakness aligns with a cautious risk environment. Broader crypto markets are still sensitive to USD strength, real yields, and year-end positioning, where liquidity is thinner and downside moves can extend quickly if confidence fades. With no clear liquidity expansion catalyst yet, Ethereum lacks the macro support needed to break its bearish structure.
In summary, ETH remains in a bearish corrective phase within a downtrend. Below resistance, rallies are sell-side rotations, not opportunities to chase longs. The edge remains with patience and waiting for either a clear breakdown into demand or a structural reclaim that shifts both technical and macro alignment.

This ETH Bounce Is a Trap — The Real Move Hasn’t StartedETHEREUM MARKET ANALYSIS (ETHUSD – H4)
1. Current Price Structure
Ethereum is currently trading inside a well-defined descending channel, confirming a controlled bearish structure on the H4 timeframe. Price continues to respect both the upper and lower boundaries of the channel, forming lower highs and lower lows, which validates the short-term downtrend.
The recent rebound from the channel’s lower boundary is corrective in nature and does not yet signal a trend reversal. Structure remains intact unless price decisively breaks above the channel resistance.
2. Key Technical Zones
Resistance Zone: 2,900 – 2,960
This area aligns with:
- Upper boundary of the descending channel
- Previous breakdown structure
- Strong supply reaction zone
Support Zone: 2,620 – 2,650
This zone represents:
- Channel demand area
- Liquidity pool below recent lows
- Potential reaction zone for short covering or accumulation
As long as price trades below resistance, this zone caps upside attempts.
3. Market Behavior & Psychology
Ethereum is displaying textbook corrective behavior:
- Sharp impulsive drops followed by shallow consolidations
- Buyers attempting short-term rebounds, but failing to regain structure
- Sellers defending channel resistance aggressively
This reflects a market where smart money is distributing on pullbacks, while retail buyers attempt early reversals. The structure favors patience and discipline rather than anticipation.
4. Scenario Outlook
Primary Scenario – Trend Continuation (High Probability)
Price retests the resistance zone (2,900 – 2,960)
Rejection occurs at the channel top
ETH continues downward toward the support zone (2,620 – 2,650)
This scenario aligns with structure, momentum, and liquidity flow.
Alternative Scenario – Structural Shift (Low Probability)
Strong H4 close above channel resistance
Successful retest holding above 2,960
Opens the door for a deeper corrective rally
Until that happens, this scenario remains secondary.
5. Trading Guidance & Conclusion
Favor sell setups at resistance, not buys inside the channel
Avoid emotional bottom fishing without confirmation
Wait for structure break + acceptance before shifting bias
Conclusion:
Ethereum is still trading within a controlled bearish framework. The current bounce is corrective, not impulsive. Until the descending channel is broken with conviction, the path of least resistance remains to the downside, with the support zone as the next key destination.
Discipline and structure-based execution remain the edge in this environment.

Trend Holds Strong — Smart Money Still in ControlThe XAUUSD market continues to move precisely in line with the projected trend-following plan. After a controlled technical correction, price remains firmly above the key support zone and the MA structure, confirming that the broader bullish trend is still intact. Current price behavior shows consolidation just below resistance, with stable buying pressure and no aggressive selling a classic pre-continuation environment.
This phase reflects accumulation and supply absorption rather than weakness. Short-term pullbacks are functioning as liquidity shakeouts, allowing stronger hands to position in the direction of the main trend. As long as price respects the structural support, the preferred scenario remains a continuation to the upside.
From an intraday perspective, the market maintains a bullish bias, offering tactical opportunities on both sides while favoring trend-aligned entries.
Intraday Trading: Increase
📌 Timing Sell Zone (Short-Term Correction Trade)
XAUUSD SELL ZONE: 4369 – 4372
🎯 TP: 4366 – 4361
❎ SL: 4376
This setup targets a brief technical pullback within the broader uptrend. As a counter-trend trade, strict risk control is essential.
📌 Timing Buy Zone (Trend-Following Priority)
XAUUSD BUY ZONE: 4274 – 4277
🎯 TP: 4280 – 4285
❎ SL: 4270
This is the preferred setup, aligned with the dominant bullish structure. Pullbacks into this zone are considered healthy retracements and offer higher-probability entries in the direction of the trend.
Conclusion:
Market movement continues to validate the original analysis and roadmap. Discipline, patience, and trading with the prevailing trend remain the key advantages in the current environment. Always apply proper capital management to protect account safety and maintain consistency.

Bitcoin Isn’t Bouncing It’s Reloading for the Next DropBITCOIN (BTCUSD) – H1 MARKET ANALYSIS
1. Current Market Structure
Bitcoin is maintaining a clear short-term bearish structure on the H1 timeframe. Price continues to form lower highs and lower lows, confirming that sellers remain in control. The recent bounce is corrective and lacks follow-through, signaling weakness rather than trend reversal.
Key structural points:
- Breakdown below previous consolidation blocks
- Failure to reclaim prior value areas
- Bearish momentum remains dominant
2. Moving Averages & Trend Confirmation
- EMA 34 (blue) is acting as dynamic resistance
- EMA 89 (red) defines the broader bearish trend
Price remains below both EMAs, and every attempt to move higher is rejected a classic trend-following sell environment.
This alignment confirms that:
- Rallies are selling opportunities
- Trend continuation is favored over mean reversion
3. Consolidation & Liquidity Behavior
Bitcoin is currently compressing sideways just below resistance, forming a short consolidation range. This behavior indicates:
- Liquidity is being built
- Buyers are failing to regain control
- Market is preparing for the next impulsive move
In bearish conditions, this type of consolidation typically resolves to the downside.
4. Scenarios Ahead
Primary Scenario – Bearish Continuation (High Probability):
- Price continues to range briefly below EMA resistance
- Liquidity builds within the gray consolidation zone
- Breakdown triggers the next leg lower
Downside objectives:
- First support: ~85,800
- Expansion zone: 85,000 – 84,500 (liquidity draw)
Invalidation Scenario:
- Only valid if price breaks and holds above EMA 89
- Structure must shift to higher highs on H1
Until then, upside moves remain corrective.
5. Trading Bias & Conclusion
Bias: Sell rallies
Market State: Bearish trend + corrective consolidation
Strategy: Follow structure, wait for breakdown confirmation
Bitcoin is not reversing it is pausing before continuation.
As long as price stays below key moving averages and resistance zones, the path of least resistance remains downward.

MarketBreakdown | EURUSD, USDCAD, NZDUSD, EURCHF
Here are the updates & outlook for multiple instruments in my watch list.
1️⃣ #EURUSD daily time frame 🇪🇺🇺🇸
The pair is trading in a healthy bullish trend on a daily.
The price is steadily rising within a rising channel.
It looks like we are going to see a test of its support soon.
Probabilities will be high that another bullish movement
will start from there.
2️⃣ #USDCAD daily time frame 🇺🇸🇨🇦
The price is approaching a significant confluence zone
based on a major horizontal support and a rising trend line.
I will expect a bullish movement from there.
3️⃣ #NZDUSD daily time frame 🇳🇿🇺🇸
The market is trading in a bullish trend.
I see a falling parallel channel - a bullish flag pattern,
after a completion of the last impulse.
Your next signal to buy will be a breakout of its resistance
line and a daily candle close above it.
4️⃣ #EURCHF daily time frame 🇪🇺🇨🇭
I see 2 important bearish clues:
the price violated a solid rising trend line
and a horizontal neckline of a head and shoulders pattern.
These signals indicate a highly probable bearish reversal.
Do you agree with my market breakdown?
❤️Please, support my work with like, thank you!❤️
I am part of Trade Nation's Influencer program and receive a monthly fee for using their TradingView charts in my analysis.

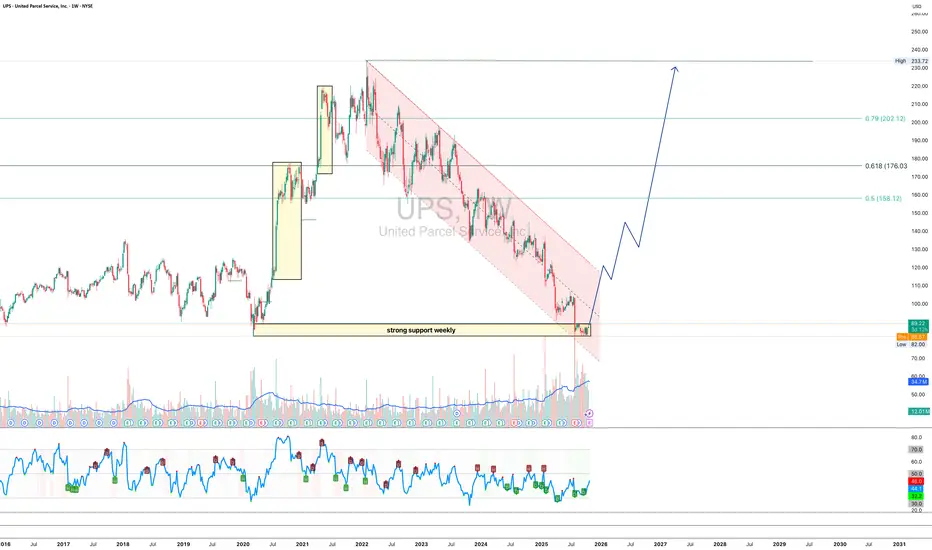
UPS 1W - delivery of a trend reversal is on the way?On the weekly chart, UPS is holding strong around the $82–90 support zone - a key level where buyers historically step in. The structure suggests the end of the long corrective channel and the potential start of a bullish reversal.
Technically, a confirmed breakout above the channel could trigger momentum toward $158, $176, and $202 - attractive targets for mid-term traders.
From a fundamental standpoint, UPS continues to streamline operations, improve automation, and prepare for peak season shipping. Growing e-commerce volumes and steady fuel costs may support stronger margins ahead. If earnings start to reflect these improvements, the stock could easily shift gears into a sustainable uptrend.
* UPS announced that it will report its Q3 results on October 28, 2025.
* The company is introducing increased seasonal charges and shipping rates starting October 26 ahead of the holiday season, which may temporarily reduce demand.
* UPS also announced plans to equip 5,000 of its trucks with air conditioning in the hottest regions of the US, a step to improve working conditions but at a cost.
* The high dividend yield (~7.5%) raises questions about sustainability, as the payout is almost equal to free cash flow.
Tactical play: as long as $82–90 holds, bulls have the initiative. Once the breakout is confirmed - the next big delivery might just be profits.
$SPY & $SPX Scenarios — Friday, Dec 19, 2025🔮 AMEX:SPY & SP:SPX Scenarios — Friday, Dec 19, 2025 🔮
🌍 Market-Moving Headlines
• Housing + sentiment check: Existing home sales and consumer sentiment close out the week, offering a read on demand resilience after a heavy CPI and labor stretch.
• Light macro, positioning matters: With no inflation or labor surprises today, flows, OPEX dynamics, and technical levels take priority.
📊 Key Data & Events (ET)
10 00 AM
• Existing Home Sales (Nov): 4.1 million
• Consumer Sentiment, Final (Dec): 53.5
⚠️ Disclaimer: For informational use only — not financial advice.
📌 #SPY #SPX #markets #housing #consumer #trading #stocks

SOL mid-term TASolana is still very bearish on mid-term trend, as well as long-term there's no change in direction. Daily time frame is strictly bearish and currently Solana is entering the bearish area again, which may pull the price deeper to the previous lows around $90ish area.

ETH mid-term TAEthereum as well as Bitcoin has stopped the distribution on daily time frame and both may have a relief X-mas rally, but it's too early to confirm yet and it's not a reversal of a downtrend either, the indicators remain in the bearish territory which may result in a short-lived rally. Be cautious of the current high risk. Technically mid-term trend remains bearish.
