EUR/USD Elliott Wave Update: Wave (iv) Correction UnfoldingThis EUR/USD chart shows the market undergoing a complex corrective phase, labelled as wave (iv), likely forming a triangle pattern (a)-(b)-(c)-(d)-(e) after an impulsive rally. The correction is taking place within a well-defined base channel, suggesting consolidation before a potential breakout into wave (v) targeting higher levels near 1.19–1.20. As long as the channel holds, the Elliott Wave structure supports a bullish continuation once the correction completes.
Keep following for regular breakdowns as the bigger trend unfolds.
Technical Analysis

Gold Price Breakout Toward 4,037 Target(XAU/USD) is forming a symmetrical triangle pattern on the 1-hour chart, suggesting potential breakout momentum. The price is currently trading near $4,014, with an upside target of $4,037 if bullish momentum continues. Key support zones are located at $3,960, $3,920, and $3,880.

NVDA Bull Flag: Breakout Toward 220–230NVDA’s 1D chart remains firmly bullish. Price cleared the ~$195 “BOS” and pushed to fresh highs above $205, with MA20 > MA60 > MA120 and widening bands supporting momentum. The near-term map is clear: Demand sits around $183 (former ceiling turned floor), while supply is forming at the new swing high near $209.50.
Primary path: I’m looking for continuation on strength. A daily close above 209.50 would confirm buyers in control and opens room toward 220–225, with a stretch scope to 230 if momentum persists. If price hesitates first, a constructive retest of 195–198 (prior breakout area) can serve as the higher-low buy zone—especially if volume firms and intraday closes reclaim $200–203 quickly.
Alternative: Failure to hold recent gains brings a deeper check. A daily close below 203.00 risks a slide toward the $200 psych handle and then $195–198. The broader bullish thesis is invalidated on a decisive daily close below 183.00, which would mark a clear break of structure and shift the bias back to neutral/bearish until reclaimed.
Triggers to watch: daily close > 209.50 for continuation; weakness below 203.00 for a corrective leg. Manage entries around 195–198 or on strength through 209.50, and keep risk tight relative to 203/183 lines. This is a study, not financial advice. Manage risk and invalidations.

COIN Bullish Continuation: Breakout Above 361 Toward 390–400COIN on the 1D chart is pressing near recent highs after breaking a multi-month range in early October and flagging through most of the month. Momentum stays constructive with price above the 20/60/120-day cluster and Bollinger Bands expanding. The prior range top has flipped to support, keeping the structure bullish.
The immediate hurdle is resistance at 355, with the recent swing high at 361.40 acting as the confirmation line. A daily close above 361.40 would validate the bull-flag continuation and opens room toward the 390–400 zone, with interim interest around 375. If momentum pauses first, a controlled pullback into 330—aligned with the breakout retest and the MA60—would be a constructive demand zone; 320 is the key higher-timeframe floor that anchors the trend.
Primary path: look for a break-and-hold above 355/361.40 to extend into 375 and then 390–400 as the next resistance band. Alternative path: if price fails to reclaim 355 and loses 330, expect a drive toward 320; a daily close below 320 would invalidate the bullish thesis and shift risk to a deeper correction.
This is a study, not financial advice. Manage risk and invalidations.

AMD Bull Flag: Breakout Above 262 Toward 286AMD on the 1D chart remains firmly bullish after its October surge, now pausing in a tight flag beneath the recent swing high at 262. Price is riding above the 20/60/120 MAs with all slopes positive, and Bollinger Bands have contracted after expanding during the rally—classic consolidation behavior. The prior ceiling at 240 has flipped to support, framing a clean structure for continuation.
Primary path: a break-and-close above 262 confirms the bull flag and opens room toward 286, where measured move projections align with the first objective. Traders wanting earlier exposure can stalk dips into the MA20 buy zone at 245–255, but confirmation still matters—strength should be reflected by a daily close reclaiming 250s and then 262. If momentum extends post-breakout, consider trimming into 285–290.
Alternative: if buyers fail to punch through 262, expect further range development between 240–262 while energy builds. The bullish thesis is invalidated on a daily close below 240, which would point to a deeper retrace toward prior October levels; risk should be sized with that line in mind.
Trigger: daily close > 262 (breakout). Targets: 286 first, then manage into 285–290. Invalidation: daily close < 240. This is a study, not financial advice. Manage risk and invalidations.

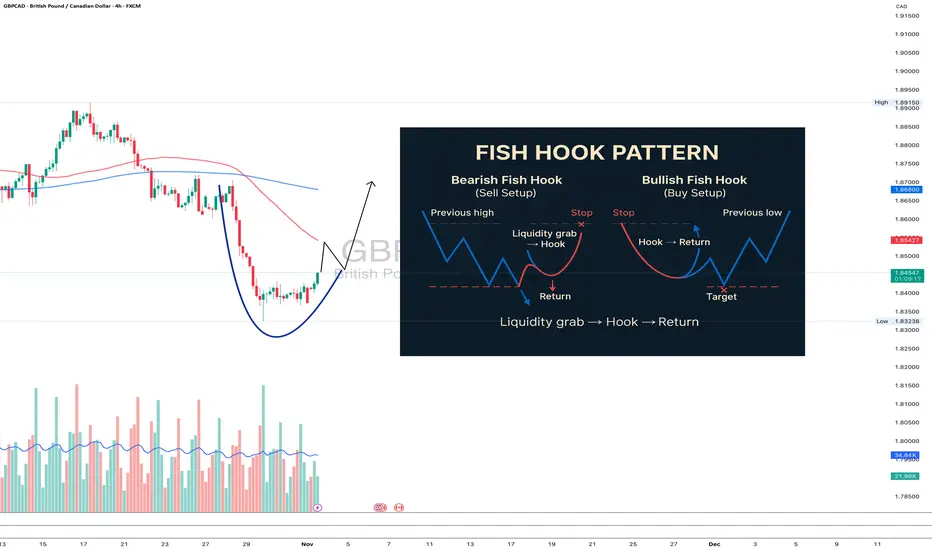
Fish Hook Pattern: the setup that catches liquidity, not tradersThere’s one pattern that never gets enough attention in textbooks, yet it’s one of the purest reflections of smart money logic - the Fish Hook.
It looks simple: price breaks out, triggers stops, traps breakout traders, and snaps back just as fast. But the psychology behind it is what makes it truly powerful.
When the market consolidates under a level, stop orders start to pile up. Big money knows that liquidity sits there - waiting to be taken. They push the price beyond the level, trigger the stops, and absorb liquidity. The breakout traders think they’ve caught momentum, but in reality, they’ve just become the exit liquidity.
Then comes the reversal - fast, decisive, emotional. That sharp return to the range is the “hook.”
If price breaks a key high or low and immediately rejects it - without structure, without a clean retest - you’re watching a Fish Hook in action.
The entry comes on the retest of that level from the opposite side. The stop goes right beyond the “hook’s tip.” Targets? The opposite edge of the range or the next liquidity pool.
The beauty of the Fish Hook lies in its simplicity. It’s not an indicator or a signal. It’s the behavior of money - watching how capital manipulates emotion.
When you start to see it often, you realize the market isn’t random. It’s intentional.
Trading becomes less about chasing candles and more about reading footprints. Fish Hook setups happen daily across pairs, stocks, and crypto and once you train your eye, you’ll never unsee them.
If your stops keep getting hit before the move - congratulations, you just met the Fish Hook from the wrong side.
Xauusd Price Bullish Continuation Toward Key Resistance Targets (XAU/USD) is showing bullish momentum above the support trend line. Price is expected to continue rising toward the targets at 4,020.081 and 4,037.929, as long as it holds above the trend line support.

Dollar Index (DXY): Confirmed BoS
Dollar Index keeps following our plan.
The market closed on Friday, breaking a previous local high
and setting a new higher high higher close with a confirmed BoS.
We can expect more growth and a highly probable test of 100.0 level soon.
❤️Please, support my work with like, thank you!❤️
I am part of Trade Nation's Influencer program and receive a monthly fee for using their TradingView charts in my analysis.

XAU/USD Daily Structure – Bullish Reversal Targeting BPR ZoneA potential bullish reversal after a recent pullback, aiming for a retest of higher price levels.
Prior Price Action: The price experienced a strong uptrend (sequence of large green candles) leading up to the mid-October high, followed by a sharp pullback (red candles) which broke below a previous low, labeled as BOS (Break of Structure). This BOS confirms a short-term bearish shift or the start of a deep correction within the larger uptrend.
Current Price Level: The price is currently near $4,008.10, having shown recent bullish momentum (the last green candle) off a recent swing low.
Key Levels and Concepts:
D/FVG (Daily Fair Value Gap): There are two Fair Value Gaps marked on the chart.
The lower D/FVG (around $4,000 - $4,060) acted as an initial target or point of interest during the decline. The price has started to move up from this area.
The upper D/FVG (around $4,170 - $4,220) represents a future potential target.
BPR (Balanced Price Range): This blue area (around $4,160 - $4,180) is an area where a previous down move's FVG overlaps with a subsequent up move's FVG (or vice versa), suggesting a zone where the market might find temporary balance or resistance/support.
Projected Path: The black arrow illustrates a bullish projection. The price is expected to continue its upward move, potentially targeting the lower D/FVG for a re-entry/retest before making its way towards the BPR and the upper D/FVG as the final target of this short-term analysis.

Gold Breakout and Potential RetraceHey Traders, in today's trading session we are monitoring XAUUSD for a selling opportunity around 4,060 zone, Gold was trading in an uptrend and successfully managed to break it out. Currently is in a correction phase in which it is approaching the retrace area at 4,060 support and resistance area.
Trade safe, Joe.

Gold compression before expansionGold remains in a controlled accumulation phase after a strong move, holding rising lows and respecting the fair value zone near 3990. As long as buyers defend the 3985–4000 range, the setup favors a false dip and re-entry scenario with continuation higher. A clean break and hold above 4040 unlocks the first target at 4110, and extension toward 4200 remains valid on structural expansion and Fibo alignment. The market is balanced on a hinge: levels are defined, buyers present, but confirmation lies only in price reclaiming the breakout zone.
Fundamentally gold still tracks macro uncertainty. Rates, inflation expectations, dollar hesitation and US debt dynamics keep capital rotating defensively. This is one of those periods where expectations and reality diverge, and the longer the compression holds, the stronger the eventual move. Still, discipline first — price must confirm above 4040.
Bias remains bullish while above 3985. Break below opens a corrective path toward 3920–3890 before another attempt higher.

EURUSD Plunges: Hawkish Fed Crushes the Euro?Hey traders, let’s take a look at EURUSD — the market is revealing an exciting opportunity for the sellers!
After the September meeting, the Fed emphasized its “data-dependent” stance, signaling it’s not ready to ease policy while the U.S. economy remains solid. This reinforces expectations that the USD will stay strong , as the Fed could keep interest rates higher for longer. As the dollar gains momentum, EURUSD faces clear downward pressure.
On the H4 chart, the price is clinging to a descending trendline that has rejected three previous attempts to break higher — each touch has been sharply sold off. Currently, EURUSD trades around 1.1560, below the 1.1600 resistance, which acts as a potential bull trap . The likely scenario: a mild pullback toward 1.1600 before continuing lower to the 1.1520 support zone. A break below that level could open the door toward 1.1450.
In summary, the overall trend for EURUSD remains bearish . With the Fed maintaining its hawkish stance, every rebound is simply a chance for sellers to enter at better prices. Stay disciplined, follow the trend — the market rewards those who have patience!

$SPY $SPX Scenarios — Week of Nov 3 → Nov 7, 2025🔮 AMEX:SPY SP:SPX Scenarios — Week of Nov 3 → Nov 7, 2025 🔮
🌍 Market-Moving Headlines
🚩 Post-FOMC digestion: After Powell’s Oct 29 presser, traders watch whether yields and the dollar cool or extend higher.
📈 Labor-week spotlight: Friday’s Jobs Report (NFP, wages, unemployment) anchors the week — rate-path odds hinge on those prints.
💬 Fed tone in focus: Multiple governors and regional presidents hit the circuit after the FOMC — every nuance matters for December guidance.
⚠️ Shutdown watch: Several BEA and Census releases (Factory Orders, Trade Balance, GDP components) may not print on time if the government remains partially shuttered.
💻 Earnings taper off: Final big-cap names and sector leaders wrap Q3 results, shaping sentiment into mid-November.
📊 Key Data and Events (ET)
Mon Nov 3
⏰ ⚠️ 8:30 AM — Durable Goods Orders (Sept) | Ex-transportation subset — BEA report; possible delay
⏰ 10:00 AM — Factory Orders (Sept) ⚠️ possible delay
Tue Nov 4
⏰ 9:00 AM — S&P Case-Shiller Home Price Index (Aug)
⏰ 10:00 AM — Consumer Confidence (Oct) 🚩
Wed Nov 5
⏰ ⚠️ 8:30 AM — Advanced Trade Balance in Goods (Sept) | Retail and Wholesale Inventories — Census; may be delayed
⏰ 10:00 AM — Pending Home Sales (Sept)
⏰ 🚩 2:00 PM — FOMC Rate Decision
⏰ 🚩 2:30 PM — Fed Chair Powell Press Conference
Thu Nov 6
⏰ 🚩 8:30 AM — Initial Jobless Claims (Oct 25) expected on schedule
⏰ 🚩 8:30 AM — GDP (Q3, Advance) ⚠️ BEA data; delay possible
⏰ 9:55 AM — Fed Vice Chair Michelle Bowman speaks
Fri Nov 7
⏰ 🚩 8:30 AM — PCE and Core PCE (Sept) along with Personal Income, Spending, and Employment Cost Index ⚠️ BEA risk
⏰ 9:45 AM — Chicago PMI (Oct)
⏰ 12:00 PM — Cleveland Fed President Hammack and Atlanta Fed President Bostic remarks
⚠️ Note:
Shutdown risk applies to BEA and Census releases marked with ⚠️
Confirmed live data include Jobless Claims, FOMC decisions, and Fed speeches — these will drive most of the week’s price action.
Friday’s PCE print (if released) remains the key inflation gauge.
⚠️ Disclaimer: Educational and informational only — not financial advice.
📌 #trading #stockmarket #SPY #SPX #Fed #Powell #FOMC #PCE #GDP #JoblessClaims #inflation #bonds #yields #economy #macro

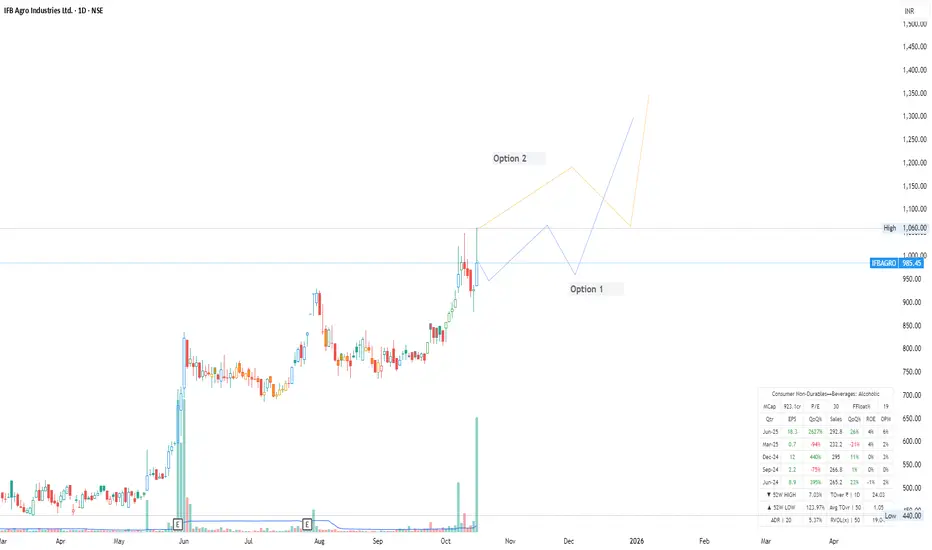
IFB Agro - Go LongIFB Agro has given a good Break Out, Expecting slight consolidation and then re initiate the momentum. There is also a possibility of exponential moving from the high of today also.
NZDUSD Faces Pressure as Hawkish Fed Supports Dollar Strength!!!Hey Traders, in tomorrow’s trading session we are monitoring NZDUSD for a selling opportunity around the 0.57450 zone. The pair is trading within a broader downtrend and is currently in a correction phase, approaching the trendline and resistance area at 0.57450.
From a fundamental perspective, the Federal Reserve’s recent hawkish remarks—hinting that rate cuts in December are unlikely—have provided renewed support for the U.S. Dollar, adding downside pressure to risk-linked currencies like the NZD.
If the pair rejects the 0.57450 zone with strong bearish momentum, further continuation toward recent lows could be expected.
Trade safe,
Joe

BTCUSD — TP1 Hit | Structure Validation Bitcoin tagged its first target at 111,066, wrapping up another disciplined weekend for structured traders.The move is still unfolding, completing the measured leg mapped last week.
Price action remains just behind Thursday’s range as the market quietly fills the week’s single-prints near 111,629.
Technical View
BTC continues to trade inside its mid-range structure.
The current rotation follows a clean, measured rhythm — confirming that prior resistance has been absorbed.
Next focal zone: 111,900, where untested liquidity remains.
A sustained break above that region would signal continuation; a rejection keeps us boxed in for another session.
Macro Overview
Dollar Index (DXY): Holding near 106, giving mild support to risk assets.
Rates: U.S. 10-year yields steady around 4.25 %, showing markets in “wait mode.”
Seasonality: Early November typically brings moderate inflows after October volatility. Expect slower rotations until U.S. sessions return to full volume.
Volume / Flow
Weekend turnover reached roughly $23 billion across BTC pairs — moderate and balanced.
Order flow stayed clean, with no signs of forced liquidation or excess speculation.
Plan
Keep it simple:
111.9 k = magnet zone.
We’re still in range logic — control, not chase.
Note
The system did what it’s designed to do: read rhythm, not emotion.
Institutional Logic. Modern Technology. Real Freedom.

EURUSD: Support & Resistance Analysis For Next Week 🇪🇺🇺🇸
Here is my latest structure analysis and
important supports & resistances for EURUSD for next week.
Consider these structures for pullback/breakout trading.
❤️Please, support my work with like, thank you!❤️
I am part of Trade Nation's Influencer program and receive a monthly fee for using their TradingView charts in my analysis.

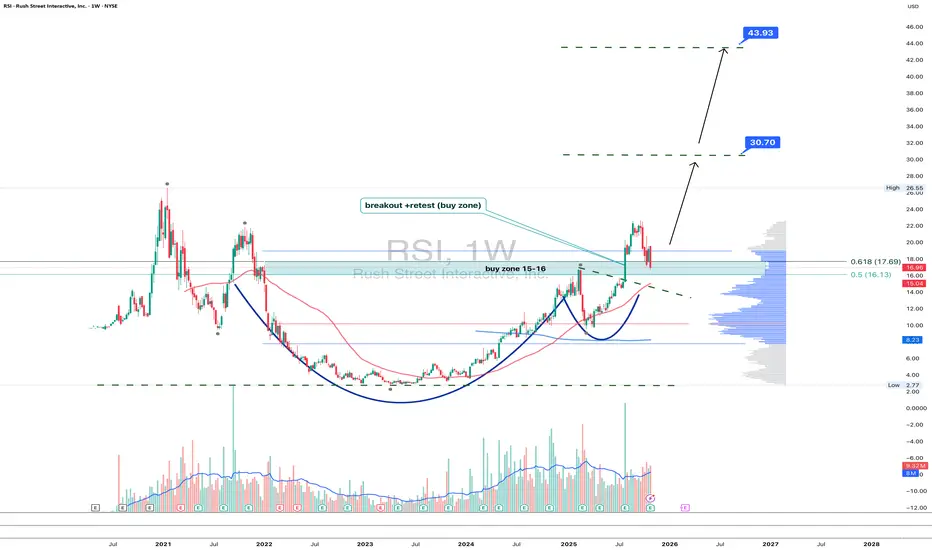
RSI 1W - gambling or smart retest?Rush Street Interactive (RSI) just confirmed a breakout above the 15–16 zone with a textbook retest - a classic bullish setup. The weekly chart shows a clean “cup and handle” structure backed by rising volume. Current pullback is forming right inside the buy zone, suggesting potential continuation.
Fibonacci extensions highlight 30.7 and 43.9 as key upside targets. As long as price holds above 15.5–16.0, the bullish bias stays intact. A breakout above 18.0 would confirm the next leg higher.
Fundamentally , RSI benefits from ongoing online gambling legalization across the US and improving profitability in core states, which could attract institutional inflows.
In the gambling world, luck rarely repeats - but this chart looks like the house might finally lose.
Weekly Market Outlook: Nifty, BankNifty & S&P 500Nifty (25722) slipped ~70 pts this week, staying exactly within my projected range of 26250–25350. The weekly candle formed a shooting star, signalling selling pressure from higher levels.
A close below 25711 can extend downside toward 25450–25300.
On the upside, only a close above 25860 can open a move toward 26100–26150.
BankNifty held firm above 57600, but a dip below 57450 could pull it to 57000–56750.
A breakout above 57900 with volume can take it toward 58469–58577 (ATH) — this will be key to any Nifty recovery.
S&P 500 closed at an all-time high of 6840, just shy of the crucial Fib level 6959. Sustaining above 6800 can push it to 6920–7009, while a drop below 6780 may trigger a pullback toward 6689/6568.
Historically, November brings a healthy 4–7% correction after strong October rallies. So a dip toward Nifty 25150–25200 wouldn’t be surprising — it may just set up the next leg higher.
🔹 Nifty Range: 26150–25250
🔹 BankNifty Key Zone: 57450–57900
🔹 Global Cue: S&P 500 near Fib resistance 6959

Emotional Discipline and Risk Control in Trading🧠 1. Why Emotional Discipline Matters
Emotional discipline means sticking to your plan regardless of fear or greed.
Markets are designed to test your patience, confidence, and decision-making. Every losing trade tempts you to change your system — but consistency wins.
✅ Key habits of emotionally disciplined traders:
They accept losses without revenge trading.
They follow rules, not impulses.
They manage expectations — no trade will make them rich overnight.
💰 2. Risk Control — Protect Before You Profit
Your risk management defines your survival. Successful traders think in probabilities, not certainties. They never risk too much on one idea.
📏 Golden Rules of Risk Control:
Risk 1–2% of your capital per trade.
Always use a stop-loss, never a “mental” one.
Define your R:R ratio (minimum 1:2 or better).
Never add to a losing position — only to confirmed winners.
Risk control is not about avoiding losses — it’s about limiting damage and staying consistent over time.
🧩 3. How to Strengthen Emotional Discipline
Like a muscle, discipline grows with routine. Try this daily:
Pre-trade routine – review your plan before every session.
Post-trade journal – log your emotions, not just results.
Take breaks – emotional fatigue leads to poor judgment.
Detach from outcomes – focus on process, not profit.
💡 Tip: When you reduce emotional pressure, your clarity and accuracy both improve.
⚙️ 4. Professional Mindset Shift
Amateurs chase profit; professionals protect capital.
Each trade is just one data point — not a reflection of your worth. Once you start thinking like a risk manager first, your results change naturally.
🗣️ “Discipline is choosing what you want most over what you want now.”
📊 Conclusion
To grow as a trader, focus on controlling yourself before controlling the market.
Emotional stability + strict risk control = long-term success.
Be the trader who executes with logic, not emotion. 🧘♂️

ETH/USD Short Setup: Bearish Reversal Toward $3,830 TargetA short (sell) trade setup for Ethereum (ETH/USD).
The entry zone is around $3,870–$3,880.
The stop loss is set at $3,909.71, protecting against upside breakouts.
The target is $3,830.85, suggesting a downside move of about $40.
The price action and drawn arrow indicate expectations of a bearish move after a small consolidation

ASPN - cup, handle, and maybe the moonAspen Aerogels (ASPN) shows a textbook “cup and handle” pattern on the daily chart. The stock broke above the MA50 and MA200, forming a golden cross - a clear signal of trend reversal. The buy zone sits around 7.4–7.8 , where price has twice found support. Holding above 8.0 keeps the door open toward 11.3, 13.7, and possibly 16.0 - key supply levels from previous distribution.
On the fundamental side , ASPN benefits from strong interest in energy-efficient materials and aerogels used in green construction and EV insulation. With US policy support for clean tech, the company may catch a new growth wave.
Tactically , as long as price stays above 7.8 , the setup remains bullish. Break above 9.0 confirms further upside, while a drop below 7.0 cancels the pattern.
Every cup looks perfect until someone shakes the table - let’s see if this one stays steady.

NZDUSD: Bearish Trend Continues! 🇺🇸🇳🇿
NZDUSD will most likely continue falling next week,
following a confirmed breakout of a support line of a bearish flag pattern
on a daily time frame.
I will expect a bearish continuation at least to 0.5685 level.
❤️Please, support my work with like, thank you!❤️
I am part of Trade Nation's Influencer program and receive a monthly fee for using their TradingView charts in my analysis.
