Market Panic: Gold or Crypto?When the market enters a state of panic, the question is no longer “How much profit can I make?” but rather “Which asset helps me survive and protect my capital?”
In moments like these, gold and crypto are often placed side by side. Both are seen as safe havens—but in very different ways, and that difference is the key to making the right decision.
1) Gold – Where Capital Flows When Confidence Breaks
Gold has existed for thousands of years with one core purpose: preserving value.
When inflation rises, geopolitical tensions escalate, or the financial system shows signs of stress, large capital tends to move into gold first.
Why gold performs well during crises:
High global liquidity, accepted across all markets
Relatively “orderly” volatility, suitable for defensive positioning
Often benefits when real interest rates fall and the USD weakens
In other words, gold won’t make you rich overnight, but it helps you avoid being washed away when the storm hits.
2) Crypto – An Asset Driven by Expectations and Emotion
Crypto represents a new generation of assets, where value is heavily influenced by future expectations, technology narratives, and speculative capital.
In normal or euphoric market conditions, crypto can rise very quickly.
But when panic sets in, the story changes.
Here’s the reality we need to face:
Crypto reacts extremely sensitively to “risk-off” sentiment
High leverage + thin liquidity during stress periods can trigger chain liquidations
In major shocks, crypto is often sold alongside growth stocks, rather than acting as a true safe haven
Therefore, crypto is not a defensive asset in the traditional sense—it is an asset of belief and market cycles.
3) When Should You Choose Gold? When Should You Hold Crypto?
The answer is not “which is better,” but what the market context is.
True panic (systemic risk, war, financial crisis):
➡ Gold is usually the preferred choice.
Capital seeks certainty, not stories.
Short-term crisis followed by monetary easing:
➡ Gold often leads the first wave,
➡ Crypto tends to recover more aggressively after a psychological bottom forms.
Stable markets with abundant liquidity:
➡ Crypto performs at its best.
4) My Perspective: Don’t Choose with Emotion
From my experience, the biggest mistake traders make during panic is choosing assets based on personal belief instead of capital flow and market behavior.
A professional trader asks:
Where is large capital taking refuge?
Is current volatility suitable for my trading style?
Is my goal capital preservation or outsized returns?
If your priority is safety and stability, gold is usually the more reasonable choice.
If you accept high risk in pursuit of high reward, crypto should only be approached after clear confirmation, not during extreme panic.
Technical Analysis

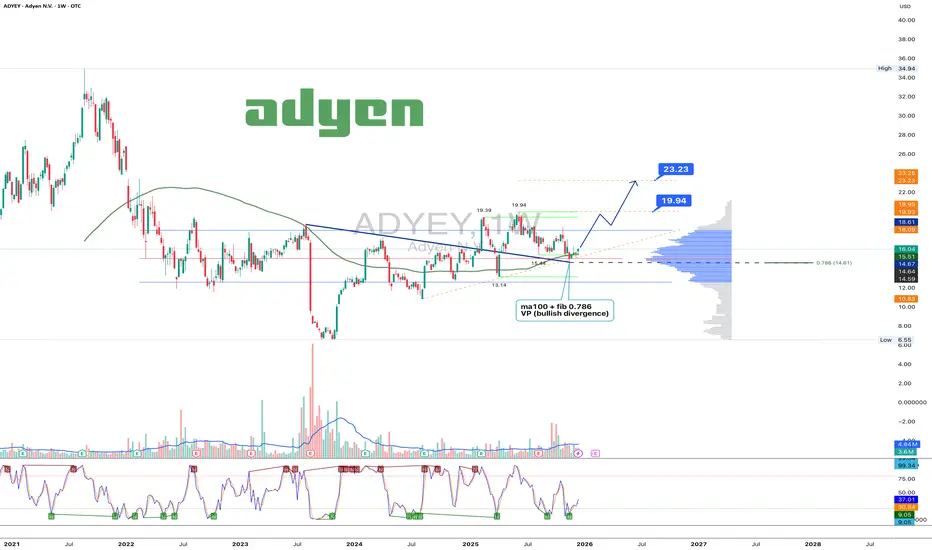
Adyen 1W: The trend broke twice, the market is just catching upOn the weekly chart, Adyen has broken the long term downtrend twice, and price is now performing a controlled pullback retest. The current consolidation holds above the $15.5–16.0 demand zone, where MA100, 0.786 Fibonacci and strong volume profile support align. Selling pressure is fading, volumes on the pullback are declining, and bullish divergence remains intact. This structure favors confirmation of the breakout rather than a return to a bearish trend. As long as price stays above this zone, upside remains the priority. First target stands at $19.94, followed by $23.23.
Fundamentally, Adyen continues to deliver consistent growth. H1 2025 revenue reached $1.28B, up from $1.13B in H2 2024. H2 2025 revenue is projected at $1.49B, with forecasts extending toward $1.53–1.88B in 2026–2027. EPS came in at $0.18 for H1 2025, with $0.21 expected in H2, rising toward $0.25–0.26 by 2027. Analyst sentiment leans bullish as digital payment volumes continue to expand globally.
When a trend breaks twice, patience usually gets paid.
ETH Is Free — But Not Trending YetETH/USD – 1H
Price has broken the descending trendline, signaling selling pressure is weakening.
However, this is a technical rebound, not a confirmed uptrend.
Key Levels
Support: 2,760–2,800 (strong buyer reaction)
Current zone: 2,940–2,960 (decision area)
Resistance: 3,150–3,160 (major supply)
Outlook
Base case: range / shallow pullback, then a retest toward 3,050–3,160.
Bullish continuation only if price closes and holds above 3,160.
Bottom Line
Momentum has improved, but the real move comes after resistance breaks.
Patience beats prediction here.

Bitcoin Is Trapped in a High-Liquidity RangeMarket Structure (H1)
Bitcoin is currently locked inside a clearly defined range, capped by a heavy resistance zone around 90,500 and supported by a well-defended demand area near 85,200. Price action inside this box is choppy and overlapping, with repeated sweeps of both highs and lows — a classic liquidity-building environment rather than a trending phase.
The sharp sell-off from the left side of the chart established a lower structural regime, after which BTC transitioned into sideways rotation. Each bounce toward resistance fails to achieve acceptance, while each dip into support is aggressively defended. This confirms balance, not strength or weakness.
Liquidity & Price Behavior
The green projected swings highlight how price is likely to continue oscillating between resistance and support, hunting liquidity on both sides. This behavior typically precedes a range expansion, but until a clean breakout occurs, moves inside the range remain low-probability and noise-driven.
Macro & U.S. Policy Context
From a macro perspective, Bitcoin remains constrained by unfavorable U.S. conditions:
The Federal Reserve maintains a restrictive policy stance, keeping real yields elevated.
A relatively strong USD continues to pressure risk assets.
Liquidity conditions remain tight, reducing follow-through on upside attempts.
These factors explain why BTC struggles to accept above resistance despite multiple tests — macro headwinds are capping momentum.
Conclusion
Bitcoin is not trending it is accumulating liquidity.
Above 90,500 with acceptance → upside expansion becomes likely.
Failure at resistance → continued rotation and potential downside sweep toward support.
Until price leaves the range with intent, patience is the edge.

This Is a Distribution Trap Below ResistanceBITCOIN (BTCUSD) — H1 MARKET ANALYSIS
1. Market Structure
BTC is still trading within a short-term bearish structure. Despite the recent bounce from the support zone, the market continues to form lower highs under a well-defined resistance band. The recovery leg is corrective, not impulsive a key sign that sellers remain in control.
Price behavior shows:
Strong sell-off → weak rebound
No higher high formed
Structure remains capped below resistance
2. Key Technical Zones
Resistance Zone: 88,800 – 89,600
This is a major supply area aligned with previous breakdown structure and EMA resistance.
Support Zone: 84,800 – 85,400
A critical liquidity pool where buyers previously defended, but still vulnerable to another sweep.
3. Moving Averages & Momentum
EMA 34 (blue): Acting as dynamic resistance during the rebound.
EMA 89 (red): Still trending downward and clearly above price → confirms bearish market bias.
Momentum lacks follow-through; bullish candles are short-lived and overlap heavily.
4. Market Psychology & Liquidity
The current consolidation is distribution, not accumulation:
- Buyers are chasing rebounds after a sharp drop.
- Smart money is selling into strength below resistance.
- The market is building liquidity for a second downside expansion.
This sideways-up movement is designed to:
- Trap late buyers
- Create exit liquidity for sellers
- Prepare for continuation lower
5. Scenario Outlook
🔽 Primary Scenario (High Probability): Bearish Continuation
Price fails at resistance
Sideways consolidation completes
Breakdown toward:
- First target: 85,800
- Main target: 84,500
- Extension: 83,800 – 84,000
🔼 Invalidation Scenario
Only if BTC breaks and holds above 89,600 with strong volume, the bearish structure is invalidated and a deeper recovery becomes possible.
6. Trading Bias
Main Bias: Bearish
Market Phase: Distribution → Liquidity Setup
Strategy: Sell rallies near resistance, avoid long positions inside corrective moves.
Conclusion
BTC is not showing strength it is recycling liquidity below resistance. Until the resistance zone is decisively broken, the path of least resistance remains to the downside. Patience is key; the real move comes after distribution is complete.

ETH Just Defended the FloorETHUSD (H1) — MARKET ANALYSIS
1. Market Structure
Ethereum has successfully defended the key support zone around 2,900 – 2,920, forming a strong rejection candle after the recent sell-off. This confirms that the prior drop was a liquidity sweep, not a trend reversal. The structure now shows a higher low, signaling a short-term bullish shift.
2. Key Zones
Support Zone: 2,900 – 2,920
This level has been tested and defended decisively, indicating active demand.
Target 1: ~3,060
First upside objective aligned with previous intraday resistance.
Target 2: ~3,160
Higher liquidity target and next major resistance zone.
3. Price Action & Momentum
Strong impulsive bullish candle from support → clear sign of buyer aggression.
Pullback structure remains shallow, showing no strong selling pressure.
Price acceptance above support suggests continuation rather than retracement.
4. Market Psychology
This move reflects smart money re-entry after forcing weak hands out below support. Late sellers are now trapped, and any consolidation above the support zone increases the probability of a trend continuation push upward.
5. Scenario Outlook
🔼 Primary Scenario (High Probability):
Hold above 2,900 – 2,920
Minor consolidation / pullback
Expansion toward:
TP1: 3,060
TP2: 3,160
🔽 Invalidation Scenario:
Strong breakdown and close below 2,880
→ would open room for a deeper correction.
Conclusion
ETH is showing clean bullish re-accumulation behavior after a liquidity grab. As long as price holds above the support zone, the path of least resistance remains to the upside, with buyers firmly back in control.

Two Forces Cancel Each Other Out, EURUSD Tilts BearishAlthough the USD is weakening due to expectations that the Fed will continue its monetary easing , EURUSD has failed to break higher as the euro’s internal strength shows clear signs of weakness . With these two fundamental forces offsetting each other , the market is gradually leaning toward a short-term corrective decline.
On the fundamental side, disappointing Eurozone PMI data highlights a sharper-than-expected slowdown in economic growth , particularly in manufacturing and services. This has weighed on the euro, preventing EURUSD from capitalizing on USD weakness and increasing the likelihood of a pullback as buying momentum fades.
From a technical perspective, price is currently pulling back to retest the rising trendline and the Ichimoku cloud, signaling that selling pressure is building. The preferred technical scenario is a pullback toward the 1.1700 area, where dynamic support and structural support converge.
At this stage, it is more appropriate to observe price reaction at key support levels rather than expect a strong upside move. The market is testing patience—and it is often during these corrective phases that the clearest opportunities begin to emerge.

USDJPY Still Hot – 157.00 Is CallingHello traders,
USDJPY is currently showing a short-term bullish bias , as the narrative of a weak JPY despite the BOJ’s rate hike has not yet shifted overall market sentiment. Although the BOJ raised rates to 0.75%, the yen remains soft, indicating that much of the move was already priced in, and markets are still skeptical about the pace of further tightening.
At the same time, the USD continues to hold relative strength across the currency basket, providing a solid foundation for USDJPY to stay supported.
From a technical perspective, price action reflects a “slow but steady” uptrend : higher lows are being formed, and the 155.50 area is acting as a key support and pivot zone . The consolidation around 155.5–156.0 suggests accumulation, and as long as this base holds, the probability favors a move higher to retest the upper resistance.
The preferred scenario is to look for BUY opportunities on pullbacks : if price holds above 155.50 and shows a rebound, the near-term target is 157.00. Only a clear H4 close below 155.50 would weaken the short-term bullish outlook and warrant a reassessment.
Thank you for listening, and wishing you successful trading ahead.

EURUSD Finds Its Rhythm: Buyers Remain in ControlIn the current trading phase, EURUSD is presenting a clean and easy-to-read bullish structure , especially when viewed against a news backdrop that has recently tilted slightly in favor of the euro . Following the ECB’s more stable and optimistic tone , the market has shown less appetite for aggressive USD buying, creating room for EUR to maintain its short-term advantage .
Looking at the chart, the price structure remains clearly constructive : the uptrend is intact with higher highs and higher lows. Recent pullbacks appear to be nothing more than a healthy pause, as price continues to find solid support around the 1.1700 zone — a well-defined technical level where buying interest repeatedly steps in. This behavior confirms that buyers are still in control, rather than stepping aside.
Under a favorable scenario, EURUSD has room to extend higher and test the 1.1800 area , which stands as the nearest resistance and a logical upside target for the current move. As long as price holds above 1.1700, the bullish bias remains dominant, and any pullback should be viewed as opportunity rather than risk.
In summary, EURUSD is advancing in an orderly bullish manner — not rushing into a breakout, yet showing no signs of meaningful weakness . If market sentiment remains steady, the upside path stays open for traders willing to stay patient and follow the trend.

Ethereum Isn’t Weak — It’s Being AbsorbedETH/USD – H1 Technical Breakdown
Ethereum is currently trading inside a well-defined sideways range, bounded by a firm support zone near the lower box and a clearly defended resistance band above. This is not random consolidation it is structured balance, where liquidity is being built rather than released.
On the price action side, ETH has repeatedly swept liquidity near the support zone and responded with sharp rebounds, indicating aggressive absorption by buyers. Each sell-off into the lower boundary has failed to extend, suggesting that downside momentum is being capped. Meanwhile, upside attempts are still capped by the resistance zone, keeping price compressed inside the range.
From a trend and moving average perspective, price is now attempting to reclaim the short-term EMA, while the longer EMA still acts as a dynamic ceiling. This creates a classic compression environment: volatility contracts, fake moves appear, and impatient traders are forced out.
Market Logic Going Forward
- As long as ETH holds above the support zone, downside remains corrective, not trend-defining.
- A clean acceptance above the resistance zone would signal range resolution, opening room for expansion toward the upper targets.
- Until that happens, ETH is in a positioning phase, not a trending phase — chasing candles inside the box remains low probability.
Key Takeaway
This is not a market choosing direction yet. It is a market testing commitment. The real move begins when price leaves the range with acceptance, not when it reacts inside it.

NQ (Nasdaq 100 Futures) - Technical Short SetupMarket Context & Thesis
Price action on the NQ is approaching a significant technical confluence, suggesting a potential reversal zone favorable for short positioning. The setup is defined by two key Fibonacci retracement levels aligning closely, indicating strengthened resistance.
Technical Rationale
Primary Resistance Confluence: Price is nearing the convergence of two distinct .382 Fibonacci retracement levels.
A longer-term .382 retracement measured from the late-October high to the November low.
A more recent .382 retracement from the December 10th high.
Volume Analysis: The rally to the longer-term .382 level in November was accompanied by strong volume (~11M), potentially representing a prior distribution zone. The subsequent advance to the current zone has occurred on notably lower volume (~3M), indicating weakening bullish momentum and lack of broad participation, which supports the reversal premise.
Conclusion
The confluence of dual Fibonacci resistance, corroborated by divergent volume profiles, presents a high-probability short entry opportunity. The trade structure offers a disciplined, quantified approach with a positive expected value based on 3:1 risk-reward framework.

Fast Bounce Setup | Price: 63.33 → Target: 66.49 (+5%)Fundamentals 📊
HALO continues to show strong revenue and profit forecasts, with steady growth expectations.
The fundamental outlook remains supportive for short-term upside.
Repeated Behavior 🔍
This stock has a repeated pattern of delivering at least a 5% bounce from similar oversold or congested zones.
The current structure matches previous cycles.
Price Action 📉➡️📈
Price action at this level is reacting to a resistance zone, which historically leads to a quick 5% reaction move before continuation or pullback.

NZDUSD Update: Kiwi Is Looking For More Upside After CorrectionWe talked about the Kiwi(NZDUSD) back in October, where we mentioned and highlighted a bottom formation within an ending diagonal / wedge pattern for wave C of an ABC corrective decline.
As you can see today, Kiwi is nicely bouncing and recovering after RBNZ cut interest rates in November, and forecasts suggest the broader committee believes the nadir has been hit for the easing cycle. So the Kiwi is coming up as no room for cuts, for now. Notice it can be now bottom after the wedge pattern into wave C, due to an impulsive recovery, which we see it as a wave 1 of a new five-wave bullish cycle. So seems like more upside is coming within wave 3 of a five-wave bullish cycle, but ideally after the current corrective setback in wave 2 with supports at 0.5750 – 0.5700.
The reason Kiwi could see more upside into late 2025 and early 2026 is due to a bullish stock market, which still has room for gains. S&P 500 and NZD/USD (Kiwi) have been in a tight positive correlation since the November lows. Therefore, if the S&P 500 is set to resume its bullish trend, the Kiwi could easily follow.

XRP – Daily OutlookXRP Army,
Price is still trading inside a descending channel, keeping the short-term structure bearish.
We recently saw a reaction from daily support, but this move alone is not enough to confirm a reversal.
In the past, this support level has shown clean deviations, where price dipped below and quickly reclaimed the level.
A similar scenario could play out again, but confirmation is required.
Key observation:
For any bullish continuation, XRP needs to reclaim the broken support level and hold above it.
Without a reclaim, this move remains a relief bounce within a downtrend.
I’ll be watching lower timeframes for a potential deviation and reclaim before considering longs.
Until then, caution is warranted.
Levels to watch:
Resistance: reclaimed support + upper channel
Support: current daily support zone
MrC

AUDUSD Potential UpsidesHey Traders, in today's trading session we are monitoring AUDUSD for a buying opportunity around 0.65700 zone, AUDUSD is trading in an uptrend and currently is in a correction phase in which it is approaching the trend at 0.65700 support and resistance area.
Trade safe, Joe.

JTO – Weekly OutlookPrice broke below the previous support and confirmed an S/R flip, turning that level into resistance.
Last wick from October 6th is now fully filled, which means that inefficiency has been resolved.
We are currently trading below key weekly support, and price is consolidating at lows.
At this point, there is no clear confirmation of a reversal yet.
Key observation:
If price creates a deviation below current support, I’ll be watching for long opportunities on lower timeframes, targeting a move back into the range.
If not, this level may act as acceptance and continuation to the downside.
Patience is key here — let the market show its hand.
Levels to watch:
Resistance: previous weekly support (now S/R flip)
Support: current lows after wick fill
What do you think — deviation reclaim incoming or further downside first?

Avanti Feeds Ltd – Breakout Watch
📌 Buy Zone: ₹856
🎯 Target: ₹935
🛑 Stoploss: ₹812
Price action is testing a descending trendline on the daily chart. Volume spike and RSI momentum suggest a potential breakout. Risk-managed entry near ₹856 could offer a favorable reward-to-risk setup.
🔍 Disclaimer: For educational purposes only. Not SEBI registered. Do your own research before investing.

DAX Rebound Signals Potential Upside After Key Support HoldGerman DAX was very non-directional, basically since June of 2025 and what I see is some very nasty moves on both sides of the market, but what got our attention recently is that the price has stopped at key support levels around 23k to 23300 area, from where we can see a very interesting and strong rebound. What is most important is that this rebound is coming after only three waves down from all-time highs, so it can be part of a WXY complex correction here in a fourth wave on a daily chart. Of course there can be some other labelings as well, but with any approach you will probably come out with the same idea that this whole price action in this five to six month range is corrective, and whenever we see a correction we know that sooner or later it should be fully retraced, meaning the price could already be headed back toward the highs from current levels.
Bounce looks impulsive, and it may have formed a bullish setup formation with waves 1 and 2, so we think that more gains are coming within wave 3, especially if breaks back above 24500 bullish confirmation level.

This Pullback Is Not a Sell SignalEUR/USD is still bullish inside a clear ascending channel. Price is consolidating near the upper half of the structure this is pause, not reversal.
Key Points
Structure: Higher highs & higher lows remain intact
Support: EMA 34 & EMA 89 + channel support holding
Current move = supply absorption, not distribution
Scenarios
Main: Hold above channel → continuation toward 1.176 → 1.180 → 1.184
Risk: Only a clean break below channel invalidates the bullish setup
Bias: Buy pullbacks, don’t chase
Strong trends pause before they move again.

EURUSD Lost Momentum — And the Pullback Is Not Finished YetHello Guys
EURUSD on H1 has shifted from impulsive upside into a clear corrective phase after failing to hold above the prior structure high. The sharp rejection from the top was followed by strong bearish candles that broke back below the key intraday support around 1.1710, signaling that buyers have stepped aside and short-term control has rotated to sellers. Current price action shows weak rebounds and lower highs, consistent with a corrective unwind rather than consolidation for continuation.
Structurally, price is now retesting broken support from below, which is acting as resistance. As long as EURUSD remains capped under the 1.1710–1.1720 zone, the path of least resistance stays to the downside. The projected sequence favors a brief corrective bounce, followed by continuation lower toward the next demand zone around 1.1680–1.1690, where stronger buying interest may reappear.
From a macro perspective, this technical pullback aligns with a short-term USD bid driven by cautious risk sentiment and relative strength in U.S. data. With the Fed maintaining a restrictive stance longer than the ECB and rate differentials still favoring the dollar, EUR upside lacks strong macro support in the near term. This environment reinforces the idea that EURUSD rallies are corrective unless macro conditions shift meaningfully.
In summary, EURUSD is in a short-term corrective decline. Below reclaimed resistance, downside continuation toward lower support remains favored. This is not a trend-reversal setup yet, but a momentum reset — patience is required until price reaches demand or macro conditions change enough to justify renewed euro strength.

TRX / USDT PERP – 4H Trade IdeaTRX is currently trading below a bearish order block, after a clear market structure break (MSB) to the downside.
🔴 Short bias
Rejection from bearish OB
MSB confirmed
No bullish displacement yet
Short idea
Entry: rejection at current OB zone
Invalidation: clean 4H close above the OB high
Targets:
This setup only remains valid as long as price stays below the OB.
What’s your bias here?
MrC

XRP mid-term TAXRP army is having difficult times, Ripple is far from falling, in fact it's turning more and more bearish including the long-term trend. Current pivot support area is around $1.25 exactly the same area during the last flash drop.

USDJPY Bullish Structure Approaches High-Risk Supply AreaUSDJPY (30-Minute) – Bullish Continuation Into a Critical Reversal Zone
This USDJPY 30-minute chart clearly shows strong bullish momentum after a clean breakout from a symmetrical consolidation structure. Price action respects structure, volume behavior, and key zones, making this setup ideal for short-term and intraday traders who wait for confirmation rather than chasing price.
Market Structure & Price Action
USDJPY was previously trading inside a tight consolidation / wedge-like structure, showing indecision and compression. This phase acted like a spring — storing energy before the move. Once price broke above the upper trendline, buyers stepped in aggressively, confirming a valid bullish breakout.
After the breakout, price formed higher highs and higher lows, which confirms that the market is now in a short-term bullish trend. The impulsive candles following the breakout show strong buyer conviction, not a weak or false move.
Breakout Confirmation & Momentum
The breakout was not random. It occurred after multiple rejections inside the structure, indicating that sellers were getting weaker. Once resistance was broken, price did not immediately pull back deeply — a classic sign of trend strength.
Momentum remains bullish as long as price holds above the breakout level. However, price is now approaching a pre-marked supply / reversal zone, which increases the probability of a reaction.
Key Resistance & Reversal Zone
The highlighted green area represents a high-probability reversal zone, where:
Previous selling pressure exists
Liquidity is likely resting above highs
Smart money may look to take profits
The chart specifically highlights a “Volume Burst” zone, meaning if price enters this area with increasing volume, it could signal either:
A final push (liquidity grab), or
Exhaustion leading to a reversal
At this level, blind buying is risky. The note “Pattern Needed” is very important — traders should wait for clear confirmation before taking any position.
Trading Scenarios to Watch
Bullish Scenario:
If price breaks and closes above the reversal zone with strong volume and structure continuation, it would indicate buyers are still in control, opening the door for further upside continuation.
Bearish / Pullback Scenario:
If price forms a rejection pattern (such as a bearish engulfing candle, long upper wick, or lower high) inside this zone, it may signal a short-term correction or deeper pullback, targeting previous breakout levels.
Trading Psychology & Execution
This chart is a perfect example of why patience matters. The move is already extended, and chasing price here carries poor risk-to-reward. The smart approach is:
Let price come into the zone
Watch how it reacts
Enter only after confirmation
This is how professional traders protect capital and trade probabilities, not emotions.
Summary
USDJPY remains bullish overall, but price is now testing a critical decision-making area. The next move will depend on price behavior and volume reaction inside the reversal zone. Stay disciplined, wait for confirmation, and let the market show its hand before committing to a trade.
