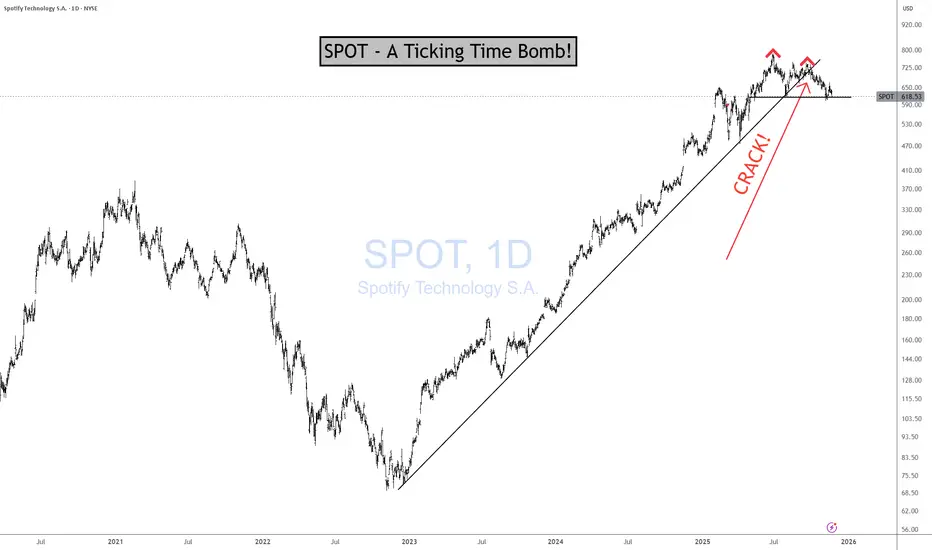
SPOT - A Ticking Time Bomb!SPOT Earnings Yield of 1.3% according to current data — meaning you’re getting about 1.3 cents of profit per dollar invested. LOL!
Better you give me your hard-earned money and I'll give you 2% instead of 1.3%. I like to splurge! :)
The Structural Constraint
Spotify cannot scale margins the way Netflix did because:
They don’t own the content
They don’t control input costs
They have to pay out ~70% of every dollar to rights holders
Their pricing power is weak and regulated by deals with labels
The labels decide what happens to Spotify’s margins, not Spotify
This is the definition of a business with a hard economic ceiling.
No amount of subscribers fixes the cost structure.
Spotify’s long-run net margin:
1–2% (When they “beat,” the gains evaporate the next quarter.) If Spotify hit 5% margins — a level they’ve never sustained.
And on a positive note —
THANK YOU for helping me hit 5,000 followers! 🙏🔥
Let’s keep going.
If you find value in the work:
👉 Boost
👉 Follow
👉 Leave a comment
Let’s push to 6,000 and keep building a community rooted in facts, not fairy tales.
Technical Analysis
AUD/USD Reclaims 0.70 on RBA Hike: Undervalued Carry Play?Title: 🚀 AUD/USD Reclaims 0.70 on RBA Hike: Undervalued Carry Play or USD Rebound Risk? 2026 Dive!
Hello TradingView community! 👋
Today, let's dive into AUDUSD with a detailed analysis focusing on fundamentals, SWOT, and technicals. 📊 This isn't financial advice just an in-depth look based on public data.
Current Snapshot:
Price: 0.7000 💵
52-Week High/Low: 0.7094 / 0.6600 📈📉
Market Cap: N/A (forex pair)
Fundamental Analysis (e.g., Intrinsic Value and Ratios):
For forex pairs like AUDUSD, adapt methods to macro models like purchasing power parity (PPP) or uncovered interest rate parity (UIP), using inputs like interest differentials (RBA 3.85% vs Fed ~3.00 to 3.25%), relative inflation (Australia 3.4% vs US ~2.0%), and GDP growth (Australia 2.1% vs US 4.4%).
For instance, PPP models might project a value range of 0.70 to 0.75 based on growth assumptions of 2% differential, long-term inflation convergence to 2.5%, and a 5% risk premium, incorporating commodity support (e.g., gold rallies).
Compare to peers for relative valuation (e.g., AUD stronger vs USD due to hawkish RBA vs dovish Fed, with forecasts to 0.69 to 0.70 by mid-2026). Key metrics: Interest differential (+0.60%), real yield spread (positive for AUD), highlight efficiency and valuation status (undervalued below 0.70 amid policy divergence, but 0.71 forecasts imply upside). 📈
SWOT Analysis (Strengths, Weaknesses, Opportunities, Threats):
Strengths : 💪 Hawkish RBA hikes (to 3.85%), robust GDP (2.1%), strong labor market (unemployment 4.1%), commodity tailwinds (gold, iron ore).
Weaknesses : ⚠️ Dependence on China demand, persistent inflation (3.4%), potential capacity strains in housing.
Opportunities : 🌟 Fed rate cuts (50bp expected 2026), USD weakness from de-dollarization, global growth pickup.
Threats : 🛑 Geopolitical tensions (US-Iran), US policy shifts (Trump Fed chair), risk aversion spikes.
Technical and Risk Insights:
Incorporate non-repainting indicators like 200-day SMA (0.6700) for support/resistance. Current RSI (55) signals neutral momentum. Risk factors: Volatility (1.03%), or factor exposure (e.g., to interest rates). Consider performance attribution how much return comes from sector vs. stock selection (70% from rate differentials vs. commodity flows). 📉
Historical Context and Examples:
AUDUSD has shown 5 to 10% annualized volatility over 10 years, with examples like the 2022 dip leading to recovery (from 0.6200 low to 0.7000 rebound amid rate hikes). This illustrates how methods like SWOT or PPP can inform decisions in real markets. 📜
What do you think does this align with your view on AUDUSD for 2026? Share your analyses or charts below! ❓
#AUDUSD #StockAnalysis #FundamentalAnalysis #InvestingEducation

ONDO Dips to $0.28: RWA Gem Undervalued Amid 2026?Title: 🚨 ONDO Dips to $0.28: RWA Gem Undervalued Amid 2026 Unlocks or Supply Trap? Deep Dive!
Hello TradingView community! 👋
Today, let's dive into ONDOUSD with a detailed analysis focusing on fundamentals, SWOT, and technicals. 📊 This isn't financial advice just an in-depth look based on public data.
Current Snapshot:
Price: $0.28 💵
52-Week High/Low: $2.14 / $0.20 📈📉
Market Cap: $2.84B 💰
Fundamental Analysis (e.g., Intrinsic Value and Ratios):
For crypto tokens like ONDO (governance for RWA tokenization), adapt traditional methods to tokenomics and protocol metrics. No EPS or D/E, but use MC/TVL ratio (1.1x at $2.84B MC / $2.6B TVL), book value per token approximated via circulating supply (~3.2B pre-unlock, post ~5.1B after 1.94B unlock).
For instance, DCF models might project a value range of $0.30 to $0.50 based on growth assumptions of 20% TVL increase (historical 39% rise), terminal growth 5%, and 15% discount rate, using annualized fees ~$64M as cash flow proxy. Compare to peers for relative valuation (e.g., Centrifuge lower MC/TVL but less adoption; ONDO premium due to institutional ties).
Key ratios: Negative ROE analog ( -75% 1-year return), P/E N/A, but FDV/Fees ~42x highlights efficiency and valuation status (undervalued below $0.30 without unlock pressure, but $0.41 to $0.74 forecasts imply upside post-absorption). 📈
SWOT Analysis (Strengths, Weaknesses, Opportunities, Threats):
Strengths : 💪 Leader in RWA tokenization with $2.6B TVL, products like OUSG/USDY for tokenized Treasuries, institutional partnerships (Franklin Templeton, MetaMask), and scalable multi-chain presence.
Weaknesses : ⚠️ Heavy supply unlocks (1.94B tokens in Jan 2026, 61% increase), high volatility from market corrections (88% drawdown from ATH), and limited direct revenue accrual to token holders.
Opportunities : 🌟 Growing RWA market with regulatory clarity, new integrations (e.g., Solana stocks, perpetuals platform), and events like Ondo Summit driving adoption.
Threats : 🛑 Competition from Centrifuge/others, macro risks delaying institutional inflows, and persistent unlock dilution until 2026.
Technical and Risk Insights:
Incorporate non-repainting indicators like 200-day SMA ($0.70) for support/resistance. Current RSI (30) signals oversold 🚨. Risk factors: Volatility (beta ~1.8 vs BTC, implied from altcoin nature), or factor exposure (e.g., to interest rates via Treasuries).
Consider performance attribution how much return comes from sector vs. stock selection (60% from RWA trends vs. ONDO-specific unlocks). 📉
Historical Context and Examples:
ONDOUSD has shown -75% annualized returns over 1 year, with examples like the Jan 2026 unlock leading to recovery potential (from $0.20 low rebounding amid TVL growth).
This illustrates how methods like SWOT or relative valuation can inform decisions in real markets. 📜
What do you think does this align with your view on ONDOUSD for 2026? Share your analyses or charts below! ❓
#ONDOUSD #StockAnalysis #FundamentalAnalysis #InvestingEducation

Mastering Gold Valuation Models: Unlock XAUUSD's True Worth!Title: 📚 Mastering Gold Valuation Models: Unlock XAUUSD's True Worth for 2026 Traders! 🚀
Hello TradingView community! 👋
Today, let's dive into XAUUSD with a detailed educational post focusing on gold valuation models, fundamentals, and insights. 📊 This isn't financial advice just an in-depth look based on public data to help you understand how to value this timeless asset.
Current Snapshot:
Price: $4,940.73 💵
52-Week High/Low: $5,595.46 / $2,832.63 📈📉
Market Cap: N/A (spot commodity)
Fundamental Analysis (e.g., Valuation Models Explained):
Gold is a unique asset without cash flows, dividends, or earnings, so traditional DCF isn't directly applicable. Instead, models treat it as a store of value, inflation hedge, or financial asset influenced by macros. Here's a structured breakdown of key gold valuation models to empower your analysis:
- Interest Rate and Yield-Based Models 📉 : These view gold as a "zero-yield bond" where price inversely correlates with real interest rates (nominal minus inflation). For example, gold has an effective "real duration" of about 18 years a 1% rise in real yields (e.g., 10-year TIPS) historically drops inflation-adjusted gold prices by 18%. Simple formula: Fair Value ≈ Initial Value / (1 + Real Rate)^Time Horizon, adjusted for inflation expectations. In low/negative rate environments, this signals undervaluation (e.g., below $5,000 amid uncertainty).
- Supply and Demand Equilibrium Models ⚖️ : Frameworks like the World Gold Council's Qaurum balance supply (mining ~3,000 tons/year, recycling) with demand (jewelry ~45%, investment ~25%, central banks ~20%). Recent central bank purchases (>1,000 tons annually) can project fair value ranges like $5,400 to $6,300 under 10% growth assumptions. Production cost models provide floors (~$1,200 to $1,500/oz), but ignore speculative flows great for macro scenario testing.
- Relative Valuation Models 🔄: Compare gold to benchmarks for over/undervaluation. Ratios include S&P 500/Gold (e.g., ~1.36 ounces per S&P unit vs. historical averages signaling cheap gold) or gold's above-ground stock as ~50% of U.S. market cap (deviations from 20 to 50% norms indicate mispricing). Real yield correlation (~-0.7) highlights undervaluation in low-rate, high-uncertainty periods.
- Long-Term Expected Return Models 📈: Estimate 2 to 4% real returns based on gold's dual role as a good and asset, tied to global GDP growth minus portfolio expansion. Over decades (e.g., 1992 to 2025), gold averaged ~7 to 8% annually vs. S&P's ~11%. Formula: Expected Return ≈ β1 × GDP Growth - β2 × Global Portfolio Growth. Useful for portfolio allocation.
Key insights: Combine models for robustness e.g., yield-based for timing, supply-demand for fundamentals. Banks like Goldman forecast $5,400+ by year-end amid geopolitics. 📈
SWOT Analysis (Strengths, Weaknesses, Opportunities, Threats):
Strengths: 💪 Proven safe-haven with central bank demand (>1,000 tons/2025), low equity correlation (~0.4 beta to S&P).
Weaknesses: ⚠️ No yield, high volatility (e.g., recent 10% drops), USD/rate sensitivity.
Opportunities: 🌟 Geopolitical tensions (U.S.-Iran), potential Fed cuts, green tech industrial demand.
Threats: 🛑 Hawkish policy shifts, conflict de-escalation, "digital gold" competition like Bitcoin.
Technical and Risk Insights:
Use non-repainting indicators like 200-day SMA (~$4,200 to $5,000 range for support/resistance). Current RSI (~35 to 40) often signals oversold 🚨. Risks: Interest rate exposure, macro attribution (~60% returns from trends vs. supply). Consider time-series like ARIMA for forecasts. 📉
Historical Context and Examples:
Gold has delivered 7 to 8% annualized over 10+ years, with examples like 2022's recovery from $1,600 low to $2,000+ on inflation fears. Yield models predicted 2025 surges to $5,000+ amid low rates, showing how these frameworks inform real-market decisions. 📜
What do you think: Which gold valuation model resonates most with your XAUUSD view for 2026? Share your analyses or charts below! ❓
#XAUUSD #GoldValuation #ValuationModels #CommodityAnalysis #TradingEducation #FundamentalAnalysis #TechnicalAnalysis #GoldTrading #InvestingInsights

Estimated Stock Market Peak 2026"It's time to call 'bullshit' on the market."
The newswire has been busy lately, don't get distracted by; something feels off.
More than four years have passed since my last major stock market top analysis.
Why Bitcoin? Because it is one of the most cyclical assets, based on liquidity flows at the extreme end of the risk curve, leading the global market peak.
This was the first market cycle with high interest rates and without economic stimulus. Therefore, neither an expansion of the business cycle nor a comparable investment interest from retail, which ultimately led to a peak of apathy rather than euphoria. A typical sign of a later cycle environment, in times of economic uncertainty and risk aversion, with an absence of market breadth, in which only major caps temporarily lead and all other stocks and indicators lag behind. Without an expansion of the broader markets, the entire system risks collapse as soon as the blue chips lose momentum. Zombie companies survived on 0% interest rates, but now the bill is coming due. They have to refinance billions this year at significantly higher rates and will most likely not survive. Warren Buffett, on the other hand, is sitting on a historically high cash reserve of over $380b and doesn't want to "buy the dip", but rather first ride out the delayed effects of rapid interest rate hikes and market downturns on companies whose AI expenditures aren't based on actionable revenues.
Contrary to popular belief, rate cuts into a recession are not bullish.
The Fed could begin larger cuts once they realize the economy is falling off a cliff.
Markets will then respond by falling through the news narrative of an escalating potential war or energy crisis blackout bankrun leading to surging inflation and fears of a global recession.
Only when we hit rock bottom will the Fed have a reason to intervene and aggressively stabilize the market through QE and stimulus checks.
Meanwhile, the commodity supercycle is underway, countering the cryptocurrency market, which is based on tech and big risk-on sentiment speculation. Rising precious metals are a worrying warning signal for the economy, indicating the market being concerned about the stability of the system, predicting what lies ahead of us. A rotation is unlikely to occur immediately; instead, a deep retracement will likely have to take place first. Some of the weakness by stocks may become more pronounced whenever Gold gets a correction.
You will see the US stock markets similarly plunge, but then soar like an eagle as they become the last bastion of capitalism, as frightened money from all over the place, including sovereign bond markets, pours into equities one last time as exit liquidity like never before. It will be interesting to see how ByteDance, SpaceX, OpenAI, Anthropic, Databricks, Stripe, Canva, Revolut, Klarna and Kraken time their IPOs to coincide with the market peak.
The last crypto market capitulation in June 2022 was triggered by the disappearance of Luna(+UST), 3AC, BlockFi, Celsius and the short-term depegging of USDT, which are maximum fear events. This was followed by a five-month time-based capitulation and the absolute market bottom depression caused by the FTX insolvency.
Assumption of next market capitulation bottom:
Corporate Subprime Bitcoin Crisis of 2026
"The system works – but does it justify this valuation?"
Bitcoin was an asset, but it was treated like equity. The highest-probability risk is institutional treasury capitulation under debt and cash flow pressure.
2024–2025: Bitcoin was used as a balance sheet asset (leverage, convertible bonds, project financing). Many models only work when prices rise, and not in MSTR Ponzi schemes.
In 2026, refinancing becomes more expensive, cash flows are insufficient, covenants are triggered, and creditors demand de-risking. The accompanying stock market correction will certainly contribute to this.
= Everyone who needed to own Bitcoin has to sell. High volume and volatility, thin order book illiquidity, negative altcoin funding rates, large arbitrage, and unfavorable front page newspaper and magazines coverage of fear, uncertainty and doubt sentiment.
However, the maximum psychological effect only occurs when something unexpected happens and what is perceived as "safe" breaks down, resulting in existential consequences for private investors.
1. At least another ~1% USDTUSD decline due to altcoin capitulation selling, if not eventually, at a cycle bottom, the controlled Tether implosion restructuring to USDC (Circle)
2. A reputable, top-10, retail-loving coin (-90% Solana, Tron) loses significance/trust
3. Quantum anxiety, privacy wallet/custody layer shock due to wallet bug, smart contract freeze, multi-chain bridge problem, recovery failure
= At the end of the day, as always: Bitcoin hasn't failed – but everything around it.
Assuming the market continues to move at its current velocity relative to historical corrective structures, it seems logical that the loud and frightening crash as well as the associated surprise narrative, will occur during the Blood Moon sometime in February-March.
We will see which global fear narrative emerges while observing the bottoming process through technical indicators and on-chain data. Depending on the strength of the Q1 correction, possibly 5+ months later a bottom in August-October. You should start buying BTC as soon as the price drops below $48.5k, with a target range of around $39k. If the price retraces further, things might be different this time. I will provide you with a new update then. No financial advice.
This isn't about calling a precise top. It's about asymmetry and risk management. Don't be fooled into thinking the markets are doing well beneath the surface.
"Patience is bitter, but its fruit is sweet."
Thank you for reading.
Noteworthy to watch:
- 2029 Shmita year
- 2026 median housing market peak, 18-year real estate cycle recession
- 2026 George Tritch (Benner) cycle – time to sell
- 2026 Chinese Year of the Horse
- 2026 bearish stock market U.S. midterm election years
- 2026 longest ISM PMI<50 & Copper/Gold ratio contraction
- 2026 largest inverted yield curve & Gold/US02Y ratio above 200WMA
- U.S. initial jobless claims above 260k =recession
- JNK divergences overlaying SPX
- Energy rotation Oil and Gas, inflation rising
- DXY rising
- DOWJONES reaction at 34.5k-36k
- TOTAL3ES excluding Btc, Eth and Stablecoins, reaction at $270b
- ETH expanding flat bottom zone at $900

SPX | Anchored VWAP Decision PointUS equities are seeing a familiar pattern: index-level softness driven largely by a renewed tech/AI repricing, rather than uniform downside across all sectors. That usually makes the tape choppier around key levels, because breadth can look “fine” while the index still drifts lower.
On the chart, SPX is playing around the anchored VWAP (~6,864) and struggling to build traction back above it. Price is also compressing inside the local rising channel, while momentum is cooling (RSI sub-50), which often turns VWAP into a proper inflection point rather than just a “nice line on the chart”.
Catalysts: Big-tech earnings sensitivity remains high, and any shift in rate / growth expectations (plus headline risk) can easily be the trigger for a VWAP break or a reclaim.
Takeaway: ~6,864 anchored VWAP is the decision point — above it the structure can stabilise, below it the chart starts to look like a clean pullback path towards the lower dashed channel.

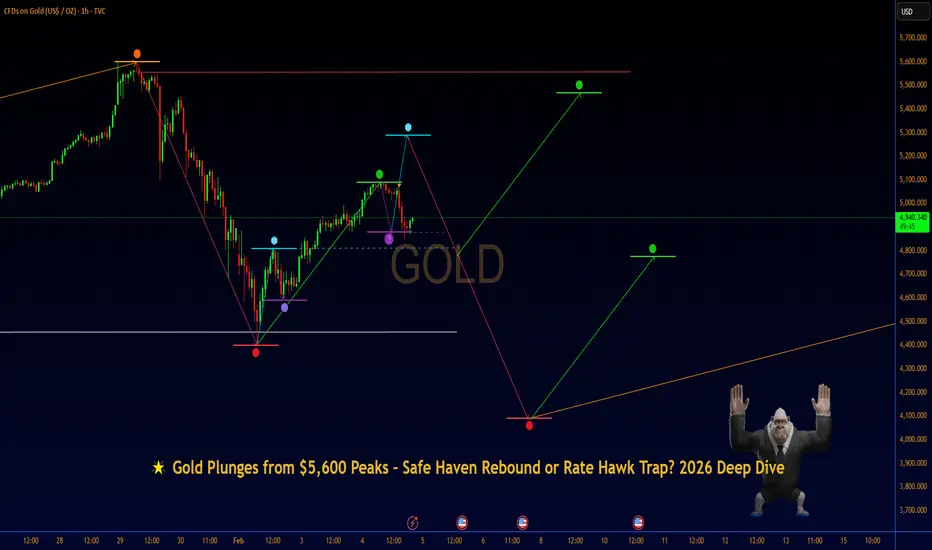
Gold Plunges from $5,600 Peaks – Safe Haven Rebound or?Title: 🌟 Gold Plunges from $5,600 Peaks – Safe Haven Rebound or Rate Hawk Trap? 2026 Deep Dive
Hello TradingView community! 👋
Today, let's dive into XAUUSD, aka. GOLD with a detailed analysis focusing on fundamentals, SWOT, and technicals. 📊 This isn't financial advice just an in-depth look based on public data.
Current Snapshot :
Price: $4,935.16 💵
52-Week High/Low: $5,626.80 / $2,855.00 📈📉
Market Cap: N/A (spot commodity)
Fundamental Analysis (e.g., Intrinsic Value and Ratios) :
Using methods like comparable analysis or forecast models (as DCF isn't directly applicable to commodities without cash flows), estimate fair value with inputs like historical growth, inflation expectations, and central bank demand.
For instance, models might project a value range of $5,400 to $6,300 based on growth assumptions of 10% annualized (historical average) for 5 years, terminal growth of 2% tied to inflation, and a 5% discount rate, incorporating recent central bank purchases exceeding 1,000 tons annually.
Compare to historical averages for relative valuation (e.g., current price-to-inflation adjusted average around 1.2x vs long-term 1.0x, suggesting potential undervaluation amid uncertainty).
Key metrics : Real yield correlation (-0.7, undervalued in low-rate environments), and opportunity cost (vs bonds) highlight efficiency and valuation status (undervalued below $5,000 without geopolitical premium, but forecasts imply upside to $5,400 by year-end from banks like Goldman). 📈
SWOT Analysis (Strengths, Weaknesses, Opportunities, Threats) :
Strengths : 💪 Proven safe-haven status amid macro uncertainty, strong central bank buying (over 1,000 tons in 2025), and diversification benefits in portfolios with low correlation to equities.
Weaknesses : ⚠️ High volatility from speculative flows (e.g., recent 10% drop), no yield generation, and sensitivity to stronger USD or rising rates.
Opportunities : 🌟 Escalating geopolitical risks (U.S.-Iran tensions), potential Fed rate cuts in slowdowns, and growing industrial demand in green tech (e.g., solar).
Threats : 🛑 Hawkish Fed policy shifts (e.g., new chair nomination), de-escalation in global conflicts reducing safe-haven bids, and competition from Bitcoin as "digital gold".
Technical and Risk Insights :
Incorporate non-repainting indicators like 200-day SMA ($4,200) for support/resistance. Current RSI (35.2) signals oversold 🚨. Risk factors: Volatility (beta 0.4 to S&P 500), or factor exposure (e.g., to interest rates).
Consider performance attribution how much return comes from macro trends vs. commodity-specific supply (e.g., mine output constraints contributing 60% to recent rallies). 📉
Historical Context and Examples :
XAUUSD has shown 10 to 15% annualized returns over 10 years, with examples like the 2022 dip leading to recovery (from $1,600 low to $2,000 rebound amid inflation fears).
This illustrates how methods like SWOT or forecast models can inform decisions in real markets. 📜
What do you think does this align with your view on XAUUSD for 2026? Share your analyses or charts below! ❓
#XAUUSD #Gold #CommodityAnalysis #FundamentalAnalysis #InvestingEducation
SLAB Surges 49% on TI Acquisition: Undervalued Tech Gem?Title: 🚀 SLAB Surges 49% on TI Acquisition: Undervalued Tech Gem or Premium Buyout?
Hello TradingView community! 👋
Today, let's dive into SLAB with a detailed analysis focusing on fundamentals, SWOT, and technicals. 📊 This isn't financial advice just an in-depth look based on public data.
Current Snapshot:
Price: $204.00 💵
52-Week High/Low: $207.50 / $82.82 📈📉
Market Cap: $6.702B 💰
Fundamental Analysis (e.g., Intrinsic Value and Ratios) :
Using methods like discounted cash flow (DCF) or comparable analysis, estimate intrinsic value with inputs like EPS (-2.64 TTM), book value per share ($32.59), and debt-to-equity (0.00).
For instance, DCF models might project a value range of $150 to $180 based on growth assumptions of 15% (historical revenue growth rate) for 5 years, terminal growth of 3%, and a 10% discount rate, using recent FCF of $66M.
Compare to peers for relative valuation (e.g., forward P/E of 50.76 is high compared to semiconductor industry averages around 30 to 40, suggesting growth premium).
Key ratios : ROE (-8.00%), P/E (N/A due to losses), and EV/EBITDA (N/A) highlight efficiency and valuation status (overvalued at current levels without the acquisition premium, but the $231 buyout price implies strategic value to acquirer TI). 📈
SWOT Analysis (Strengths, Weaknesses, Opportunities, Threats) :
Strengths : 💪 Leadership in low-power wireless IoT technology, broad and innovative product portfolio across protocols, strong security features like Secure Vault, and a robust $1.5B design win pipeline.
Weaknesses : ⚠️ Cyclical revenue declines (down 38% YoY recently), operating losses with negative margins (-11.58% profit margin), and over-reliance on the volatile Chinese market.
Opportunities : 🌟 Expansion into AI-integrated IoT solutions, emerging markets like smart home via Matter standard unification, and growth in industrial automation and renewable energy sectors.
Threats : 🛑 Intense competition from larger players like Texas Instruments and Broadcom, macroeconomic headwinds delaying projects, and supply chain vulnerabilities.
Technical and Risk Insights :
Incorporate non-repainting indicators like 200-day SMA ($142.17) for support/resistance. Current RSI (78.41) signals overbought 🚨. Risk factors: Volatility (beta 1.54), or factor exposure (e.g., to interest rates). Consider performance attribution how much return comes from sector vs. stock selection. 📉
Historical Context and Examples :
SLAB has shown 10 to 15% annualized returns over 10 years, with examples like the 2022 dip leading to recovery (from ~$210 high in 2021 to $82.82 low, rebounding amid IoT demand). This illustrates how methods like SWOT or DCF can inform decisions in real markets. 📜
What do you think does this align with your view on SLAB for 2026? Share your analyses or charts below! ❓
#SLAB #StockAnalysis #FundamentalAnalysis #InvestingEducation

GBPUSD Potential DownsidesHey Traders, in today's trading session we are monitoring GBPUSD for a selling opportunity around 1.37700 zone, GBPUSD is trading in a downtrend and currently is in a correction phase in which it is approaching the trend at 1.37700 support and resistance area.
Trade safe, Joe.

HYMC Surges 19% on Record Silver GradesTitle: HYMC Surges 19% on Record Silver Grades: Mining Revival or Dilution Danger? Full Breakdown 📈💎
Hello TradingView community! 👋
Today, let's dive into HYMC with a detailed analysis focusing on fundamentals, SWOT, and technicals. This isn't financial advice: just an in-depth look based on public data. 🔍
Current Snapshot : 📊
Price: 42.07
52-Week High/Low: 58.73 / 2.22
Market Cap: 3.493B
Fundamental Analysis (e.g., Intrinsic Value and Ratios) : 💹
Using methods like discounted cash flow (DCF) or comparable analysis, estimate intrinsic value with inputs like EPS (-1.54 TTM), book value per share (0.87), and debt-to-equity (282.69). For instance, DCF models might project a value range of $13-130 based on growth assumptions, incorporating projected resource expansions from high-grade silver discoveries and elevated gold/silver prices, with analyst targets varying widely due to speculative nature (e.g., median $13 suggesting downside, but some at $130 implying upside if mining resumes profitably).
Compare to peers for relative valuation: HYMC's Price/Book (73.56) is elevated compared to junior miners (often 1-5x for producers), reflecting hype but no current production. Key ratios: ROE (-374.61%), P/E (N/A due to losses), and EV/EBITDA (-0.81) highlight efficiency and valuation status (potentially undervalued on asset basis but overvalued on earnings, with negative cash flows emphasizing development risks). 📊
SWOT Analysis (Strengths, Weaknesses, Opportunities, Threats) : ⚖️
Strengths : Vast land holdings (over 64,000 acres in Nevada's Hycroft mine), recent high-grade silver discoveries (e.g., longest continuous intercept in Vortex zone), and resilient exploration amid record gold/silver prices driving revenue potential once operational. 💪
Weaknesses : No current revenue or production, ongoing losses (-$1.54 EPS), high debt levels, and history of dilution through stock offerings. ⚠️
Opportunities : Resuming low-cost heap leaching operations in 2026, resource updates from 2025-2026 drill program, and expansion in emerging high-grade zones amid silver price surge (up 160% in past year). 🚀
Threats : Volatility in precious metals prices, funding uncertainties (e.g., recent shelf filings for $163M), regulatory hurdles in Nevada mining, and insider selling signaling potential concerns. 🛑
Technical and Risk Insights : 📉
Incorporate non-repainting indicators like 200-day SMA (9.96) for support/resistance: current price well above signals strong bullish trend. Current RSI (57.02) signals neutral, with no immediate overbought conditions despite recent surge.
Risk factors : Volatility (beta 2.64), or factor exposure (e.g., to commodity prices). Consider performance attribution: recent return largely from sector-wide gold/silver rally (gold up 67%, silver 160% past year) and company-specific drill results, rather than broad market moves. ⚡
Historical Context and Examples : 📜
HYMC has shown explosive 1,652% returns over 1 year, with examples like the December 2025 surge (over 100% on silver price highs and drill results leading to new 52-week highs). This illustrates how methods like SWOT or DCF can inform decisions in real markets, identifying opportunities during commodity booms but cautioning on dilution post-rallies. 🔄
What do you think: does this align with your view on HYMC for 2026? Share your analyses or charts below! 💬
#HYMC #StockAnalysis #FundamentalAnalysis #InvestingEducation

GBP/NZD BEARS ARE STRONG HERE|SHORT
Hello, Friends!
GBP/NZD is making a bullish rebound on the 4H TF and is nearing the resistance line above while we are generally bearish biased on the pair due to our previous 1W candle analysis, thus making a trend-following short a good option for us with the target being the 2.259 level.
Disclosure: I am part of Trade Nation's Influencer program and receive a monthly fee for using their TradingView charts in my analysis.
✅LIKE AND COMMENT MY IDEAS✅

The Elephant Jungle 2/4/26 part 4So here’s the real question on the table, Are we in another PO3, but this time pushing back up toward at least 100k? It’s definitely starting to cook like we might be. We’ve already seen a sweep that fits the manipulation phase. Now the uncertainty kicks in. Do we get another sweep? Do we consolidate longer inside the manipulation box? Or does price finally start pressing higher and transition into the expansion phase?
That’s the part no one can force. All we can do now is wait, observe, and let price confirm. The jungle doesn’t rush, and neither should we.

The Elephant Jungle 2/4/26 part 3If you go back and read the articles from months ago, you’ll notice we kept talking about a PO3 playing out. Well, It wasn’t fast. It wasn’t pretty. But it was patient. That PO3 took over 120 days to fully play out. We reached the objective, pushed through every obstacle along the way, and made it all the way through the expansion phase. This is exactly why context matters in the jungle. Price doesn’t move on our timeline. It moves when the work is finished. And when you zoom out, you can see that the structure we were waiting on didn’t fail, it delivered. Now the question isn’t what happened. The question is what phase comes next.

DVA Surges 21% on Stellar Earnings: Undervalued Dialysis Giant?Title: DVA Surges 21% on Stellar Earnings: Undervalued Dialysis Giant or Short Lived Rally? Deep Dive Inside 🚀💹
Hello TradingView community! 👋📈
Today, let's dive into DVA with a detailed analysis focusing on fundamentals, SWOT, and technicals. This isn't financial advice, just an in depth look based on public data. 🔍📊
Current Snapshot:
Price: 134.73 💰
52 Week High/Low: 178.47 / 101.00 📉📈
Market Cap: 7.85B 🏦
Fundamental Analysis (e.g., Intrinsic Value and Ratios):
Using methods like discounted cash flow (DCF) or comparable analysis, estimate intrinsic value with inputs like EPS (9.51 TTM), book value per share (9.50), and debt to equity (1,111.35%).
For instance, DCF models might project a value range of 250 to 350 based on growth assumptions. Compare to peers for relative valuation. Key ratios: ROE (64.85%), P/E (14.17), and EV/EBITDA (8.02) highlight efficiency and valuation status (undervalued compared to healthcare services sector average P/E around 25 to 30). 📊💡
SWOT Analysis (Strengths, Weaknesses, Opportunities, Threats):
Strengths : Resilient business model with strong market position (>35% US share in dialysis services) and effective cost management. 💪🏆
Weaknesses : High debt levels and dependence on government healthcare programs for reimbursement. ⚠️📉
Opportunities : Expansion into integrated kidney care and emerging international markets like Brazil. 🌍🚀
Threats : Regulatory risks, competition, and vulnerability to cybersecurity threats. 🛡️😠
Technical and Risk Insights:
Incorporate non repainting indicators like 200 day SMA (129.85) for support/resistance. Current RSI (78.80) signals overbought. Risk factors: Volatility (beta 1.01), or factor exposure (e.g., to interest rates). Consider performance attribution how much return comes from sector vs. stock selection. 📉🔍
Historical Context and Examples:
DVA has shown 5.39% annualized returns over 10 years, with examples like 2025 dip (25% loss due to declining patient volumes) leading to recovery. This illustrates how methods like SWOT or DCF can inform decisions in real markets. 📜🔄
What do you think, does this align with your view on DVA for 2026? Share your analyses or charts below! 💭🗣️
#DVA #StockAnalysis #FundamentalAnalysis #InvestingEducation

Reddit (RDDT): Technically Aligned, Risk Now DefinedReddit is one of the most recognizable platforms on the internet.
A place where retail investors, niche communities, and real-time sentiment collide.
From WallStreetBets to hyper-specific hobby forums, Reddit is not just social media - it’s a behavioral data engine powered by highly engaged users. That alone makes it an interesting name for retail investors to keep an eye on.
🔍 Why Reddit is on my radar now
Technically, the stock has pulled back into a high-confluence demand zone — an area where risk-taking starts to make sense again.
This zone is not based on a single indicator, but on multiple overlapping technical signals:
1. Trendline support
Clearly defines an uptrend, with price coming into a third touch after a clean pullback from a prior high and evenly spaced reactions.
2. Fibonacci Golden Ratio (61.8%)
A textbook retracement level... often where strong stocks find renewed demand.
3. Channel projection (blue lines)
Price is interacting with the lower boundary of a broader price channel.
4. Equal waves (yellow dotted lines)
The corrective move has completed a symmetrical structure, suggesting downside momentum may be exhausted.
5. ~50% decline from the ATH
Historically, this is a level where emotions reset, and risk/reward starts to improve.
6. Psychological round number: $150
This is not a buy signal by default.
It’s a “pay attention” zone.
For me, this is exactly the kind of area where technicals say:
Now is the time to open the numbers, so... let fundamentals do the talking.
If the business story supports the structure, this zone can matter.
Good luck,
Vaido

Bitcoin Approaches Key Support Amid Wave V DeclineBitcoin is testing critical support levels after a complex corrective pattern, signaling a potential stabilization and rebound in the near term.
Bitcoin has been showing signs of a downward movement following the completion of a complex W-X-Y correction pattern, which forms part of a higher-degree wave IV correction on the daily chart. This suggests that the market is currently entering wave V of a larger-degree wave (A).
Notably, Bitcoin is now approaching a significant support zone between $70,000 and $74,000. Traders and analysts should closely monitor this area, as it could act as a pivot point for stabilization and the start of a corrective recovery in wave (B).
If the support holds, we may see Bitcoin consolidating and preparing for the next upward move. However, a decisive break below this zone could extend the corrective phase further, potentially altering the structure of the higher-degree waves.
Overall, the market is at a critical juncture. Short-term traders may look for stabilization signals in the $70k–$74k range, while long-term investors should remain cautious but attentive to potential recovery patterns.

EUR/USD – Watching for Wave (iii) AccelerationEUR/USD may have just completed a double zigzag Wave (ii) correction at the 1.1767 region, where we had perfect equality between Waves W and Y. Price has reacted off this level, and the structure now suggests a potential shift into the next impulsive leg.
If correct, the next move would be a classic Wave (iii) — typically the most explosive wave in a motive sequence.
📌 Key Levels
– Support: 1.1767 Zone (W = Y equality)
– Wave (iii) Projection: 1.2440 (161.8% extension of Wave (i))
📈 Structure So Far:
– Clean 5-wave move up into Wave (i)
– Double zigzag correction complete for Wave (ii)
– Bounce from key fib symmetry zone confirms interest

GOLD (XAUUSD): Important Decision Ahead
Gold is quickly recovering after a recent correction.
The market is currently approaching a major daily resistance.
Its breakout and a daily candle close above will push the price
to the levels of the current all-time high.
Alternatively, the price may retrace from that.
As always, I recommend being on the side of the trend
and trade only in case of a bullish breakout.
❤️Please, support my work with like, thank you!❤️
I am part of Trade Nation's Influencer program and receive a monthly fee for using their TradingView charts in my analysis.

DOW JONES INDEX (US30): Consolidation Completed?!
Dow Jones Index violated a resistance line of a symmetrical
triangle pattern on a daily time frame.
It indicates a highly probable completion of a bullish accumulation.
The market may continue rising now and reach 50000 level soon.
❤️Please, support my work with like, thank you!❤️
I am part of Trade Nation's Influencer program and receive a monthly fee for using their TradingView charts in my analysis.

GOLD 04/02 – SMC H4 ROUTE MAP | 5000 BALANCE STATE BROKEN👉 Fibo 0.5 has been broken → the market is no longer in a balanced upward state. What is happening now is a pullback in a bearish structure, not a reversal. Today, the focus is not on “buying or selling,” but on how the price reacts when it touches the old FVG and supply zones.
MACRO CONTEXT IN BRIEF
The market is still sensitive to Fed expectations and USD data → high intraday volatility.
Geopolitics keeps gold from collapsing directly, but not enough to pull a new trend.
➡️ Result: gold rebounds quickly, but there is no trend commitment yet.
TECHNICAL STRUCTURE H4
Previous H4 uptrend:
✅ has swept the peak
✅ a bearish CHoCH has appeared
Fibo 0.5 (≈ 5000) has been broken → the upward structure is invalidated.
Current price is:
rebounding to H4 FVGs
in the context of a still valid bearish structure
TODAY'S ROUTE MAP – KEY PRICE ZONES
🔴 UPPER ZONE – SELL REACTION ZONE (PRIORITY TO OBSERVE)
👉 5200 – 5250
H4 FVG
Fib 0.618 – 0.705
The “textbook” rebound zone in a bearish structure
➡️ If the price rebounds here but is not accepted, it is a clear signal of a continuation to decrease.
👉 5350 – 5450
High FVG + Fib 0.786
Only if the price breaks and holds above this zone, the H4 bearish bias will be negated.
🟢 LOWER ZONE – BUY REACTION / SUPPORT
👉 5000 – 5020 (has been broken, now a sensitive zone)
Old Fibo 0.5
Price may react, but it is no longer a safe buying zone for swing.
👉 4850 – 4900
FVG + Fib 0.382
Important support zone for the next decrease.
👉 4600 – 4550
Liquidity low
Only activated if bearish continues strongly and decisively.
HOW WE READ & TRADE TODAY
With the current structure:
Scalp: follow price reactions at FVG & fib (especially during the European – American session).
Swing: only follow the acceptance of the H4 structure, not emotional bottom fishing.
Remember:
👉 The strongest rebounds often appear in a bearish market. But only the structure decides who goes far, who gets eliminated.
LucasGrayTrading will continue to update as the price reacts at decisive zones. Follow to not miss quality intraday reactions.
— LucasGrayTrading

USD/CHF BEARS WILL DOMINATE THE MARKET|SHORT
Hello, Friends!
It makes sense for us to go short on USD/CHF right now from the resistance line above with the target of 0.761 because of the confluence of the two strong factors which are the general downtrend on the previous 1W candle and the overbought situation on the lower TF determined by it’s proximity to the upper BB band.
Disclosure: I am part of Trade Nation's Influencer program and receive a monthly fee for using their TradingView charts in my analysis.
✅LIKE AND COMMENT MY IDEAS✅

NZDJPY: Confirmed BoS 🇳🇿🇯🇵
NZDJPY will most likely continue rising after a confirmed
bullish break of structure on a daily time frame.
The next strong resistance is 95.0
❤️Please, support my work with like, thank you!❤️
I am part of Trade Nation's Influencer program and receive a monthly fee for using their TradingView charts in my analysis.

GBPCHF: Bulls Are Back 🇬🇧🇨🇭
GBPCHF finally looks bullish after a deep retest
of a recently broken daily structure.
A breakout of a resistance line of a falling channel/flag
on an hourly time frame leaves strong bullish clues.
We can expect a rise at least to 1.0654
❤️Please, support my work with like, thank you!❤️
I am part of Trade Nation's Influencer program and receive a monthly fee for using their TradingView charts in my analysis.
