Roper Technologies | ROP | Long at $350.00Technical Analysis
The price for Roper Technologies entered my "crash" simple moving average zone (green lines). This is often an area of support for algorithm traders. However, there are two open price gas all the way down near $317 that may get closed before a true move up. This gap closing aligns with my "major crash" simple moving average zone (gray lines). The major crash simple moving average zone represents the "best" buying zone for the bulls, but for building a position, my personal choice is to use both as entry zones.
Health
Debt-to-equity: 0.5x (healthy)
Quick ratio / short-term debt: 0.53 (some risk)
Altman's Z Score / bankruptcy risk: 3.3 (low risk)
Insiders
Lots of selling (like most tech), but there was some buying a few months ago: openinsider.com
Growth
Continued EPS and revenue growth into 2028 (as of this write-up). Today's drop was linked to weakness in 2026, but I suspect this is an overreaction - especially if the price drops down to $317 this year.
Action
On paper, this S&P 500 company is still very healthy and growth is projected through 2028. Is the 2026 weakness predictive of more downside to come? Time will tell. While I do think there is a chance of the price dipping to $317, especially if there is a slight market pullback soon, I'm not positive. So, with that info, I am creating a starter position at $350 and adding more if the price drops further to close the remaining open price gaps down near $317.
Targets into 2028
$406.00 (+16.0%)
$500.00 (+42.9%)
Technologystocks

$NET: The $464 Vision - Betting on the Edge AI Supercycle🌐🚀
Most analysts are looking at $249, but they are missing the forest for the trees.
Cloudflare isn't just protecting websites anymore; it’s the operating system for global AI inference.
The Setup: We are currently consolidating after a massive 3X run from the April 2025 lows.
I’m looking for a reclaim of $215 to confirm the move back to the ATH $260 range.
The Target: If the $5B ARR target is pulled forward by AI demand, a $464 price point represents a realistic 2027/2028 'blue sky' valuation.
Entry: $185 - $195 zone. Invalidation: A weekly close below $168 (200-day SMA).
#NET #Cloudflare #AIStocks #Breakout #TechStocks #CloudComputing

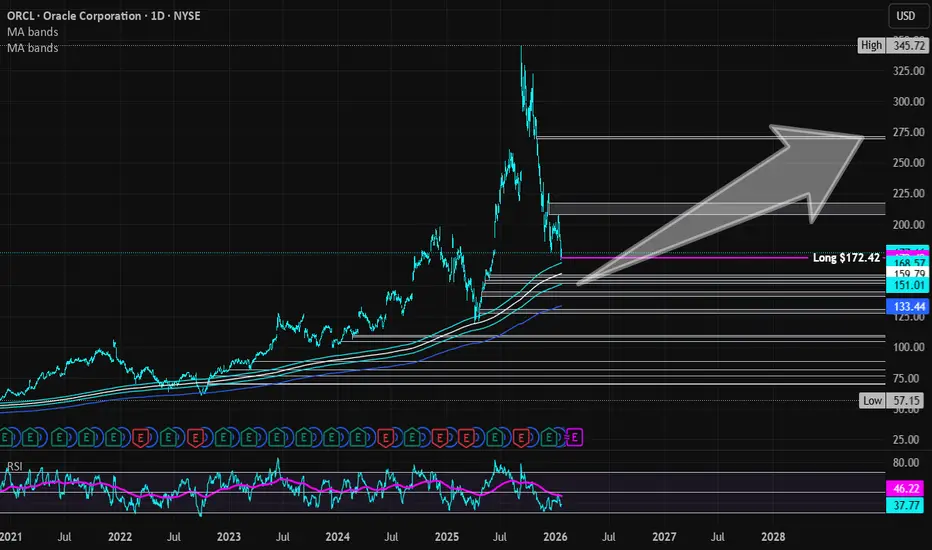
Oracle Corporation | ORCL | Long at $172.42Technical Analysis
The stock price for Oracle NYSE:ORCL touched the top of my selected historical simple moving average zone. This is often a strong area of support / resistance / algorithmic share accumulation. While the share price may fall into to $150's or slightly lower in the near-term, the long-term growth looks very promising.
Health
Debt-to-equity: 4.4x (of some concern)
Quick ratio / short-term debt: 0.9 (not great)
Altman's Z-score / long-term debt / bankruptcy risk: 2.5 (minor risk)
Growth
105.5% earnings-per-share growth projected between 2025 ($7.39) and 2028 ($15.19)
162.5% revenue growth projected between 2025 ($66.9 billion) and 2028 ($175.6 billion)
Action
While there may be near-term weakness to the $150's and lower, NYSE:ORCL is in a personal buy zone /starter position at $172.42.
Targets into 2028
$217.00 (+25.9%)
$270.00 (+56.6%)
Logitech International | LOGI | Long at $92.67Technical Analysis
The stock price for Logitech NASDAQ:LOGI briefly touched the top of my selected historical simple moving average zone. This is often a strong area of support / resistance / algorithmic share accumulation. Economic news may push the share price lower into the low $80's in the near-term, but the long-term growth looks very promising.
Health
Debt-to-equity: 0x (extremely healthy)
Quick ratio / short-term debt: 1.7 (ideal value)
Altman's Z-score / long-term debt / bankruptcy risk: 9.5 (extremely low risk)
Growth
31.0% earnings-per-share growth projected between 2025 ($5.36) and 2028 ($7.02)
14.6% revenue growth projected between 2025 ($4.8 billion) and 2028 ($5.5 billion)
Action
While there may be near-term weakness to the low $80's, NASDAQ:LOGI is in a personal buy zone at $92.67.
Targets into 2028
$115.00 (+24.1%)
$136.00 (+46.8%)

Island reversal, maybe bull trap and possible inverse H&S From August 2024 to September 2025 INTC ranged to form an island pattern which then reversed on 18 Sept 2025.
The rise/uptrend to $54 looked like a breakout but now (Jan 23rd 2026) it will open below the $50.54 neckline which began in Jan 2022. Is this a bull trap?
If it does fall further, it should make another shoulder to complete a 5 year inverse H&S pattern, and then break out over $50. Time will tell if this thesis is correct?

DocuSign | DOCU | Long at $56.00Similar to my sentiment around my investment in Zillow , DocuSign NASDAQ:DOCU may show continued weakness in the near-term. The open price gaps in the $30's and $40's may get filled before a strong move up given the housing market news is all doom and gloom (it's winter and interest rates are going lower this spring/summer, causing many buyers and sellers to 'pause' searching/selling). But, contrary to news headlines, the housing market is actually still red hot in many locations as the great wealth transfer continues. The market is still pent up with buyers and sellers who are looking for low rates to move / sign loans. So, from housing to financial institutions, NASDAQ:DOCU has hold within this niche.
Technical Analysis
The price is currently just below the bottom of my selected historical simple moving average band. This band represents the historical mean and, inevitably, the price ebbs and flows through it. It's often an area of share accumulation and support/resistance. If the price dips further into the $40's and $30's to close the lowest open price gaps, I'll be going in heavily (unless there is a major economic collapse).
Growth
Anticipated EPS growth between 2025 ($3.78) and 2027 ($4.54) = +20.0%
Anticipated revenue growth between 2025 ($3.21 billion) and 2027 ($3.69 billion) = +14.9%
Health
Debt-to-Equity: 0.1x (very healthy)
Quick Ratio / short-term debt: .73x (slight risk)
Altman's Z Score / risk of bankruptcy: 4.7 (low risk)
Action
While there may be short-term weakness for NASDAQ:DOCU down into the $40's and $30's, the future looks bright as long as the housing / financial market doesn't break. Thus, at $56.00, NASDAQ:DOCU is in a personal buy zone with additional entries planned with dips to close the lowest open price gaps (unless a major economic crash happens).
Targets into 2028
$83.00 (+48.2%)
$100.00 (+78.6%)

WULF risks of mid-term top being Price has reached a key macro resistance level, which could substantially increase selling pressure and push the market into at least a mid-term correction below November 2024 highs. As long as price continues to close below October highs, I favor the view that a mid-term top is likely in place.
While a final push higher into the resistance zone remains plausible — especially if price holds above the 21dEMA — maintaining a high level of caution with new or existing long exposure is strongly advised. The uptrend from the 2023 bottom appears to be finishing a diagonal structure, which by nature often results in sharp and deep pullbacks once fully complete.
Chart:
Chart (Weekly view):
Previously:
• On upside potential (Aug 14):
Chart:
www.tradingview.com
• On trend structure (Aug 12):
Chart:
www.tradingview.com
• On macro bullish structure (Jul 30):
Chart:
www.tradingview.com

HIVE on mid-term top and more downside potentialPrice has reached the key macro resistance outlined as a potential extension in the October update and continues to act in line with the reversal hypothesis mentioned in the last week review.
While price might already be completing the initial wave of decline, any recovery attempts should be approached as a bounce within a developing corrective phase, with the next macro support zone at 4–2.5 levels.
Chart:
Previously:
• On downside reversal (Oct 13) and on possible upside extensions (Oct 6): see chart in weekly review —
• On further upside potential (Sep 30):
Chart:
www.tradingview.com
• On bullish potential (Sep 10):
Chart:
www.tradingview.com
• On bullish trend structure (Jul 21):
Chart:
www.tradingview.com

OUST: bullish trend structureNASDAQ:OUST is acting constructively from the mid-term support zone outlined in the September analysis.
As long as price continues to close above 25.50, I’m watching for short- and mid-term upside continuation toward the 35 area and the low-40s resistance zone.
Potential swing-long parameters:
Risk/Stop level:
- partial: bellow 25.5
- full: bellow 24
Profit targets: 34-39 and 42
Chart:
Weekly:
Previously:
On macro trend structure (Sep 18):
www.tradingview.com
On mid-term consolidation (Sep 28):
www.tradingview.com

KULR: potential speculative swing-long opportunity Price is showing interesting tight action following a higher-low formation after a constructive recovery from the macro support zone.
I’m watching for upside continuation as long as price holds above the December lows.
Possible swing-long parameters:
Risk / stop-loss: partial below 3.20, full below 2.93
Profit targets: 4.35, 5.25, and 6
Chart:
Weekly view:

TTD: might be starting a new uptrend Watching for the start of a new swing uptrend, with scope to at least re-test the Aug/Oct highs and potentially begin a new macro uptrend that could take price above ATHs in the coming years.
Chart:
Monthly view:
Possible risk levels for at least 3-5 days swing trade long:
1. LOD: bellow 37.85
2. Bellow 36.79.

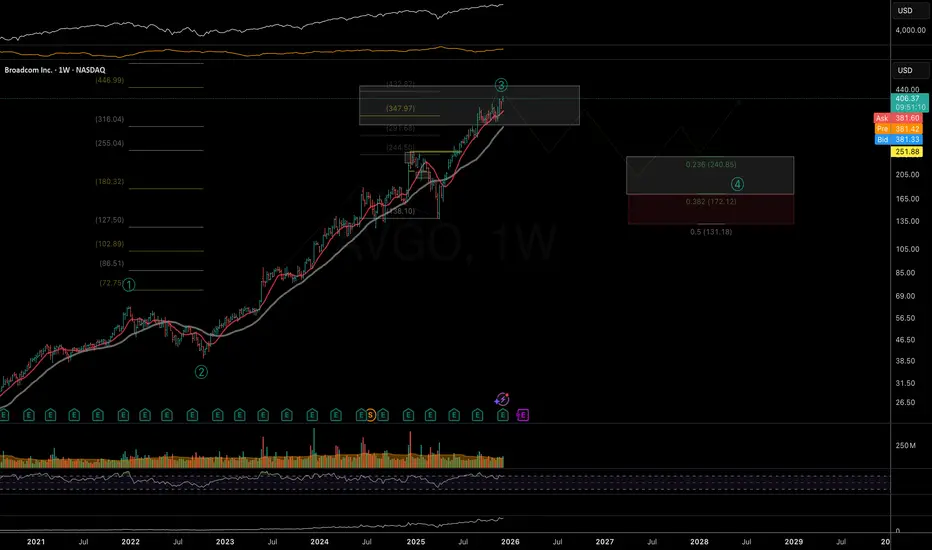
AVGO: at the macro resistance zone Although the initial immediately bullish January setup failed to follow through (see idea from Jan'25) — with price breaking local support and sliding deeper into a complex corrective structure — the broader macro trend structure may have effectively fulfilled itself after reaching major macro resistance levels built since the May bull run.
Chart (Weekly):
There is still not enough confirmation that a macro top is in. The first signs would be price starting to close below the 21DEMA and 50DMA, forming a sequence of lower highs along with bearish EMA convergence (similar to the February ’25 structure).
For now the key question is whether the negative post-market reaction to strong earnings and positive guidance will sustain. If selling pressure persists and price begins to decisively close below the 21EMA, that would increase the odds of a developing reversal. Otherwise, continued dip-buying may push price toward the upper boundary of the macro resistance box near 445.
Previously:
On a bullish macro structure (Jan'25):
On macro resistance zone (Sep 5 and 24):
www.tradingview.com
and
www.tradingview.com
Potential outside week and bullish potential for IMAXEntry conditions:
(i) higher share price for NYSE:IMAX above the level of the potential outside week noted on 7th November (i.e.: above the level of $35.60).
Stop loss for the trade would be:
(i) below the low of the outside week on 3rd November (i.e.: below $31.27), should the trade activate.

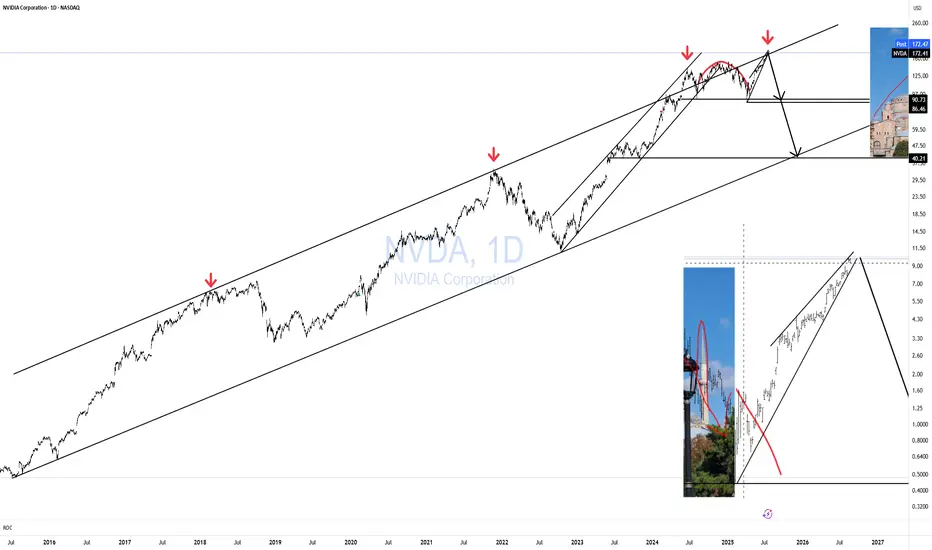
NVDA HAGIA SOPHIA!The Hagia Sophia pattern has now fully formed; it just needs the crack! and the Hook!
No matter what your vague hunches and feelings are about AI, the charts will always win.
You can't "buy the dip" unless you know when to "Sell the Rip"!
If you can't see this resistance area, I don't know what to tell you.
Everyone is bullish at the top of a bubbliotious market without exception!
Click boost, Like, Subscribe! Let's get to 5,000 followers. ))
A clear long term support that could be used to buyIn the last 5 years this has been a multi year support, many instances we went up from here.
Also ex dividend payment on 24 nov, some free money.

BKKT: price in the support zone to decide on the next movePrice decided to pull back deeper into the support zone, following an alternative path suggested in the October update.
Watching for the nature of the reaction from current levels, as price might be finishing either the entire correction since October highs or just its first wave. In any case, I’m expecting at least a bounce in the coming days.
Chart:
Previously:
• On support (Oct 9, in weekly overview):
Chart:
On support zone and potential start of a new swing (Oct 14):
Chart:
www.tradingview.com

MRVL: watching for bottom formation in coming monthsPrice continues to act in line with the trend structure outlined in the October update, starting a pullback after reaching the mid-term resistance zone and now reacting from the first level of support.
While a final push lower toward the 50-day MA remains possible in the near term, I’ll be watching for bottoming signs and the formation of a new base over the coming weeks and months.
Chart:
Previously:
• On downside potential (Aug 11):
Chart:
www.tradingview.com
• On support (Aug 25):
Chart:
www.tradingview.com
• On resistance zone (Oct 2):
Chart:
www.tradingview.com
• On pullback potential (Oct 10):
Chart:
See weekly review:

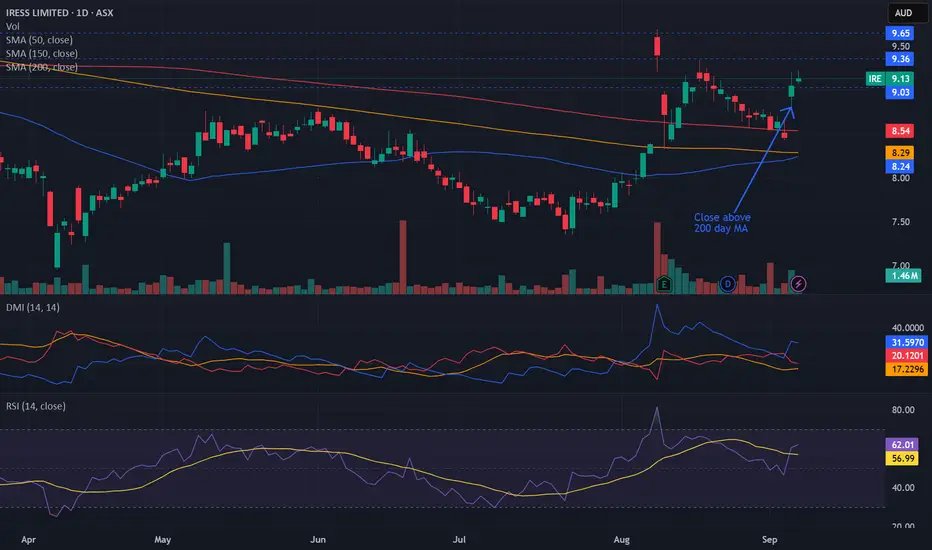
Bullish potential detected for IREEntry conditions:
(i) higher share price for ASX:IRE along with swing up of indicators such as DMI/RSI.
Depending on risk tolerance, the stop loss for the trade would be:
(i) below the low of the recent gap-up (4th September) of $8.80, or
(ii) below previous potential support of $8.63 from the open of 13th May.
Atlassian Corp | TEAM | Long at $180.12Atlassian Corp NASDAQ:TEAM
Technical Analysis:
Currently trading withing my historical simple moving average zone (i.e. reversion to the mean). This area is typically reserved for share accumulation. Many gaps above to close (as high as $420.80. I anticipate the price to stairstep up over the next few years as the company moves to AI.
Earnings and Revenue Growth
3x EPS growth by 2028 and revenue growth from ~$5 billion to ~$9 billion.
www.tradingview.com
Health
Debt-to-Equity: 0.73x (good)
Altman's Z-Score/Bankruptcy Risk: 6.8 (excellent/very low risk)
Insiders
Warning: Tremendous amount of selling.
openinsider.com
Action
Due to the high-growth potential of NASDAQ:TEAM and solid health, I am personally going long at $180.12. Only major warning is the amount of insider selling.
Targets in 2028
$223.00 (+23.8%)
$380.00 (+111.0%)

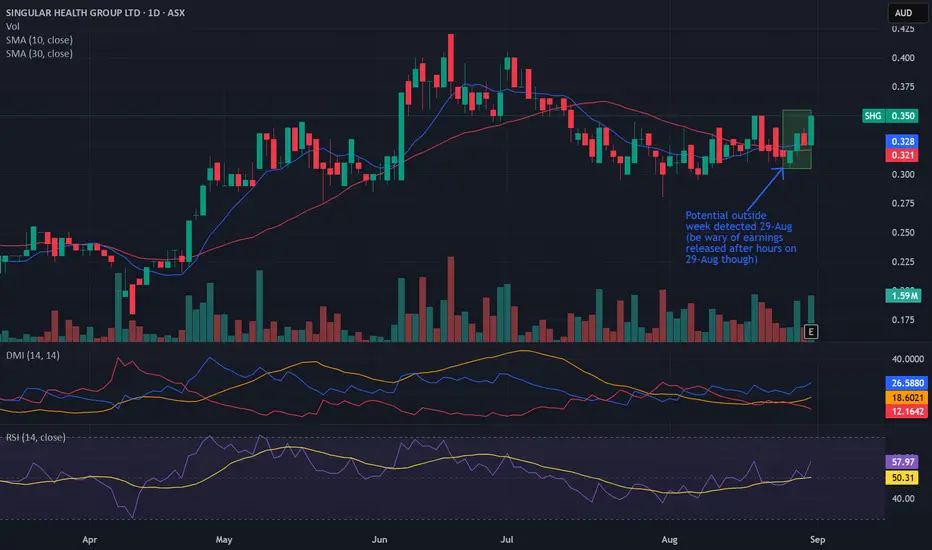
Potential outside week and bullish potential for SHGEntry conditions:
(i) higher share price for ASX:SHG above the level of the potential outside week noted on 29th August (i.e.: above the level of $0.355).
NOTE: Be wary of the market reaction on Monday, 1st September since the annual report was released after market hours on Friday, 29th August - don't chase the market if there is a severe gap up.
Stop loss for the trade would be:
(i) below the low of the outside week on 25th August (i.e.: below $0.305), should the trade activate.
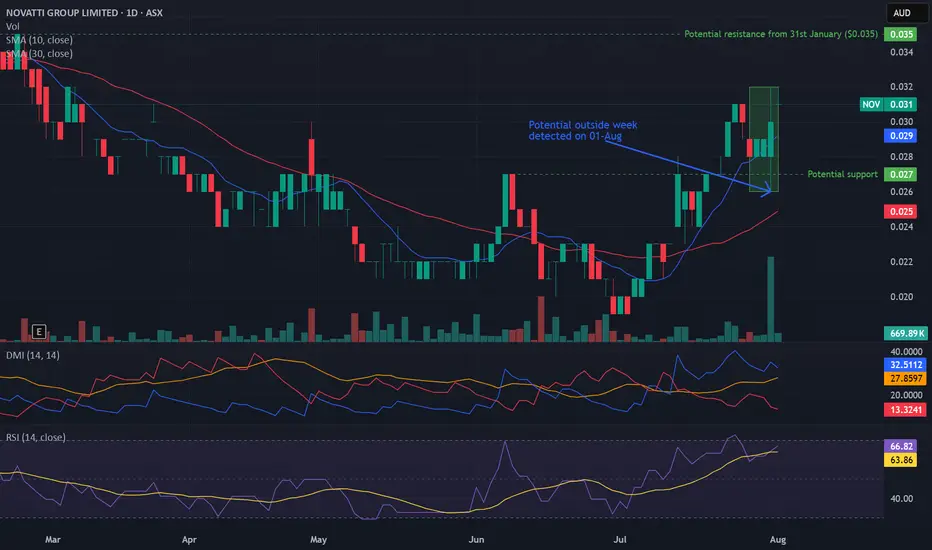
Potential outside week and bullish potential for NOVEntry conditions:
(i) higher share price for ASX:NOV above the level of the potential outside week noted on 31st July (i.e.: above the level of $0.032).
Stop loss for the trade would be:
(i) below the low of the outside week on 31st July (i.e.: below $0.026), should the trade activate.
Sabre Corporation (Revised) | SABR | Long at $1.76This is a revised analysis of Sabre Corp NASDAQ:SABR as seen here
-------
Full disclosure: I am still a holder of shares at $2.06 and newest entry at $1.76. My stop was triggered near $3.00 (original entry) a few days ago. If the price rises above $2.06, I plan to sell out of that entry a keep my lowest position moving forward.
This is a ***highly risky*** trade given the recent news around slower earnings growth and slump in travel demand in certain areas the company caters to. Do your own due diligence.
-------
NASDAQ:SABR stock took a major hit today after the company reported revenue growth below its projections in Q2 2025. Revenue was $687 million, down 1% year-on-year, missing the company's own guidance of "low single-digit" growth. They also significantly lowered full-year guidance for 2025, expecting Air Distribution Volumes to grow between 4-10% and full-year Adjusted EBITDA between $530-$570 million, down from previous projections. The company's higher exposure to corporate and government travel, including a decline in U.S. government and military travel, negatively impacted its performance.
From a technical analysis perspective, the price dropped today to an area 6 standard deviations away from the historical simple moving average zone (which rests now at $1.69 - blue line). While there may be a dead-cat bounce then further drop to near $1.00, the stock is behaving as expected given the bad news. However, a drop in interest rates will significantly benefit this company's debt burden. NASDAQ:SABR consistently ranks as one of the top players in the global travel technology landscape, so while I think the future is bright for the company given earnings projections (beyond 2025) and analyst estimates, 2025 will absolutely be a tough year.
So, at $1.76, I am buying the fear. Last entry near $1 if it gets there and the overall fundamentals do not change. Whatever my lowest entry is, I will be holding that and selling all previous entries near even to limit exposure.
Revised Targets into 2028:
$2.20 (+25.0%)
$2.90 (+64.8%)

In the 2030's The Nasdaq 100 to 2X the Dow Jones.#CupandHandle don't fight the trend.
Technology vs Industrials.
AI
Robotics
Space Economy
Biotech
Artificial Super Intelligence to power GDP to insane levels.
