eBay: Progress!Recently, eBay has shifted upward and has achieved consistent gains since. We now consider waves C in green and b in orange as completed and expect an imminent arrival at our red Short Target Zone between $92.40 and $98.54. There, the orange three-part move is projected to complete blue wave (ii), after which we anticipate significant sell-offs in the following wave (iii) below the support at $75.29.
Techsector

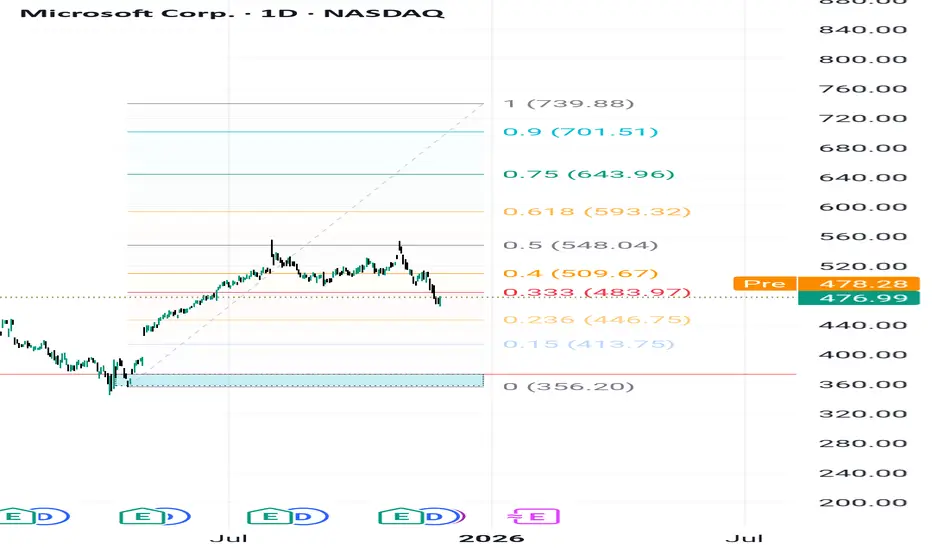
MSFT — Bullish Structure Intact Above 373.22, Targeting 739.88.Microsoft remains in a well-defined long-term bullish structure despite the current pullback from the 0.40–0.50 Fibonacci resistance cluster. The recent decline appears corrective in nature and does not signal any structural weakness as long as the stock preserves its main support foundation.
Key Support (Primary Structural Level): 373.22
The level at 373.22 represents the most critical demand zone on the chart.
It marks:
The origin of the previous bullish impulse,
A zone of strong institutional accumulation,
The base that
continues to anchor the long-term trend.
As long as price stays above 373.22, the broader upward cycle remains intact.
Fibonacci Expansion Targets (Long-Term Investor Levels)
The current impulsive leg projects the following upside targets:
483.97 (0.333)
509.67 (0.40)
548.04 (0.50)
593.32 (0.618)
643.96 (0.75)
701.51 (0.90)
739.88 (1.00 — primary long-term extension)
These levels correspond to strategic zones where institutional models anticipate consolidation or profit-taking.
Market Structure & Investor Outlook
The long-term trend remains strongly bullish.
The current pullback is normal retracement behavior.
Secondary demand pockets sit at 446.75 and 413.75 if the pullback deepens.
Macro structure remains fully intact above 373.22.
Bullish Continuation Scenario (Base Case)
If MSFT holds above 483.97 and regains momentum, the price can progress through:
509 → 548 → 593 → 643 → 701 → 739.88
This represents the natural continuation path of the current expansion.
Bearish Scenario (Limited & Non-Structural)
The only valid bearish scenario for now is a return to retest the key support at 373.22.
This move would represent:
A technical retest,
A liquidity sweep,
A refresh of institutional demand, not a trend reversal
As long as price holds 373.22, the long-term bullish structure remains unchanged.
Conclusion
Microsoft continues to demonstrate strong long-term structural integrity.
The only bearish possibility is a corrective move back toward the 373.22 support, after which the broader trend is expected to resume toward the long-term targets: 509, 548, 593, 643, 701, and 739.88.
Palo Alto Networks: Pullback Follows New All-Time HighPalo Alto initially climbed to a new all-time high, but the upward momentum soon faded, leading to a notable pullback. However, we expect the stock to recover soon and, as part of the magenta wave (3), break through resistance at $232.29. The following waves (4) and (5) are also projected to develop above this level, further fueling the ongoing upward trend. That said, we still see a 37% chance that PANW will instead complete (or has recently completed) turquoise wave alt.B below the $232.29 mark. In that scenario, wave alt.C could trigger sell-offs to a new low for magenta wave alt.(2) , though support at $139.18 should remain intact.

eBay: Confirming Wave [ii] Top Right on ScheduleeBay rallied once again to test resistance at $101.15, but quickly reversed with sharp sell-offs, confirming the top of magenta wave in a timely manner. Since then, the stock has moved as anticipated below the $86.36 level and now appears poised for further declines as part of wave . The subsequent wave- corrective move higher should remain capped below $86.36, allowing wave to complete turquoise wave 1 at a lower level—though still above $55.96.

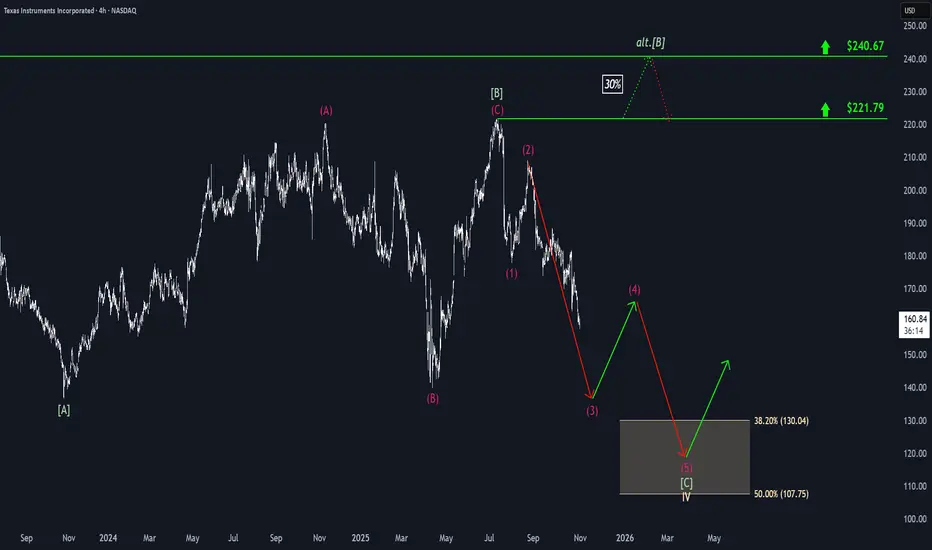
Texas Instruments: Extending DeclinesDespite some interim countermoves, Texas Instruments continued to see further sell-offs, advancing our primary scenario. Currently, we still see additional downside potential in magenta wave (3) before expecting a temporary rebound in wave (4). With wave (5), TXN is likely to dip into our beige Target Zone between $130.04 and $107.75, completing the broader correction of beige wave IV. There remains a 30% chance that a new (corrective) high in green wave alt. could still materialize, delaying the end of the correction. In this scenario, price would first move above resistance at $221.79 before reversing at the higher $240.67 level.
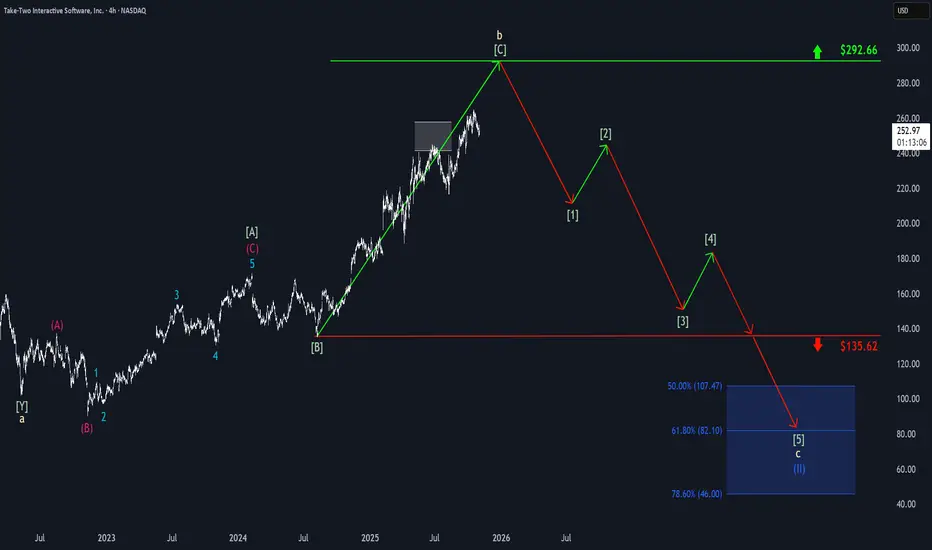
Take-Two: Momentum Fades, but Recovery ExpectedTake-Two’s upward momentum has faded recently, leading to a noticeable pullback. However, we expect the stock to rebound soon and resume the corrective advance of beige wave b, moving closer to resistance at $292.66. At that point, the stock is likely to reverse course and begin a green downward impulse, which should ultimately finalize the correction of blue wave (II). We have identified a blue Target Zone between $107.47 and $46 for this significant bottom.
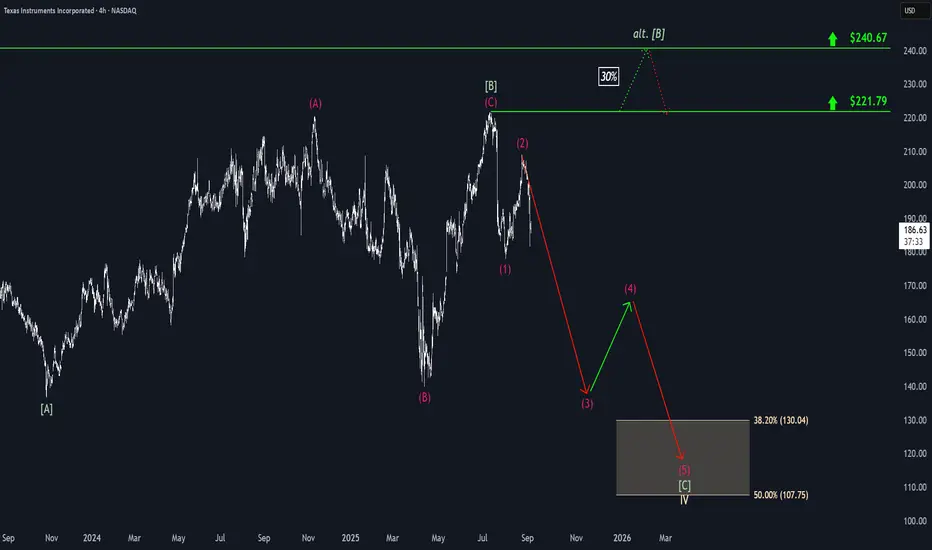
Texas Instruments: Rebound Underway, But Downside Still in PlayTexas Instruments initially continued its decline but has recently shown early signs of a rebound. Nonetheless, we still see greater downside potential in magenta wave (3), and expect the broader bearish magenta impulse to ultimately extend into the beige zone between $130.04 and $107.75. Should a new (corrective) high occur in green wave alt. above $221.79, it could temporarily postpone the anticipated sell-off. However, even in this 30% likely scenario, price would likely reverse no later than at the higher resistance level at $240.67.

Vimeo | VMEO | Long at $3.87Vimeo NASDAQ:VMEO provides a cloud-based platform for video creation, hosting, and sharing - primarily serving businesses, creators, and enterprises for professional video content management. While NASDAQ:VMEO has a **lot** of competition, it is a rather "healthy" company:
Debt-free (a rarity out there...)
Maintained profitability over the last twelve months, with a healthy gross profit margin of 78%
Earnings are forecast to grow 34.76% per year
[*}Revenue growth rate through 2027 is projected at 5.36% (modest)
Adjusted EBITDA guidance raised to $35 million, up from $25-30 million
Upcoming product developments, including AI-powered features and new SKUs, are expected to drive further growth
Insider bought over $868,000 in shares in the last year at an average price of $5.04
Subscriber growth is a concern...
From a technical analysis perspective, the stock price is currently near the bottom of my historical simple moving average bands. This region is typically an area of consolidation. The two open price gaps below the current price on the daily chart (down to $3.38) will likely get closed in the near-term before a move up. I do believe this is a risky investment, though, given the competition and economic headwinds. I would not be surprised if the market flipped and took this down near or below $1... But, if one is going purely by what the company reports concerning fundamentals and general growth, this is an undervalued stock in the $3 range.
Thus, if the insider/company hype is true, NASDAQ:VMEO is in a personal buy zone at $3.87 - with near-term risk of the stock dropping to close the price gaps on the daily chart down to $3.38... or below.
Targets into 2028:
$5.00 (+29.2%)
$6.40 (+65.4%)

Texas Instruments: Second Leg Down CompleteTexas Instruments has experienced sharp sell-offs, leading us to confirm the top of magenta wave (2). This suggests that the stock has completed the second stage of the ongoing magenta downward impulse. The current wave (3) still presents significant downside potential in the near term. After a brief recovery in wave (4), wave (5) is expected to reach our beige Target Zone between $130.04 and $107.75. A new corrective high in green wave alt. above $221.79 could delay this process. However, in this 30% likely scenario, TXN should reverse course at the latest by the $240.67 level.
Zscaler: BalancedZS has seen buyers and sellers largely balancing each other recently, preventing any significant moves in either direction. As a result, we continue to place the stock in a corrective rally as part of the magenta wave , with its high anticipated above the $259.61 resistance. However, if the price falls below the $153.70 support, the ongoing corrective structure will extend further, with the turquoise wave alt.X establishing a new low. This alternative scenario carries a 35% probability.

Take-Two: Continued Sideways MovementSince the beginning of February, Take-Two Interactive has been moving mostly sideways with a slight downward bias. Currently, the ongoing beige wave b should continue upward, driving the stock into the beige Target Zone between $241.59 and $257.87. There, this corrective rally should conclude, setting the stage for a sharp downward move. However, if the stock breaks below the support at $135.62, this will signal a premature correction low of the blue wave alt.(II) in the blue Target Zone between $107.47 and $46. We assign this scenario a 33% probability.

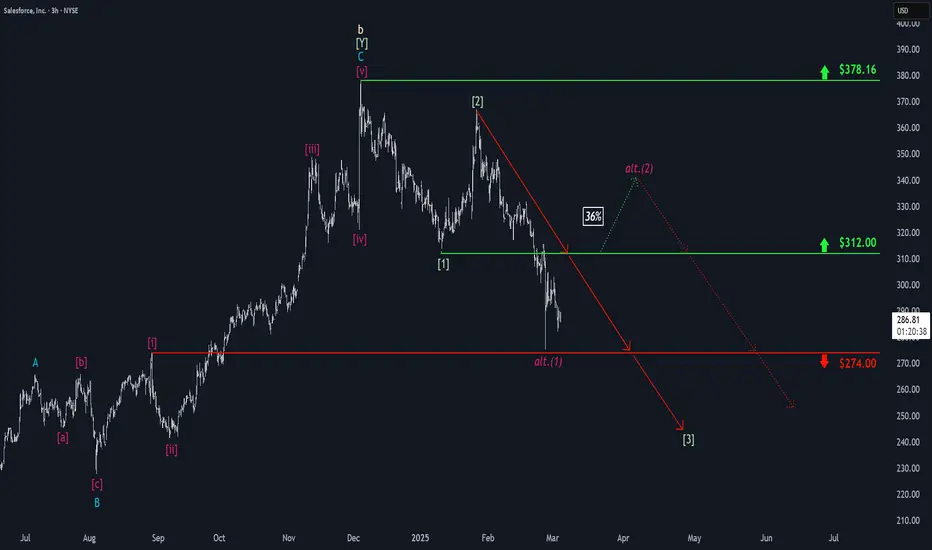
Salesforce: Further ProgressDue to continued downward pressure, Salesforce has made further progress in realizing our primary scenario. During the ongoing green wave , we still expect the stock to sell off below the support at $274. However, if the price imminently climbs above the resistance at $312, we will have to reconsider the structure of the ongoing decline and reckon with a magenta five-wave downward move. We currently assign this alternative scenario a 36% probability.
QQQ Thrives Amidst Trump Administration's UnpredictabilityQQQ still bullish amid all of the chaos of Trump's first few weeks. Friday saw a high that was just a touch shy of a new ATH. Next week will give us a good idea what the future is, if we pull back we may be seeing a double top if you are bearish or we could make a new ATH and power on higher with bulls in control.

Qualcomm: Target Zone Active!QCOM is still trading outside our blue Target Zone, which spans from $159.57 to $121.52. While the stock has fulfilled the technical minimum requirement for the blue wave (IV) by reaching this range, we primarily expect further sell-offs and lower lows before the correction is complete. A premature breakout will only be confirmed if the price sustainably surpasses the $182.08 mark (37% likely).

Adobe: In Our Target Zone!The ADBE stock has continued its downward movement, heading directly toward the center of our beige Target Zone (coordinates: $449.61 – $331.93). With this range now reached, the minimum requirement for the ongoing correction has been met. However, our primary expectation remains that the price will engage more extensively within our Zone, as we anticipate the bottom of the beige wave x to form deeper within it. Once the low is established, we expect the subsequent wave y to resume the upward trend and surpass the resistance at $640. There, the larger blue wave (b) should be completed as well.

Cloudflare: ResistanceBy expanding the green wave 3, NET recently stretched above the resistance at $117.70. However, the stock only briefly surpassed this level before encountering selling pressure, which pushed it back to its early December levels. Primarily, we expect the price to overcome this resistance to complete the green five-wave structure and, thus, the orange wave iii. A still ongoing wave alt.ii correction remains a possibility in the context of our 30% likely alternative scenario.

Red Flag in Tech: SMH vs. QQQ Breakdown Signals Potential Introduction:
Despite the bullish seasonality currently supporting the market, a concerning signal is emerging from a key driver of this stock market rally: the ratio between semiconductors NASDAQ:SMH and the Nasdaq 100 NASDAQ:QQQ . This ratio serves as a critical gauge of tech sector health, as the major tech and AI players fueling this bull market rely heavily on semiconductor innovation.
Analysis:
Tech Sector Health: The SMH-to-QQQ ratio has historically been a strong indicator of tech sector momentum. When semiconductors outperform, it signals strength and optimism in the broader tech sector. Conversely, underperformance by chip stocks raises concerns about the sustainability of tech-driven rallies.
Emerging Concern: Currently, this ratio appears to be breaking down from a rounding top formation—a bearish signal. If this trend persists, it could lead to increased market volatility, potentially as early as year-end or into early 2025.
Market Implications: For the bull market to maintain its momentum, this ratio needs to reverse course soon. Semiconductors are not just another tech subsector—they are foundational to the AI and big tech themes driving this rally. A continued breakdown could dampen market sentiment, impacting broader indices.
Conclusion:
The SMH-to-QQQ ratio is flashing a warning signal, with a potential breakdown that could lead to increased volatility in the near term. However, chip stocks still have time to recover and restore market confidence. This ratio will be a crucial indicator to watch as we approach the end of the year. Will chip stocks regain their footing, or are we headed for a turbulent 2025? Share your insights below!
Charts: (Include relevant charts showing the SMH-to-QQQ ratio, the rounding top formation, and support and resistance levels)
Tags: #Semiconductors #Nasdaq #TechSector #SMH #QQQ #MarketTrends #TechnicalAnalysis

Tech on the Edge: SMH vs. QQQ Signals Caution Amid Bull MarketIntroduction:
While we remain enthusiastic about the strength of the current bull market, emerging signs of stress in capital flows warrant a closer look, particularly in the tech sector. One key metric to monitor is the ratio between semiconductors (SMH) and the Nasdaq 100 (QQQ). This ratio acts as a barometer for tech sector health: when SMH outperforms QQQ, it indicates a risk-on environment; conversely, QQQ outperforming SMH raises caution flags.
Analysis:
Tech Sector Barometer: The SMH-to-QQQ ratio has historically been a reliable indicator of momentum in the tech sector. Outperformance by SMH reflects strong demand for semiconductors and broader tech health, while underperformance signals potential concerns.
Emerging Concern: Currently, we’re observing the potential development of a rounding top formation in the SMH-to-QQQ ratio. While this formation isn’t confirmed, a breakdown below key support would validate it, signaling broader weakness in the tech sector.
Critical Inflection Point: For now, chip bulls must take control and push this ratio higher to maintain sector strength and prevent a broader pullback in the market. Failure to do so could signal a shift in sentiment and increased vulnerability in tech stocks.
Conclusion:
The SMH-to-QQQ ratio is at a critical juncture, with the potential to dictate near-term momentum in the tech sector. While the bull market remains intact, any confirmed weakness in this ratio could signal broader vulnerability in tech stocks. Will chip bulls step up to defend the sector, or are we on the cusp of a pullback? Share your thoughts below!
Charts: (Include relevant charts showing the SMH-to-QQQ ratio, the potential rounding top formation, and key support levels)
Tags: #Semiconductors #Nasdaq #TechSector #SMH #QQQ #MarketTrends #TechnicalAnalysis

Qualcomm: Target Zone Ahead!While many tech-sector stocks are aiming for new highs, QCOM remains locked in a narrow range around the $170 level. Last week, the stock initially reacted to the 23.60% retracement and now hovers near the edge of our blue Target Zone (coordinates: $159.57 to $121.52). Our primary expectation is for the blue wave (IV) to extend further below the support at $151.39, where we anticipate its low point. Technically, a direct breakout to the upside is also possible, as our Target Zone – and thus the minimum correction threshold – has already been reached. If the price decisively breaks above the resistance levels at $193.84, an overarching alternative wave count will come into play (probability: 33%).

In the Green: Roundhill Magnificent Seven ETFNASDAQ:MAGS looks extremely bullish.
Last week price action printed a massive bullish engulfing bar and RE bar above previous all time high signaling lots of strength. It is highly unlikely we get a second ideal entry opportunity but in the case we do, dca at around $50 is the way to go.
There is a bullish time at mode confirmed
- Expiry set by the end of November
- Next target is $55

Zscaler: Wave (2) Correction! After a rapid rise in early September, the ZS stock managed to reach the highs from August, but there was no significant acceptance at this level. Structurally, the upward movement isn't sufficient for us to consider wave (2) as completed. So far, the bullish signals lack a clear impulsive character, and we expect new lows during the magenta wave (2), which should primarily end above the support at $84.93. Once a trend reversal has been initiated, the subsequent wave (3) should push through the resistance at $251.45. According to our 33% likely alternative scenario, this could also happen directly.

Semiconductors vs. Nasdaq: Key Indicator of Tech MomentumIntroduction:
The ratio between semiconductors NASDAQ:SMH and the Nasdaq 100 NASDAQ:QQQ serves as a key indicator of tech sector momentum and near-term risk sentiment. When SMH outperforms QQQ, it signals a "risk-on" environment, reflecting strong demand for semiconductors and overall tech sector health. Conversely, if QQQ outperforms SMH, it suggests a "risk-off" environment, pointing to concerns over weakening chip demand.
Analysis:
Risk Sentiment: The SMH-to-QQQ ratio provides insights into tech momentum. A higher SMH performance often indicates robust chip demand, a positive signal for the broader tech sector. On the other hand, when QQQ outperforms, it signals caution, possibly reflecting waning demand for semiconductors.
Bullish Outlook: Recently, the SMH-to-QQQ ratio has formed a higher low, reinforcing a bullish outlook for semiconductors. This higher low is a positive sign not just for the semiconductor industry but for the broader market as well, as semiconductors often lead market rallies.
Conclusion:
The recent bullish signal in the SMH-to-QQQ ratio suggests tech sector strength, with semiconductors likely leading the way. This is a critical metric for assessing near-term market momentum, so traders should keep a close eye on this ratio to gauge potential shifts in sentiment. What’s your take on this trend? Feel free to share your thoughts in the comments!
Charts: (Include relevant charts showing the SMH-to-QQQ ratio and the higher low formation)
#Semiconductors #Nasdaq #TechSector #SMH #QQQ #RiskOn

QQQ in correction - How low will it go?QQQ lost the 20 day SMA yesterday. History shows that there is a very strong probability that it will go lower. Today say it hold at the support of the AI-based rally over the last year or so. It broke through that the other week, but then we say the strong rally. I noted back then that it felt like a dead cat bounce counter rally to me. Looks like it is proving to be true. It is going to be tricky knowing where this one will stop. I previous posts I noted that red trend line a critical level and that is where we saw the dramatic bounce start from. I am sure where this one will stop. QQQ is usually very bullish and the second of two corrections can often be less than that first. I am looking at that red trend line again, the 200 day SMA, as well as the center of the trading channel.
