eBay: Progress!Recently, eBay has shifted upward and has achieved consistent gains since. We now consider waves C in green and b in orange as completed and expect an imminent arrival at our red Short Target Zone between $92.40 and $98.54. There, the orange three-part move is projected to complete blue wave (ii), after which we anticipate significant sell-offs in the following wave (iii) below the support at $75.29.
Techstock

Uptrend Started After Liberation Day - All Has Broken BelowThe US markets have been described as “on a rally” for quite some time. I would not agree if it is meant to describe the overall US market, but would agree if it refers specifically to AI or tech stocks. Why?
Among the four major US indices, the Russell—representing a much broader base of US-listed companies—continues to struggle to break above its high from last year, even though the others have far surpassed it. In fact, it has since corrected by 9.5% since its all-time high just last month.
After that, the other indices are also following suit only in the past few days, breaking below this uptrend that started in April.
Russell has taken the lead and has broken below this trend in late October.
The earliest clue came from the Russell Index, where many suppliers of the Magnificent 7 companies are also part of Russell 2000 components. When the Russell—or smaller-cap companies—starts to weaken, it often reflects broader market pressures that may eventually spill over to the rest of the indices or vice versa.
Video version on the process of how I monitor the four indices and then narrow it down to the individual index.
Micro E-mini Russell 2000 Index
Ticker: M2K
Minimum fluctuation:
0.10 index points = $0.50
Disclaimer:
• What presented here is not a recommendation, please consult your licensed broker.
• Our mission is to create lateral thinking skills for every investor and trader, knowing when to take a calculated risk with market uncertainty and a bolder risk when opportunity arises.
CME Real-time Market Data help identify trading set-ups in real-time and express my market views. If you have futures in your trading portfolio, you can check out on CME Group data plans available that suit your trading needs www.tradingview.com

Analysis for What’s Coming - AI Bubble Sentiment The US markets have been described as “on a rally” for quite some time. I would not agree if it is meant to describe the overall US market, but would agree if it refers specifically to AI or tech stocks. Why?
Among the four major US indices, the Russell—representing a much broader base of US-listed companies—continues to struggle to break above its high from last year, even though the others have far surpassed it. In fact, it has since corrected by 9.5% since its all-time high just last month.
After that, the other indices are also following suit only in the past few days, breaking below this uptrend that started in April.
Micro E-mini Russell 2000 Index
Ticker: M2K
Minimum fluctuation:
0.10 index points = $0.50
Disclaimer:
• What presented here is not a recommendation, please consult your licensed broker.
• Our mission is to create lateral thinking skills for every investor and trader, knowing when to take a calculated risk with market uncertainty and a bolder risk when opportunity arises.
CME Real-time Market Data help identify trading set-ups in real-time and express my market views. If you have futures in your trading portfolio, you can check out on CME Group data plans available that suit your trading needs www.tradingview.com

eBay: Set for Further DeclineseBay has recently made another move higher, briefly reclaiming the $86.36 level. However, the stock has since resumed its downward trajectory as anticipated and is expected to continue selling off soon as part of magenta wave . Overall, this magenta downward impulse should push price closer to support at $55.96, completing turquoise wave 1.
Palo Alto Networks: Pullback Follows New All-Time HighPalo Alto initially climbed to a new all-time high, but the upward momentum soon faded, leading to a notable pullback. However, we expect the stock to recover soon and, as part of the magenta wave (3), break through resistance at $232.29. The following waves (4) and (5) are also projected to develop above this level, further fueling the ongoing upward trend. That said, we still see a 37% chance that PANW will instead complete (or has recently completed) turquoise wave alt.B below the $232.29 mark. In that scenario, wave alt.C could trigger sell-offs to a new low for magenta wave alt.(2) , though support at $139.18 should remain intact.

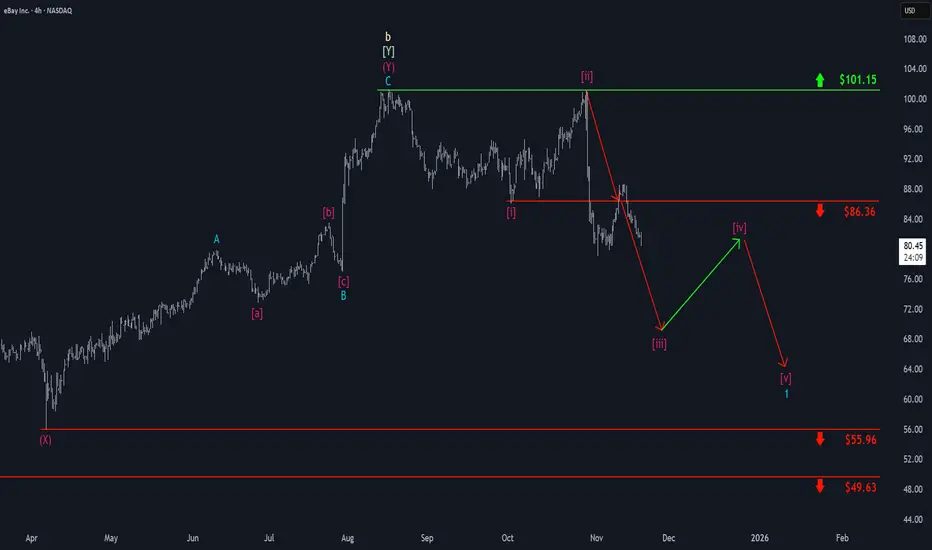
eBay: Confirming Wave [ii] Top Right on ScheduleeBay rallied once again to test resistance at $101.15, but quickly reversed with sharp sell-offs, confirming the top of magenta wave in a timely manner. Since then, the stock has moved as anticipated below the $86.36 level and now appears poised for further declines as part of wave . The subsequent wave- corrective move higher should remain capped below $86.36, allowing wave to complete turquoise wave 1 at a lower level—though still above $55.96.

Booking: Persistent Counter PressureBooking has continued to face persistent counter pressure to the upside, which resulted in only limited downward movement. We still primarily expect that, within the current magenta downward impulse, price will move closer to—and eventually fall below—the support level at $4,093. However, if stronger upward momentum emerges and pushes price above the $6,101 resistance, we will then have to consider the stock as remaining in a broader uptrend, with the potential for a new high in blue wave alt.(I) (probability: 37%).

QQQ Resistance - Big pullback or breakout comingAs you can see from the trend lines, we are about to touch resistance. The last two times this happened we got a sizable pullback. During COVID, it was a breakout. QQQ just keeps pushing higher on the AI trade as the bubble just continues to grow. The AI trade is still strong. Right now companies are making massive "deals" (okay, promises) and stocks just keep exploding. It will be interesting to see how this plays out in the next few weeks.

NAS100: CRITICAL BREAKOUT ZONE! 25K Battle Ahead 🚀 NAS100: CRITICAL BREAKOUT ZONE! 25K Battle Ahead 📊
Current Price: 24,507.1 | Date: Sept 27, 2025 ⏰
📈 INTRADAY TRADING SETUPS (Next 5 Days)
🎯 BULLISH SCENARIO
Entry Zone: 24,480 - 24,520 📍
Stop Loss: 24,420 🛑
Target 1: 24,650 🎯
Target 2: 24,800 🚀
🎯 BEARISH SCENARIO
Entry Zone: 24,550 - 24,580 📍
Stop Loss: 24,630 🛑
Target 1: 24,300 🎯
Target 2: 24,150 📉
🔍 TECHNICAL ANALYSIS BREAKDOWN
📊 KEY INDICATORS STATUS:
RSI (14): 58.3 ⚡ *Neutral Zone - Room to Move*
Bollinger Bands: Mid-band Squeeze 🔥
VWAP: 24,465 - Dynamic Support Holding 💪
EMA 50: 24,380 ✅ *Bullish Above Key Level*
Volume: Declining 📊 *Awaiting Catalyst*
🌊 WAVE ANALYSIS:
Elliott Wave: Wave 4 Correction Complete 🌊
Next Target: Wave 5 Extension to 25,200+ 🎯
🔄 HARMONIC PATTERNS:
Bullish Bat Pattern Active at 24,450 ✨
ABCD Completion targeting 24,750 🔄
⚖️ SWING TRADING OUTLOOK (1-4 Weeks)
🚀 BULLISH TARGETS:
Weekly Resistance: 24,850 🏆
Monthly Target: 25,200 🌙
Gann Square of 9: 25,000 ⭐
📉 BEARISH INVALIDATION:
Weekly Support: 24,200 ⚠️
Critical Level: 24,000 🚨
🎭 MARKET STRUCTURE:
Trend: Consolidating Bullish 💪
Momentum: Building Energy 🔥
Wyckoff Phase: Re-accumulation 📈
Ichimoku: Neutral Cloud 🟡
🔥 CRITICAL LEVELS TO WATCH:
Resistance: 24,600 | 24,750 | 25,000 🚧
Support: 24,350 | 24,200 | 24,000 🛡️
Breakout Trigger: 24,580 confirmed close 💥
⚡ RISK MANAGEMENT:
Max Risk per Trade: 1.5% 🛡️
R:R Ratio: Minimum 1:3 ⚖️
Position Size: Conservative in Range 📏
🌍 MARKET CATALYSTS:
Tech Earnings Season Approaching 💼
Fed Policy Impact on Growth Stocks 🏛️
AI/Tech Momentum Driving Index 🤖
🎯 FINAL VERDICT:
NAS100 coiling for EXPLOSIVE MOVE! 🚀
25K psychological level in sight! 💥
Watch for volume spike above 24,580 👀
Trade Management: Scale in on pullbacks to VWAP 📈
Key Decision Zone: 24,500-24,600 battle crucial ⚔️
---
*⚠️ Disclaimer: Trading involves risk. Use proper risk management. This analysis is for educational purposes only.*
For individuals seeking to enhance their trading abilities based on the analyses provided, I recommend exploring the mentoring program offered by Shunya Trade. (Website: shunya dot trade)
I would appreciate your feedback on this analysis, as it will serve as a valuable resource for future endeavors.
Sincerely,
Shunya.Trade
Website: shunya dot trade
🔔 Follow for Daily Updates | 💬 Share Your NAS100 Strategy

Qualcomm: Target Zone Active!QCOM is still trading outside our blue Target Zone, which spans from $159.57 to $121.52. While the stock has fulfilled the technical minimum requirement for the blue wave (IV) by reaching this range, we primarily expect further sell-offs and lower lows before the correction is complete. A premature breakout will only be confirmed if the price sustainably surpasses the $182.08 mark (37% likely).

Cloudflare: ResistanceBy expanding the green wave 3, NET recently stretched above the resistance at $117.70. However, the stock only briefly surpassed this level before encountering selling pressure, which pushed it back to its early December levels. Primarily, we expect the price to overcome this resistance to complete the green five-wave structure and, thus, the orange wave iii. A still ongoing wave alt.ii correction remains a possibility in the context of our 30% likely alternative scenario.

Qualcomm: Target Zone Ahead!While many tech-sector stocks are aiming for new highs, QCOM remains locked in a narrow range around the $170 level. Last week, the stock initially reacted to the 23.60% retracement and now hovers near the edge of our blue Target Zone (coordinates: $159.57 to $121.52). Our primary expectation is for the blue wave (IV) to extend further below the support at $151.39, where we anticipate its low point. Technically, a direct breakout to the upside is also possible, as our Target Zone – and thus the minimum correction threshold – has already been reached. If the price decisively breaks above the resistance levels at $193.84, an overarching alternative wave count will come into play (probability: 33%).

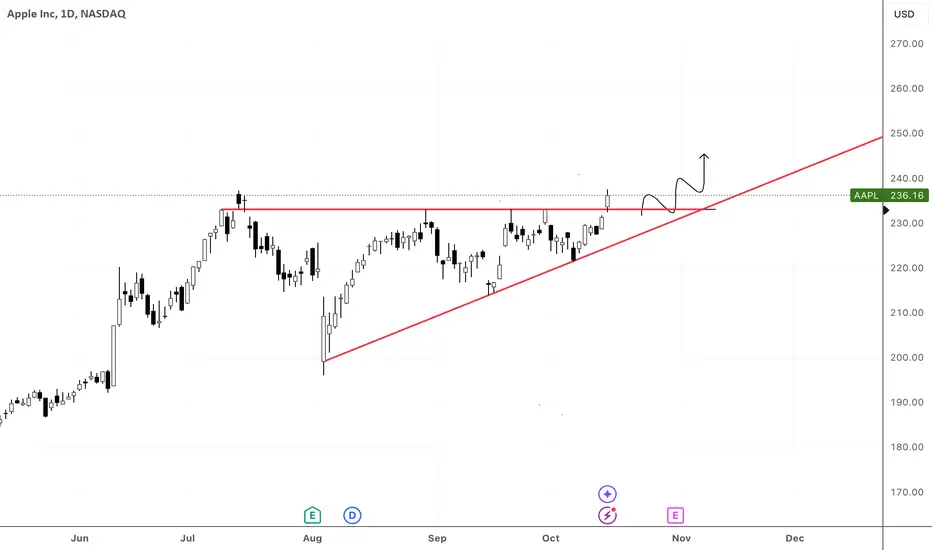
Apple - A Correction Is Actually Inevitable!Apple ( NASDAQ:AAPL ) is preparing for a minor cycle correction:
Click chart above to see the detailed analysis👆🏻
After creating five consecutive bullish breaks and retests of the previous all time high, it seems like Apple is one of these stocks which is perfectly following technical analysis. Considering that and the current rising channel pattern, it is quite likely that we will now see a short term correction.
Levels to watch: $190, $240
Keep your long term vision,
Philip (BasicTrading)

Zscaler: Wave (2) Correction! After a rapid rise in early September, the ZS stock managed to reach the highs from August, but there was no significant acceptance at this level. Structurally, the upward movement isn't sufficient for us to consider wave (2) as completed. So far, the bullish signals lack a clear impulsive character, and we expect new lows during the magenta wave (2), which should primarily end above the support at $84.93. Once a trend reversal has been initiated, the subsequent wave (3) should push through the resistance at $251.45. According to our 33% likely alternative scenario, this could also happen directly.

IBKR: BUY THE TECHY BROKERNASDAQ:IBKR reported strong results for Q3 2024, with adjusted earnings per share of $1.75, reflecting a 12.9% increase from the prior year, albeit slightly below the consensus estimate of $1.78. The company has shown significant growth in customer accounts and daily average revenue trades (DARTs), key drivers behind its performance.
After an initially negative reaction to the earnings report due to the slight miss and overall market trends, shares are stabilizing today. This creates a brief window for a long trade, allowing for a tight stop level to establish a very favorable risk-reward scenario.
Key Highlights Supporting Further Gains:
Total Revenue: $1.37 billion, up 19.2% year-over-year.
Customer Accounts: Grew 28.3% to 3,120,000 accounts.
DARTs: Increased 41.7% to 2.7 million, aligning with expectations.
Strong Capital Position: Cash and equivalents total $69.9 billion, with total assets of $148.5 billion.
Daily Technical Analysis Overview:
Oscillators:
RSI (14): 66.07 (Neutral)
Momentum (10): 4.72 (Buy)
Bull Bear Power: 2.08 (Buy)
Moving Averages:
EMA (10, 20, 50, 100, 200): All in "Buy."
SMA (10, 20, 50, 100, 200): All in "Buy."
Conclusion:
The robust capital position of Interactive Brokers, along with growth in accounts and DARTs, supports a positive outlook for the stock. Despite a slight increase in expenses, the fundamentals remain strong, justifying a buy recommendation. This is a great opportunity to capitalize on the current trend pause. If you'd like to discuss stop levels or have any questions, feel free to reach out!
🚀 Don’t miss this opportunity and follow me for more trading ideas!
Disclaimer: This analysis and recommendation are for informational purposes only and do not constitute financial advice. Always conduct your own research and consult with a financial advisor before making any investment decisions. Past performance is not indicative of future results. Investing in stocks involves risks, including the loss of principal.

The Apple Doesn't Fall From the Tree!!!! NASDAQ:AAPL is finally breaking out! We have broken above previous highs of $233.
Any retrace back to low $230's is a buy AS LONG AS we get a strong daily close above $233
Fiserv: Trading Opportunities!Recently, the FI stock surged directly into our green Target Zone (coordinates: $186.40 – $207.40). This year alone, it has gained over 40%. With the recent arrival in our Zone, the time is now ripe for an overarching trend reversal. Because: by hitting our Zone, the price has reached the absolute minimum target for the green wave . From a technical perspective, an immediate trend reversal and a transition into wave II are now possible. At the moment, we place Fiserv in the turquoise wave 3, which should be followed by another dip below our Target Zone. Ultimately, the entire turquoise upward impulse should complete the overarching uptrend of the beige wave I. Thus, our Zone can be used to take profits from existing long positions or to initiate new short trades. Such potential short positions can be hedged with a stop 1% above the 78.60% retracement level (at $207.40).

NDX Mega Rally Will Continue..Don't let the "fundamentals" mess with your head.. NDX has another 36% climb ahead of it, before it's next serious correction...
I called the bottom of this correction quite accurately (In fact, I called it but 4 days in advance to my predicted date it bottomed...
This is a text book bull flag with a measured move to the 161.8
Perfect technical structure..
Time to be long is now..
QE is coming back, rates are going to ease off, money will flow out of bonds and T-bills and back in risk assets, elections are coming up soon, war is raging and is sadly a cash machine for defence stocks, CPI lags and the market is going to pump in expectation of further inflationary pressures down the road..
AI is booming and is inherently deflationary..
The most upside I believe will be in any crypto related stock plays, as it's tech category + highest asymmetry..

HP to $60Overview
This is a very brief price prediction for HP that will require further review, however, I found the opportunity too affordable to pass up and wanted to share my thoughts. Bottom line: the call options are very cheap and HPQ's chart screams potential for a lucrative trade.
Trading Pattern
HP ( NYSE:HPQ ) has formed a bullish flag on the 1D chart and it appears close to breaking out as the descending wedge is completely developed.
Technical Indicators
MFI is approaching oversold territory while MACD has a sharp positive slope above its signal line.

Fiserv: Soon… ☺️Soon, Fiserv should reach the magenta colored zone between $134.09 and $140.81 and complete wave (B) in magenta – there is only little difference in altitude left. Once this top is placed, the share should turn downwards, heading for its next goal: the southern magenta colored zone between $108.96 and $89.26, where wave (C) in magenta and wave 4 in green should end. From there, wave 5 in green should carry Fiserv to the final top of wave I in gray, concluding an overarching upwards movement. There is a 33% chance, though, that the share could leave the next magenta zone on the upper side, developing wave alt.I in gray earlier already and thus cold-shouldering the magenta zone in the south.

IBM: Processing… 💻IBM is still processing wave b in red – the second step of a three part downwards movement, which should soon lead to the low of wave B in turquoise. As soon as wave B in turquoise is complete, the share should turn upwards to climb above the resistance at $139.47. There, IBM should conclude wave 2 in green before a significant downwards movement should take hold. However, there is a 35% chance that IBM could rise above $139.47 directly to develop a new top of wave alt.A in turquoise first before turning downwards again.

Snowflake: Gone with the Wind… 🌬(Un-)fortunately, we won’t rehash the story of Scarlett and Rhett, which took director Victor Fleming nearly 4 hours to recount. We will rather talk about Snowflake, which currently seems to be struggling though a snowstorm, fighting on toward the resistance at $203.62. We expect the share to gust above this mark to expand wave x in magenta before a counter movement should take hold. However, there is a 40% chance that wave alt.x in magenta could be finished by now. In that case, Snowflake would waft below the support at $110.27 to develop wave alt.2 in turquoise already, whose low should then be followed by a fresh upwards movement.

Block: In the starting blocks… 👟Block hast just finished wave B in turquoise and is in the starting blocks to take off. Soon, the share should gain enough upwards momentum to make it above the resistance at $89.97 and even further from there. However, there is a 39% chance that Block could break away and slip below the support at $51.16. In that case, the share should develop a new low in the form of wave alt.2 in green first before heading upwards. This new low would then be located in the magenta-colored zone between $40.97 and $19.12.
