GOLD A Fall Expected! SELL!
My dear subscribers,
This is my opinion on the GOLD next move:
The instrument tests an important psychological level 4078.3
Bias - Bearish
Technical Indicators: Supper Trend gives a precise Bearish signal, while Pivot Point HL predicts price changes and potential reversals in the market.
Target - 4050.7
My Stop Loss - 4094.1
About Used Indicators:
On the subsequent day, trading above the pivot point is thought to indicate ongoing bullish sentiment, while trading below the pivot point indicates bearish sentiment.
Disclosure: I am part of Trade Nation's Influencer program and receive a monthly fee for using their TradingView charts in my analysis.
———————————
WISH YOU ALL LUCK
Tecnicalanalysis

GBPCAD Will Collapse! SELL!
My dear friends,
Please, find my technical outlook for GBPCAD below:
The price is coiling around a solid key level - 1.8524
Bias - Bearish
Technical Indicators: Pivot Points High anticipates a potential price reversal.
Super trend shows a clear sell, giving a perfect indicators' convergence.
Goal - 1.8464
About Used Indicators:
The pivot point itself is simply the average of the high, low and closing prices from the previous trading day.
Disclosure: I am part of Trade Nation's Influencer program and receive a monthly fee for using their TradingView charts in my analysis.
———————————
WISH YOU ALL LUCK

EURGBP Set To Fall! SELL!
My dear subscribers,
My technical analysis for EURGBP is below:
The price is coiling around a solid key level - 0.8812
Bias - Bearish
Technical Indicators: Pivot Points High anticipates a potential price reversal.
Super trend shows a clear sell, giving a perfect indicators' convergence.
Goal - 0.8800
My Stop Loss - 0.8819
About Used Indicators:
By the very nature of the supertrend indicator, it offers firm support and resistance levels for traders to enter and exit trades. Additionally, it also provides signals for setting stop losses
Disclosure: I am part of Trade Nation's Influencer program and receive a monthly fee for using their TradingView charts in my analysis.
———————————
WISH YOU ALL LUCK

EURUSD Buyers In Panic! SELL!
My dear subscribers,
This is my opinion on the EURUSD next move:
The instrument tests an important psychological level 1.1552
Bias - Bearish
Technical Indicators: Supper Trend gives a precise Bearish signal, while Pivot Point HL predicts price changes and potential reversals in the market.
Target - 1.1510
About Used Indicators:
On the subsequent day, trading above the pivot point is thought to indicate ongoing bullish sentiment, while trading below the pivot point indicates bearish sentiment.
Disclosure: I am part of Trade Nation's Influencer program and receive a monthly fee for using their TradingView charts in my analysis.
———————————
WISH YOU ALL LUCK

LiamTrading – XAUUSD | Early Week Bullish Scenario...LiamTrading – XAUUSD | Early Week Bullish Scenario: Successful Breakout, Awaiting Retest at 4056 & Deep Buy at 3998–4000
The price has just broken out of the accumulation box and accelerated as per the weekend scenario. Bullish bias for the day, with a near-term target of 4080 → 4110; the 4110–4112 zone is a suitable psychological resistance for scalping. Prioritize buying at the 4056 retest or deep buying at 3998–4000 after a liquidity sweep and rebound.
The U.S. Senate takes further procedural steps to end the shutdown. Systemic risk expectations cool down → pressure on USD decreases, supporting gold in the short term.
The process has a few steps left, volatility around news hours can be sharp → adhere to technicals, manage risks tightly.
Technical Analysis (H1/H2) – Volume Profile • Trendline • S/R • Fibonacci
Structure & Trendline: Breakout upwards, trend-following capital dominates. Short-term uptrend as long as price holds above 4056 (retest point of breakout zone).
Support/Resistance (S/R):
Support: 4056 (retest), 4025–4038 (FVG filling liquidity), 3998–4000 (Buy Zone Liquidity).
Resistance: 4110–4112 (psychological + short-term supply cluster), 4160–4165 (Fibo extension).
Fibonacci Extension:
1.618 coincides with 4110–4112 → likely reaction/scalping.
2.272 targets ~4160 → extended target/final profit-taking.
Today's Trading Scenario
Continuation Buy (priority)
Entry: 4056–4060 (retest breakout zone)
SL: 4048
TP: 4080 → 4110 → 4160
Management: Move SL to breakeven at +1R; partial take at 4080/4110.
Deep Liquidity Buy (cautious volume)
Entry: 3998–4000
SL: 3992
TP: 4020 → 4045 → 4080 → 4110
Note: Enter only with clear rejection candle (long lower wick, M1–M15 reversal) or after FVG fill and rebound.
Scalp Sell at Psychological Resistance (counter-trend)
Entry: 4110–4112
SL: 4118
TP: 4100 → 4080 → 4065
Note: Cancel trade if H1 closes strongly above 4112 or if bullish momentum is too strong (breakout with volume).
Invalidation Conditions & Notes
Short-term bullish bias invalidated if H1 closes below 4048 → may test deeper 4025–4038 or 3998–4000.
Avoid entering trades close to news hours about the U.S. government reopening process.
Risk per trade: 0.5–1%, adhere to discipline of moving SL at +1R.
If you find this useful, comment on the price levels you're watching and hit Follow on LiamTrading for daily updates.

GBP/USD: Bullish Reversal Confirmed?!📈GBPUSD formed an inverted head and shoulders pattern on the 4-hour timeframe.
The breakout above its neckline serves as a strong bullish reversal signal.
The broken neckline of this pattern is now expected to act as a significant support level.
We anticipate a subsequent upward movement from this point, targeting at least the 1.3216 resistance level.

XAUUSD: Bullish Breakout Targeting High-Value Liquidity ($$$)Key Technical Observations
4H / FVG (Four-Hour Fair Value Gap): The price has recently moved into or is reacting to a Fair Value Gap (FVG), a concept often used in Inner Circle Trader (ICT) methodology. An FVG suggests an imbalance that the market often seeks to fill or utilize as support/resistance. In this context, the price moving out of this gap and continuing higher suggests it acted as a potential support or springboard for the latest move up.
Liquidity Targets ($$$): The analysis has clearly marked two higher levels as targets, labeled "$$$". These typically represent liquidity pools (e.g., clustered stop losses or pending orders) that the market is likely to move toward:
First Target: Approximately 4,080.00
Second Target: Approximately 4,100.00 - 4,110.00
Recent Price Action: The candles leading up to the current level are predominantly green (bullish), indicating strong buying momentum that broke past the recent consolidation highs.
Conclusion & Outlook
The analysis points toward a strong bullish bias. The break out of the consolidation range, potentially catalyzed by the FVG area, and the clear liquidity targets ($$$) above suggest the next move is likely to challenge the 4,080.00 and then the 4,100.00 price zones.

SPY: Forecast & Trading Plan
The analysis of the SPY chart clearly shows us that the pair is finally about to go up due to the rising pressure from the buyers.
❤️ Please, support our work with like & comment! ❤️

EURUSD Trading Opportunity! SELL!
My dear subscribers,
EURUSD looks like it will make a good move, and here are the details:
The market is trading on 1.1567 pivot level.
Bias - Bearish
Technical Indicators: Both Super Trend & Pivot HL indicate a highly probable Bearish continuation.
Target - 1.1523
About Used Indicators:
The average true range (ATR) plays an important role in 'Supertrend' as the indicator uses ATR to calculate its value. The ATR indicator signals the degree of price volatility.
Disclosure: I am part of Trade Nation's Influencer program and receive a monthly fee for using their TradingView charts in my analysis.
———————————
WISH YOU ALL LUCK

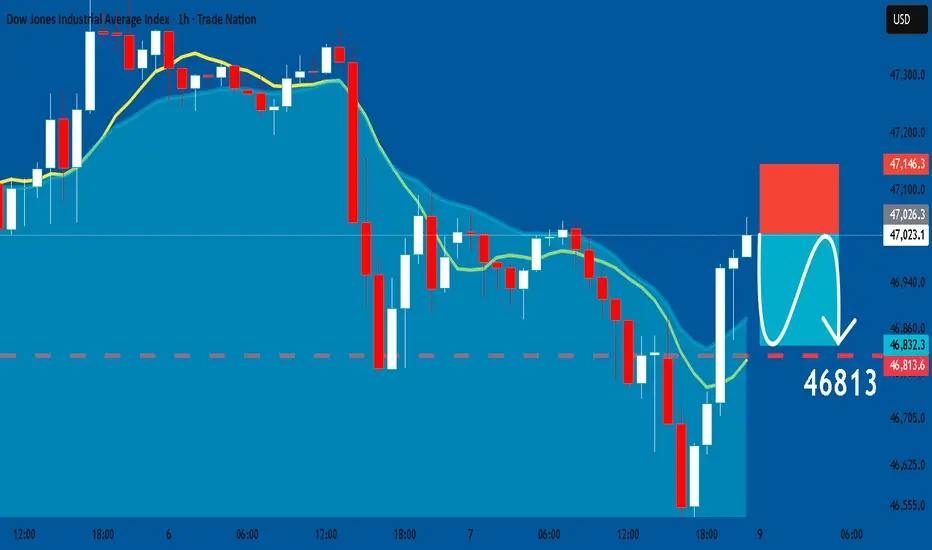
US30: Short Signal Explained
US30
- Classic bearish pattern
- Our team expects retracement
SUGGESTED TRADE:
Swing Trade
Sell US30
Entry - 47023
Stop - 47146
Take - 46813
Our Risk - 1%
Start protection of your profits from lower levels
Disclosure: I am part of Trade Nation's Influencer program and receive a monthly fee for using their TradingView charts in my analysis.
❤️ Please, support our work with like & comment! ❤️
SILVER: Bearish Continuation is Highly Probable! Here is Why:
Looking at the chart of SILVER right now we are seeing some interesting price action on the lower timeframes. Thus a local move down seems to be quite likely.
Disclosure: I am part of Trade Nation's Influencer program and receive a monthly fee for using their TradingView charts in my analysis.
❤️ Please, support our work with like & comment! ❤️

BTCUSD: Bearish Continuation & Short Signal
BTCUSD
- Classic bearish setup
- Our team expects bearish continuation
SUGGESTED TRADE:
Swing Trade
Short BTCUSD
Entry Point - 10376
Stop Loss - 10482
Take Profit - 10200
Our Risk - 1%
Start protection of your profits from lower levels
Disclosure: I am part of Trade Nation's Influencer program and receive a monthly fee for using their TradingView charts in my analysis.
❤️ Please, support our work with like & comment! ❤️

NATGAS Set To Grow! BUY!
My dear friends,
Please, find my technical outlook for NATGAS below:
The price is coiling around a solid key level - 4.324
Bias - Bullish
Technical Indicators: Pivot Points Low anticipates a potential price reversal.
Super trend shows a clear buy, giving a perfect indicators' convergence.
Goal - 4.368
Safe Stop Loss - 4.295
About Used Indicators:
The pivot point itself is simply the average of the high, low and closing prices from the previous trading day.
Disclosure: I am part of Trade Nation's Influencer program and receive a monthly fee for using their TradingView charts in my analysis.
———————————
WISH YOU ALL LUCK

QQQ Will Explode! BUY!
My dear followers,
This is my opinion on the QQQ next move:
The asset is approaching an important pivot point 609.75
Bias - Bullish
Technical Indicators: Supper Trend generates a clear long signal while Pivot Point HL is currently determining the overall Bullish trend of the market.
Goal - 622.40
About Used Indicators:
For more efficient signals, super-trend is used in combination with other indicators like Pivot Points.
Disclosure: I am part of Trade Nation's Influencer program and receive a monthly fee for using their TradingView charts in my analysis.
———————————
WISH YOU ALL LUCK

APPLE The Target Is UP! BUY!
My dear friends,
My technical analysis for APPLE is below:
The market is trading on 268.53 pivot level.
Bias - Bullish
Technical Indicators: Both Super Trend & Pivot HL indicate a highly probable Bullish continuation.
Target - 271.24
Recommended Stop Loss - 266.96
About Used Indicators:
A pivot point is a technical analysis indicator, or calculations, used to determine the overall trend of the market over different time frames.
Disclosure: I am part of Trade Nation's Influencer program and receive a monthly fee for using their TradingView charts in my analysis.
———————————
WISH YOU ALL LUCK

$META: LONG SIDE OPPORTUNITY NASDAQ:META : Although it may seem incredible, the head and shoulders pattern TARGET has been reached. The stock has lost 24% of its value since hitting an all-time high in early August. The 14-period RSI indicates clear oversold conditions. Friday's hammer candlestick, combined with significant volume, is signaling a potential long-side opportunity.

QQQ: Bulls Will Push Higher
Looking at the chart of QQQ right now we are seeing some interesting price action on the lower timeframes. Thus a local move up seems to be quite likely.
Disclosure: I am part of Trade Nation's Influencer program and receive a monthly fee for using their TradingView charts in my analysis.
❤️ Please, support our work with like & comment! ❤️

TESLA Sellers In Panic! BUY!
My dear subscribers,
My technical analysis for TESLA is below:
The price is coiling around a solid key level - 429.39
Bias - Bullish
Technical Indicators: Pivot Points Low anticipates a potential price reversal.
Super trend shows a clear buy, giving a perfect indicators' convergence.
Goal - 446.44
About Used Indicators:
By the very nature of the supertrend indicator, it offers firm support and resistance levels for traders to enter and exit trades. Additionally, it also provides signals for setting stop losses
Disclosure: I am part of Trade Nation's Influencer program and receive a monthly fee for using their TradingView charts in my analysis.
———————————
WISH YOU ALL LUCK

EURCHF: Long Trading Opportunity
EURCHF
- Classic bullish formation
- Our team expects pullback
SUGGESTED TRADE:
Swing Trade
Long EURCHF
Entry - 0.9315
Sl - 0.9312
Tp - 0.9321
Our Risk - 1%
Start protection of your profits from lower levels
Disclosure: I am part of Trade Nation's Influencer program and receive a monthly fee for using their TradingView charts in my analysis.
❤️ Please, support our work with like & comment! ❤️

EURUSD: Weak Market & Bearish Continuation
Remember that we can not, and should not impose our will on the market but rather listen to its whims and make profit by following it. And thus shall be done today on the EURUSD pair which is likely to be pushed down by the bears so we will sell!
Disclosure: I am part of Trade Nation's Influencer program and receive a monthly fee for using their TradingView charts in my analysis.
❤️ Please, support our work with like & comment! ❤️

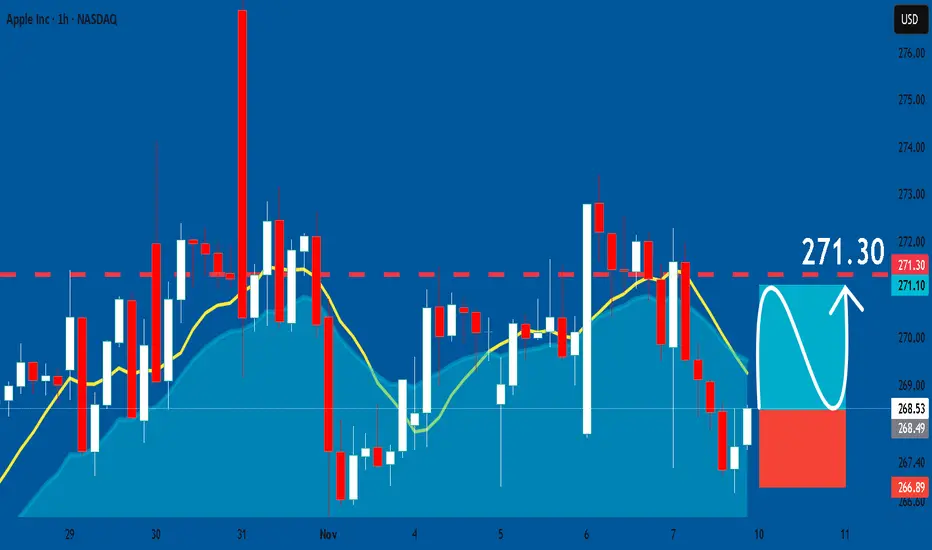
APPLE: Long Trade Explained
APPLE
- Classic bullish pattern
- Our team expects retracement
SUGGESTED TRADE:
Swing Trade
Buy APPLE
Entry - 268.53
Stop - 266.89
Take - 271.30
Our Risk - 1%
Start protection of your profits from lower levels
Disclosure: I am part of Trade Nation's Influencer program and receive a monthly fee for using their TradingView charts in my analysis.
❤️ Please, support
EURCAD Sellers In Panic! BUY!
My dear subscribers,
EURCAD looks like it will make a good move, and here are the details:
The market is trading on 1.6246 pivot level.
Bias - Bullish
My Stop Loss - 1.6231
Technical Indicators: Both Super Trend & Pivot HL indicate a highly probable Bullish continuation.
Target - 1.6272
About Used Indicators:
The average true range (ATR) plays an important role in 'Supertrend' as the indicator uses ATR to calculate its value. The ATR indicator signals the degree of price volatility.
Disclosure: I am part of Trade Nation's Influencer program and receive a monthly fee for using their TradingView charts in my analysis.
———————————
WISH YOU ALL LUCK

SPY Massive Long! BUY!
My dear followers,
I analysed this chart on SPY and concluded the following:
The market is trading on 670.89 pivot level.
Bias - Bullish
Technical Indicators: Both Super Trend & Pivot HL indicate a highly probable Bullish continuation.
Target - 678.65
About Used Indicators:
A super-trend indicator is plotted on either above or below the closing price to signal a buy or sell. The indicator changes color, based on whether or not you should be buying. If the super-trend indicator moves below the closing price, the indicator turns green, and it signals an entry point or points to buy.
Disclosure: I am part of Trade Nation's Influencer program and receive a monthly fee for using their TradingView charts in my analysis.
———————————
WISH YOU ALL LUCK
