QNT AWAKENED! Elliott Wave Analysis! Zoom into LTFs. Bullish!!4 hour TF shows QNT making good progress towards the 1st wave in teal. As shown in the image included with this post, we have recently finished a wave 4 running triangle correction to the downside. Next, wave 5 should press onwards, if my wave 5 extends beyond $106.82 / the red 1:1 fib ratio of wave 3, it will invalidate this leg of the impulse and i will have to rework the wave count on this 3rd wave in aqua green color.
Third

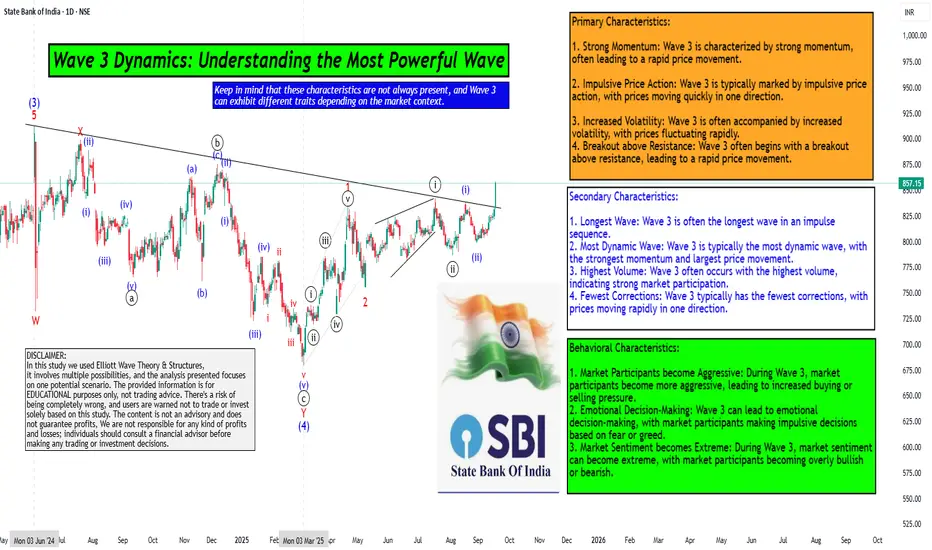
Wave 3 Dynamics: Understanding the Most Powerful WaveHello Friends, Welcome to RK_Chaarts,
For Learning and Practicing chart Analyzing, Today we are trying to Analyse the State Bank of India (SBIN) chart from an Elliott Wave perspective, we can see that the intermediate-degree Wave (3) completed at the June 2024 high. This was followed by a complex correction that ended at the March 2025 low, marking the completion of Wave (4).
We are currently unfolding Wave (5), which will complete the higher-degree Wave ((3)) of Primary degree in black. Within Wave (5), we have five minor-degree subdivisions, which we can see unfolding.
The first minor-degree Wave 1 completed at the 22nd April 2025 high, followed by a Wave 2 correction that ended at the May 9, 2025 low. We are currently in Wave 3, which is a dynamic wave with strong momentum.
Within Wave 3, we have five minute-degree subdivisions, which are unfolding. The first two subdivisions are complete, and we are currently in the third subdivision.
The characteristics of Wave ((iii)) of 3 are evident in the price action, with a strong breakout above the resistance trend line and good intensity of volumes. The Moving Convergence Divergence (MACD) is also positive, and the Relative Strength Index (RSI) is above 60, indicating strong momentum.
The daily Exponential moving averages (50 and 200) are also aligned in favor of the trend. All these parameters support our view, and we can see an inverted head-and-shoulders pattern or a double rounding bottom pattern unfolding.
Overall, the breakout looks promising, and we can expect further upside in SBIN as per Elliott wave theory.
Detailed wave counts on chart
Primary Characteristics:
1. Strong Momentum: Wave 3 is characterized by strong momentum, often leading to a rapid price movement.
2. Impulsive Price Action: Wave 3 is typically marked by impulsive price action, with prices moving quickly in one direction.
3. Increased Volatility: Wave 3 is often accompanied by increased volatility, with prices fluctuating rapidly.
4. Breakout above Resistance: Wave 3 often begins with a breakout above resistance, leading to a rapid price movement.
Secondary Characteristics:
1. Longest Wave: Wave 3 is often the longest wave in an impulse sequence.
2. Most Dynamic Wave: Wave 3 is typically the most dynamic wave, with the strongest momentum and largest price movement.
3. Highest Volume: Wave 3 often occurs with the highest volume, indicating strong market participation.
4. Fewest Corrections: Wave 3 typically has the fewest corrections, with prices moving rapidly in one direction.
Behavioral Characteristics:
1. Market Participants become Aggressive: During Wave 3, market participants become more aggressive, leading to increased buying or selling pressure.
2. Emotional Decision-Making: Wave 3 can lead to emotional decision-making, with market participants making impulsive decisions based on fear or greed.
3. Market Sentiment becomes Extreme: During Wave 3, market sentiment can become extreme, with market participants becoming overly bullish or bearish.
Keep in mind that these characteristics are not always present, and Wave 3 can exhibit different traits depending on the market context.
Here are some snapshots shared below to understand the concept & example
Largest wave among wave 1-3-5
Strong Momentum like 90 degree move, Vertical move, Rapid move & Dynamic move
Breakout with good volumes
Price trading above 50, 100 & 200 Day Exponential Moving Average
RSI Breakout on Daily
RSI Breakout on Weekly
MACD weekly
MACD Daily
Pattern Repeating
I am not Sebi registered analyst. My studies are for educational purpose only.
Please Consult your financial advisor before trading or investing.
I am not responsible for any kinds of your profits and your losses.
Most investors treat trading as a hobby because they have a full-time job doing something else.
However, If you treat trading like a business, it will pay you like a business.
If you treat like a hobby, hobbies don't pay, they cost you...!
Hope this post is helpful to community
Thanks
RK💕
Disclaimer and Risk Warning.
The analysis and discussion provided on in.tradingview.com is intended for educational purposes only and should not be relied upon for trading decisions. RK_Chaarts is not an investment adviser and the information provided here should not be taken as professional investment advice. Before buying or selling any investments, securities, or precious metals, it is recommended that you conduct your own due diligence. RK_Chaarts does not share in your profits and will not take responsibility for any losses you may incur. So Please Consult your financial advisor before trading or investing.
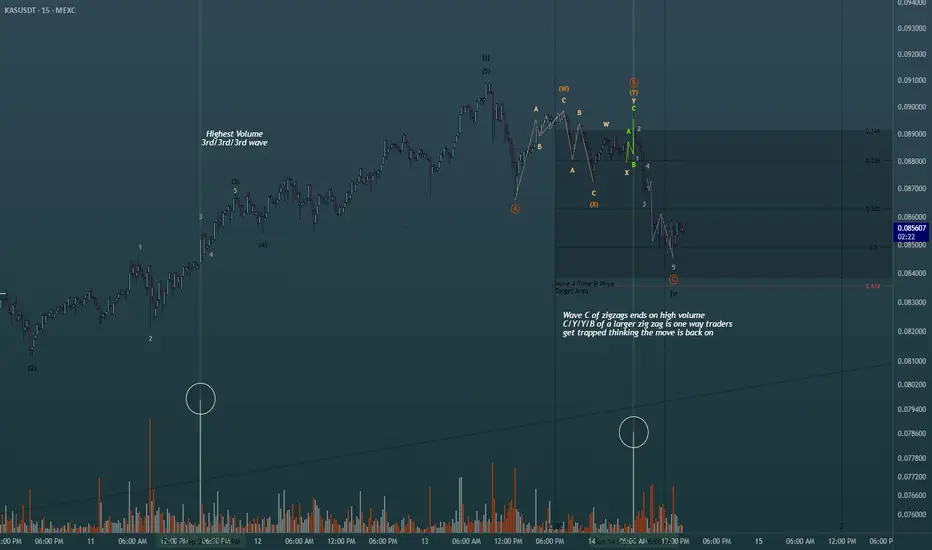
Using simple volume for added confluence in Elliott Wave Theory!Shown on the chart is 2 of the ways you can use the highest volume spikes on the chart to find out where you are in the wave count. Easiest way is to find the highest volume with the steepest slope of trend to label as your third wave. Same concept whether its bearish bars printing or bullish bars. The highest volume shown is actually part of the retracement, albeit in one of the actionary waves (moving with trend), alot of buying happened at the termination of the wave C of the zig zag shown in green. Perfect scenario to rake in buy orders from retail then dump on them to finish out the WXY pattern. This is just 2 of the many scenarios in which you can find help from the volume oscillator to give you a directional bias in Elliott Waves. Happy Trading
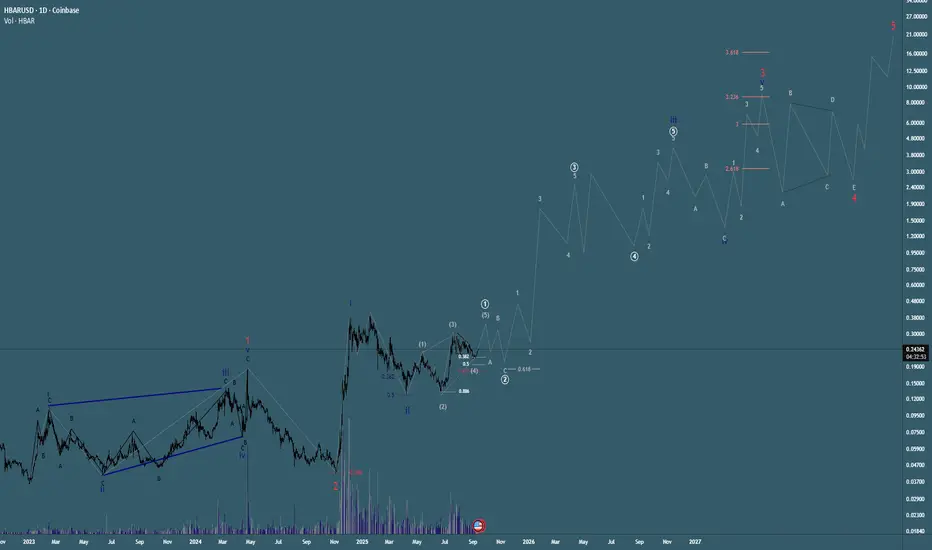
HTF Elliott Wave Count on HBAR! Super Bullish!!Here is the macro bullish outlook on HBAR using the Elliott Wave Theory. Currently we are making progress to the upside to complete the grey wave 5 to finish the leading diagonal in white. Next expect a retracement between .21 (extreme of wave 4) - .18 (.618 of diagonal), it could retrace deeper as is common with a wave 2, although the extreme bullish nature of this impulsive structure makes me think it could be a shallow retracement (38.2% - 50%) before blasting off on everyone looking for their entry to be hit. Exciting times ahead for HBAR i believe. Happy Trading
TAO triple 1,2 impulse to the upside!Super bullish pattern forming in this bullish scenario on TAO. HTF 1,2 in black finished with a deep retracement. Second 1,2 in light blue finished with a retracement to the 0.5. The third micro 1,2 in green finished with a deep retracement to .886 Fib. Since then we chopped around the bottom with our LTF lower degree 1,2 structures to form the base of the extended wave 3 thats coming (or here now!). It could be counted as such that this wave 3 has already formed its own double 1,2 structure which gives more confluence to a massive rally. Several alts are showing similar patterns. Is alt season yet? xD Happy Trading

BTC, very bullish outlookAs promised here is my interpretation of the Bitcoin chart using Elliot wave analysis.
The flag breakout is very close to the final confirmation with a break above 69400. We completed a first 1 - 2 setup at the 6th of September. The most likely case is, that we are in the third wave now, leading towards 80k, with a final target for this cycle around 88k.
If BTC will confirm this scenario tomorrow with a break above the mentioned 69400 level, there is no reason the test the flag again soon. First target is 73k to the the ATH.

Weak Pump to provoke Final Capitulation Wave?Looks like finishing a 3EW here at 3585. Follow-thru selling possible 10/03 but a lift from these LOTY is likely before lower imo.
Final dig down likely coming in October after a weak pump. Still room to drop, RSI above 30 even now. Then Happy Halloween!

How Low Will It Go Part DeuxPrior ABC Ideas closed for blowing through projected pivot; we're dealing with a monster here, not a garden variety correction.
Topping formation in Wyckoff distribution. Will sell like Hell, then bounce back into a lower high zone, then sell again... and again.
Looks impulsive. We clearly in Three not a C, which should've turned today.
Three typically = 1.62 x One, so likely headed to 4365 for pivot to Four.
NB: Three can extend up to 2.618 of One, although uncommon... watch and see.
Four will be ~ half as tall as Two by alternating EW rule, won't bounce very high and can't pass One.
Five can be ferocious, may extend up to 1.62 x One but is typically same length, although commonly it measures
.618% extension area of the first & third waves combined measured against the high in the fourth wave.
So to get Five need to see Four. This chart a wag and guess. It's goin pretty far south IMO. WOULD NOT JUMP IN BOTTOM FISHING YET!

RTY in (v) of (III), in sell zoneChart says all. Sell in the band between S/R. not advice, just an idea; GLTA!

Matic on it's 3rd leg of an Impulse?Love Matic, love catching a wave. Hopefully this newbie will ride it out and not wipe out!

Apple at its last stand. Third top completedApple at its last stand. Third top completed. Divergence pattern.


Buy $BTC below MA (moving averages), sell high for a profit. Buy $BTC below MA (moving averages), sell high for a profit. Buy Below, Sell High!

|wave5 of 3rd of a Third of a 3rd|elliotwave|WAVE3*UPDATED*LONG|As described, here is the updated chart of my 3rd in a 3rd in a 3rd of a single 5 wave motive wave from VDUMPS until now.
Notice the 1-2 1-2 1-2 beginning, requiring a concentric 4-5 4-5 4-5 finish.
Notice the degree of the 2 major corrections within the inner 3rd, the same degree. And then notice the containing wave 2 and wave 4 of the wave 3 in yellow, of the same degree again.

Nice bigger picture Corrective structure on AUDUSDLooking for another formation on lower TFs to take the advantage of some few percentages to the upside.
More sells will come over at the third bounce of the corrective structure.
On 15 Min TF the Flag continuation Pattern is broken, moving to the upside.

|wave5 of 3rd of a Third of a 3rd|elliotwave|WAVE3*UPDATED*LONG|As the title suggests, here is the updated chart of my third of a third of a third elliot wave hypothesis.
Expect a near vertical rally from todays low, as we are within a sub-wave3 of the first wave 5 having completed the larger degree wave 4 of the even larger wave 3.
Next will be consecutive wave 4 wave 5 wave 4 wave 5 of higher degrees to complete the entire pattern sometime this Spring.
Feel free to ask any questions.

Shift to 3 gears and speed upIt seems I figured out the turning point, the support zone in the last forecast in EURGBP, but more signs should come.
So the support zone held up the EURGBP, and more GBP weakening should come after the price break out upward from the rising channel(0.89 - 0.8950).
If the break would happen then I expect to seem a bigger momentum to go and reach 0.9250 - 0.95 or more.
Everything is alright with this view while EURGBP hold up 0.8765

EURJPY Analysiseurjpy has fresh demand zone below and also trendline third touch is about to happen. it might go up from the level shown

US 30 in ABC Correction? Road to ATH; in Handle of CupVolume lessens on rising prices, increases on downdrafts. RSI divergent. Small caps have reached .50 Fibo retrace off September's lower high.
SP500 and Dow have a gap to fill down to the 0.50 Fibo.
Three-day rally feels like a B wave, chaotic and widely fluctuant. If so, expect C wave down to the gapfill at the breakout point from Cup near 26300/SandP 2942.
A hedged short here is probably a fair R/R as EOM 'window-dressing' is likely to finish what seems to be a modest correction. The ABC is consistent with Intermediate Wave 2 of a Primary wave 3; markets should enter third-in-third wave on completion of the modest correction. A severe tankoff would invalidate this hypothesis!
IMO another major October downdraft is unlikely as these rarely happen two years in a row; but anything is possible in this mad market.
Taking a small short position on indexes with the gap up in AM on 9/27; this gap will very likely fill in day; first week of October is likely to be choppy.
Completing a corrective wave might coincide with positive trade news in Mid-October; if the outcome is disappointing expect a deeper selloff.
Still very chancy. Indicators to watch: RUT strong support at 1500 (IWM 150, now trading near 153); small caps have been a leading signal canary.
I'd close shorts with IWM at 150; DIA at 264; SPY at 294, if and when they get to these prices. An ABC complete wave could well provide launch point for next bullrun.
Longer-term still Bullish going into New Year, I'm not convinced this appearance of H&S in the monthly chart is really going to rollover. We shall see!
This isn't investment advice; just an idea, trade at your own risk; GLTA!

US Equities Alternative Bullish Hypothesis: In Primary EW 3?!Risk is terrific for both longs and shorts at this juncture; I am sidelined, patiently and prudently waiting.
In a previous idea I hypothesized a double bottom possibly in October. It is possible the markets are grinding out a near-term bottom at this consolidation zone now.
Markets hold tenaciously to this consolidation zone beneath ATH. The September pullback may be nothing more than an Intermediate wave 2 in a Primary Wave 3. We are near a Fibo retracement level off the Cup which seems to be supported, although support is illusionary and can break sharply and suddenly, making longs as risky as shorts.
Shorting is terrifically risky now, as delegates are in trade talks in China atm, as a single optimistic tweet could unleash coiled up Bullish energy at this level, possibly driving prices to new ATH in Nov/Dec and another mad January rally into a Primary Wave 5. Donald manipulates the financial markets, and he clearly needs it to be propped up to support his re-election campaign. Betting against the Donald has historically proven to be a poor risk.
Direction is highly uncertain at this point; it could break either way, but we saw in August after intense distribution the prices broke to upside. It is certainly possible the Bears have been ground out and equities are poised to move higher. October actually tends to be one of the more Bullish months on average, although most notable crashes and many corrections also have occurred at this time of year, giving it an undeserved bad rep; it is by no means a certain bet to expect another, after last year's savagery.
We do have a Cup and Handle clearly formed, and if this be truly the Handle, then the next move is continuation to upside, as depicted in this graph:
www.investopedia.com
I offer this idea as a precautionary tale to plungers; please FGS do not bet the farm on a further correction! I closed shorts today, as a massive rally could continue.
Any disappointment in global events will spark a selloff but optimism over trade could as easily drive prices to a new ATH. R/R is terrible now!
As always, this hypothesis is just another WAG, definitely NOT investment advice; trade at your own risk; GLTA!

I Spy A Fed Guy; Two Roads Diverge...Take Less Traveled?!Terrific rally to the 0.786 Fibo; looks like a slamdown at 290 today. We all expected a rally, but this one blew us away. Now we are back in the middle; higher prices but year. Pullback seems imminent; look carefully, however, you may find at least three similar Doji's that fooled us. Cautiously shorting in anticipation of trade and Fed combo worries leading up to FOMC meet next week. No guarantees in this game.
Two roads diverge at the meeting: a rate cut will trigger massive upside explosion and race to new ATH in July. EW theory suggests we may be in a 2nd of 5th wave, if so, a 3rd-of-5th would be terrifically bullish, a final blowoff meltup to cap the final surge of the Great Bull. These Elliot Waves are always and only clear in the Retrospectometer.
FOMC Disappointment... well, you know.
Trade at your own risk; GLTA!

OVERSTOCK COM INC DEL Stock analysisCompany: OVERSTOCK COM INC DEL
Quote:$OSTK
BT: $20 Second allocation will be between $10-$14 pending how the stock trades this month expecting to be a very bearish April for OSTK
ST: $40-$60 (A range nothing ever goes exactly to plan however we believe ultimately we can reach this high this year.)
Description: Overstock.com, Inc. operates as an online retailer in the United States. It operates in two segments, Direct and Partner. The company sells its products and services through its Internet Websites located at overstock.com, o.co, o.biz, and Pet Adoptions and Worldstock.com, as well as through third-party logistics providers to international customers. The company was formerly known as D2-Discounts Direct and changed its name to Overstock.com, Inc. in October 1999. Overstock.com, Inc. was founded in 1997 and is headquartered in Midvale, Utah.
Medici Ventures manages Overstock.com’s investments in firms building solutions leveraging and servicing blockchain technologies.
Launched in 2014, Medici Ventures is a wholly owned subsidiary of Overstock.com, Inc., created to manage and oversee the company’s investments in firms building solutions leveraging and servicing blockchain technologies. Medici Ventures has a growing portfolio of groundbreaking new companies and tech businesses.
Short Interest:
Short Percent of Float 68.36 %
Short % Increase / Decrease -4 %
Tapes last week: 1/5 More bearish and only going to get worse during this month

NZDUSD short setup, high probability trade. Third bounce. Lets see how this one plays off, high probability trading setup third bounce its in play whit 78.6% fib retrenchment perfectly align
