TMO | Continued stock growth- Timeframe: Weekly
- Trade type: Buy stop order
- Price: 622.91
- Take Profit: Open
- Stop Loss: 599.52 (-3.80 %)
Idea: Long on a breakout above last week's high - bullish momentum continuation.
Entry: Buy stop above last week’s high.
Stop-loss: Below the low of the same candle.
If the weekly candle closes below this level, the trade is invalidated.
Take Profit: Trailing stop following the lows of new weekly candles.
TMO
TMO Breaks Out of a Multi-Year Range. Is the All-Time High NextThermo Fisher Scientific is showing an important technical development on the weekly chart.
For several years, TMO traded inside a broad consolidation range between approximately $435 and $630. The stock has now closed at $651.45, clearly above the upper boundary of this structure.
The breakout is constructive, but one final resistance zone remains before the stock can enter price discovery.
Key levels:
- Former range resistance: $630–$635
- Immediate resistance: $660–$665
- All-time h
May 2, 2026 TMO. The time to go long has come?- Exchange: Bitget TradFi
- Instrument: TMOon
- Timeframe: Weekly
- Trade type: Buy stop order
- Price: 481.83
- Take Profit: Open
- Stop Loss: 461.00 (-4.30 %)
Idea: Long on a breakout above last week's high — bullish momentum continuation.
Entry: Buy stop above last week’s high.
Stop-loss: Below the low of the same candle. A pullback below this level invalidates the trade.
Take Profit: Trailing stop following the lows of new weekly candles.
This is not an individual investment recommendatio
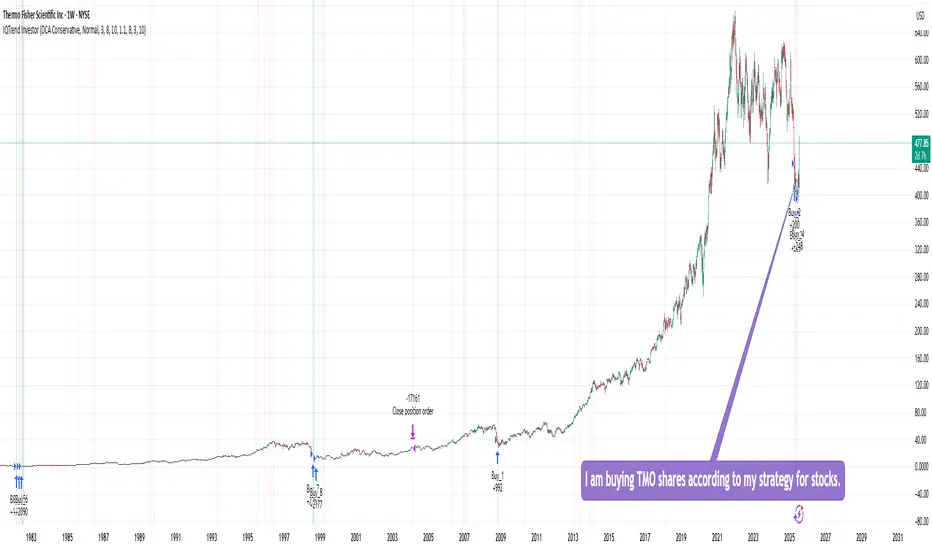
Buying TMO sharesI am buying TMO shares according to my strategy for stocks, ETFs, and precious metals.
This strategy shows 100% performance on this stock on a weekly timeframe. Therefore, I am investing a small percentage of my deposit in it and will wait for it to perform. I hope that everything will work out this time too :)
Of course, the price may go even lower, but I will buy more if the strategy shows a buy signal. In the long run, I think there will be an excellent profit.
DYOR
3 Oversold Stocks Poised for a Rally – MAS, IQV & TMOBelow is today’s SmartApingAI snapshot of three highly oversold names showing early signs of a rebound. Scroll down for a quick refresher on each company’s fundamentals, key technicals, and what makes them attractive at current levels.
1. Masco Corp ( NYSE:MAS )
What They Do:
Masco designs, manufactures and sells a broad range of home-improvement and new-construction products, including faucets, cabinets, hardware, coatings and architectural products.
Customers:
• Homeowners tackling re
MyMI Option Trades - TMO Potential CallsTMO just bounced off of their strongest Support Level since July 2021 which was once the stock's strongest resistance level. Once the stock surpassed that July 2021 Resistance Level, it quickly continued to ride to its All-Time Highs of $672.34.
Looking for potential long-term options on this as it's also at the bottom of its upward trend level that was formed since that July 2021 Breakout.
Looking like more pain in TSLA's futureIndicators used:
Democratic Fibonacci MAs
Consensus Tables (Oscillator Setting)
True Momentum Oscillator
The TSLA weekly charts (and those of lower time frames) look to be continuing the downward trend that the stock has faced over the last few months. The price has dropped below all 10 fib-length MAs (3 through 233) and the DFMA line closes in on the slowest of the fib MAs, indicating a strong bearish trend. The consensus tables (Oscillator is shown here) all agree that the negative trend will
Another Short on ThermoFischer. TMOThis is a doubling up on our earlier idea. See the linked idea.
We are not in the business of getting every prediction right, no one ever does and that is not the aim of the game. The Fibonacci targets are highlighted in purple with invalidation in red. Confirmation level, where relevant, is a pink dotted, finite line. Fibonacci goals, it is prudent to suggest, are nothing more than mere fractally evident and therefore statistically likely levels that the market will go to. Having said that, th
Descending Triangle on Thermo Fischer. TMODownward B Wave triangle is heralding a downward impulse. It may be larger than expected, given this is a downgoing triangle. Normally, triangle herald a relatively weak impulse post, but let's see how low this baby can go.
We are not in the business of getting every prediction right, no one ever does and that is not the aim of the game. The Fibonacci targets are highlighted in purple with invalidation in red. Confirmation level, where relevant, is a pink dotted, finite line. Fibonacci goals, i
Thermo Fisher descending lower and lower. TMOImmediate targets 510, 491. Invalidation 596,.
We are not in the business of getting every prediction right, no one ever does and that is not the aim of the game. The Fibonacci targets are highlighted in purple with invalidation in red. Fibonacci goals, it is prudent to suggest, are nothing more than mere fractally evident and therefore statistically likely levels that the market will go to. Having said that, the market will always do what it wants and always has a mind of its own. Therefore, n
TMO.NYS_Swim Trading VZ Breakout_LongENTRY: 638.38
SL: 595.45
TP1: 680
TP2: 700
- ADX<20. Would like to be higher.
- Maintaining at pivot point "P" and rebounded off strongly with volume today.
- Strength meter remains green indicating strength.
- Entry based on breakout from VZ today.
- Upward channel movement with its price currently at the bottom of the channel.
12/12/21 TMOThermo Fisher Scientific, Inc. ( NYSE:TMO )
Sector: Health Technology (Medical Specialties)
Current Price: $642.51
Breakout price: $646.00
Buy Zone (Top/Bottom Range): $624.00-$610.00
Price Target: $693.75-$696.00
Estimated Duration to Target: 80-88d
Contract of Interest: $TMO 3/18/22 650c
Trade price as of publish date: $30.80/contract
TMO: Buying around a 30% retracement.Good company judging by the company's performance and stock trend. Rolled back to the area 30% on the news about the vaccine Quarterly reporting will be February 2, 2021. If vaccination does not show significant benefits and the company's revenues continue to grow, it is possible that the shares will be bought back.
What do you think about the shares of this company?
TMO - Thermo Fisher - Daily Technical SetupTMO - Thermo Fisher - Daily Technical Setup
TMO
ENTRY = 450 - 455
Cost Avg Down = 420
1st Target = 485
2nd Target = 513
Hodl Target = New Highs
______________________________________________________________________________________________________________________
This content is for informational, educational and entertainment purposes only. This is not in any way, shape or form financial or trading advice.
Good luck, happy trading and stay chill,
2degreez
7 day scare windowThe vaccine stocks didn't explode this week as some of us holding the stocks were hoping for. Either the news was priced in for some stocks, or (as I believe is the case for TMO), it needs another catalyst to really jump back into its bullish channel (green channel -- which has a possible target of 530 - 560!)
I have updated the cycles for TMO and think it sits a bit better in the updated cycle analysis. TMO is in a tight wedge at the moment, but today or tomorrow should give some indication w
TMO - Bullish Price ActionTMO has broken through the 8, 13, and 21 daily exponential moving averages in the past few trading sessions. As a leader in laboratory diagnostics and life science sales distribution, it would seem reasonable that the stock may try to push higher as the coronavirus cases continue to grow. Now that the stock has pushed passed the 21 day EMA, there are no foreseeable areas of resistance for the stock and could make its way back up to recent highs nearing $530 per share. I would anticipate a slight
TMO to 560 by end of 2020?TMO has moved into slightly shorter cycle in November, which is not usually the ideal set up I like. But, this is a solid company and shows no reason to break down.
Based on the shorter cycle, I expect double-bottom to be formed roughly between December 1-4. Watch for the W.
TMO bounced off the 100MA and has formed a bullish sign with a dragonfly doji on Nov 27 trading session. This suggests it would likely run up to test 460, before a minor pullback possibly, and then bounce again off the 1