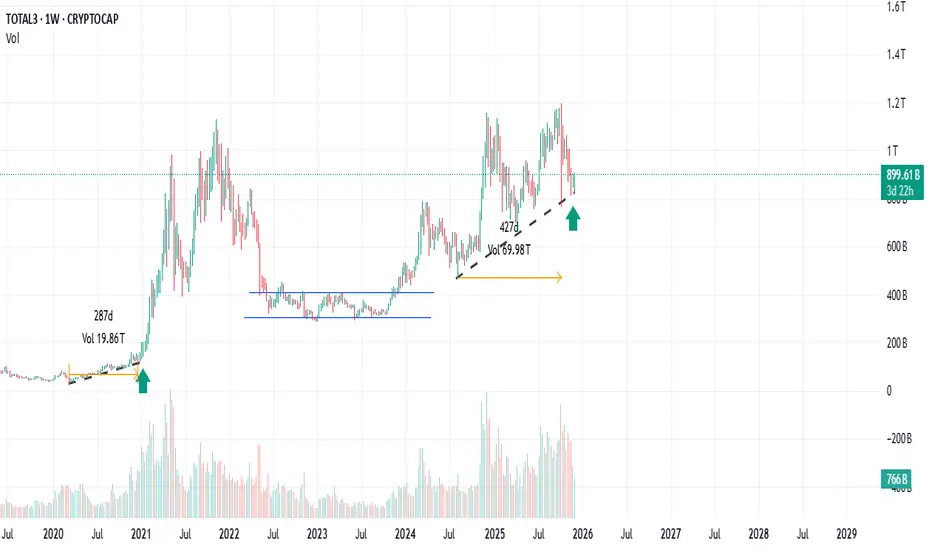
Altseasons start?CRYPTOCAP:TOTAL3 shows rejection on weekly candle horizontal trendline, could alt season be starting soon?
previously it started from the 2nd week of December, but at that time the halving had just started, is the halving theory no longer relevant now?
Total3marketcap
TOTAL 3 New Update (1D)It appears that wave G of Total 3 has completed, and the price has entered wave H. Wave H is expected to end within the green zone, after which we’ll move toward wave I.
For now, our outlook on Total 3 remains bearish, as the strong move a few days ago and the market crash indicate the formation of new corrective waves.
A daily candle closing above the invalidation level will invalidate this analysis.
For risk management, please don't forget stop loss and capital management
When we reach the first target, save some profit and then change the stop to entry
Comment if you have any questions
Thank You

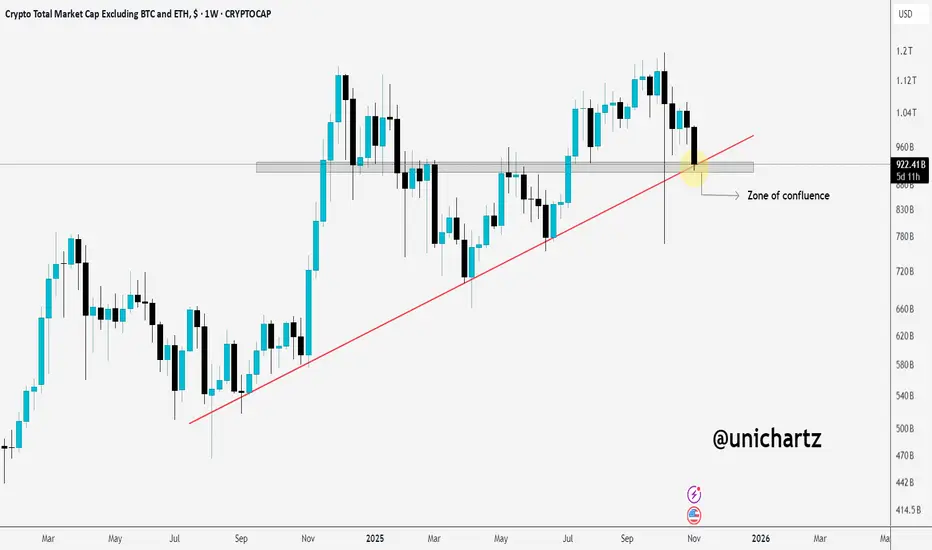
Altcoins at a Turning Point, Can Bulls Defend This Level?Altcoins are currently hovering at a critical zone of confluence, where horizontal support meets the rising trendline. A strong bounce from here could revive bullish momentum, but a breakdown below this level might open the door for deeper corrections.
This is a make-or-break area for the broader altcoin market.
Stay alert.
NFA
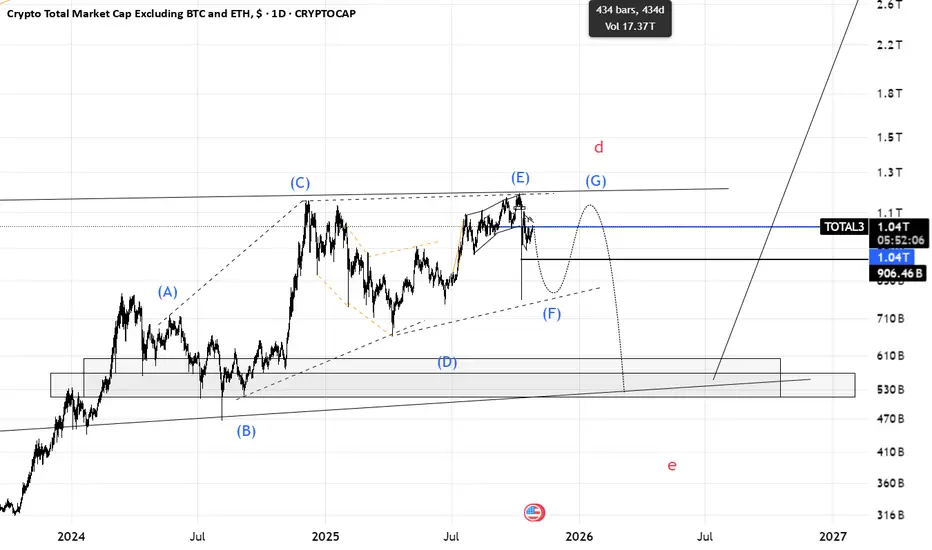
Total3(based on NEo wave)I think this branch is diametric. in last chart I thought its a triangle but its a diametric.
we should for wave F to finish and wave G to start then there is a heavy bearish wave for total3 and altcoins.
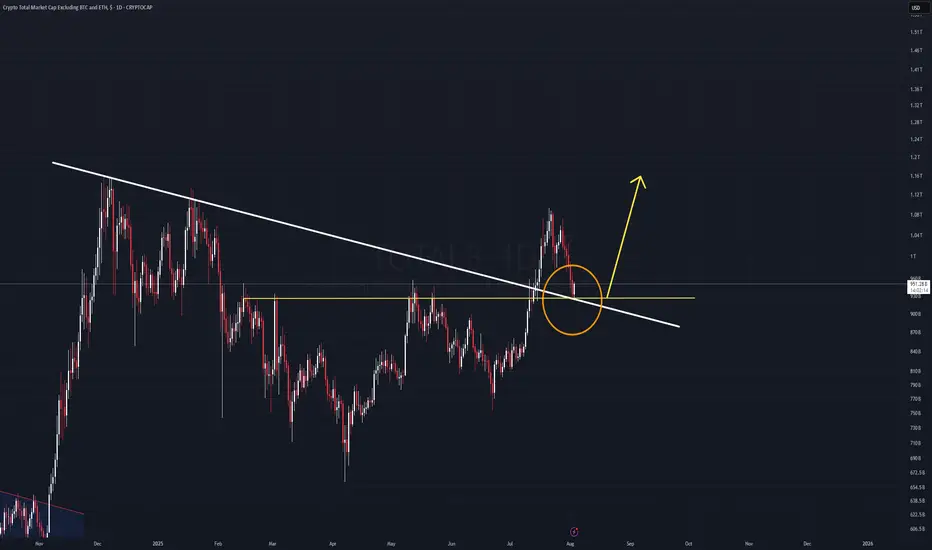
TOTAL 3 Analysis (1D)The TOTAL3 chart is currently retesting a key diagonal trendline that was broken previously. This is a classic bullish retest scenario.
If the current daily candle closes green, and is followed by a strong impulsive candle without invalidation, it could signal the start of a new leg upward, right from this zone.
The $900B market cap level remains the key support.
As long as TOTAL3 holds above this threshold, the bullish bias remains intact.
This structure could lead to momentum across the altcoin market.
Total3(based on NEo wave)I thought wave (e) is finised but I was wrong.
now I think its the start of wave (e) and we should afraid of altcoins.
when wave (e) is finished altcoins will start to pump.
every upward is a chance to sell.
there is another scenario that I will share it on next post.
TOTAL 3 UPDATE !!The TOTAL3 chart is showing some cautionary signs but has not yet broken the key trendline. The price is testing this support level, and a breakout below the trendline will be crucial for determining the next move. Currently, the price is holding above the trendline, but if we see a close below this level, it would signal further weakness in the altcoin market.
Key Levels to Watch:
> The trendline is still intact, but a 4-hour candle close below this could trigger downside pressure.
> The first major support sits around $1.09T. If the price reaches this level and reacts positively, we could see a bounce.
> The next potential support zone is at $1.07T, where more significant buying might come into play.
For now, we remain cautious and need confirmation through price action for any further moves down.
#Altcoins #CryptoTrading

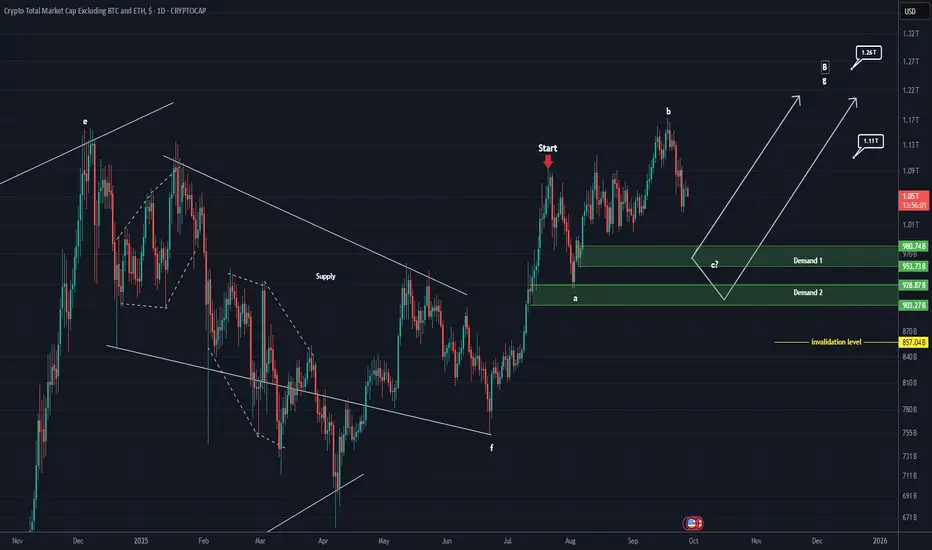
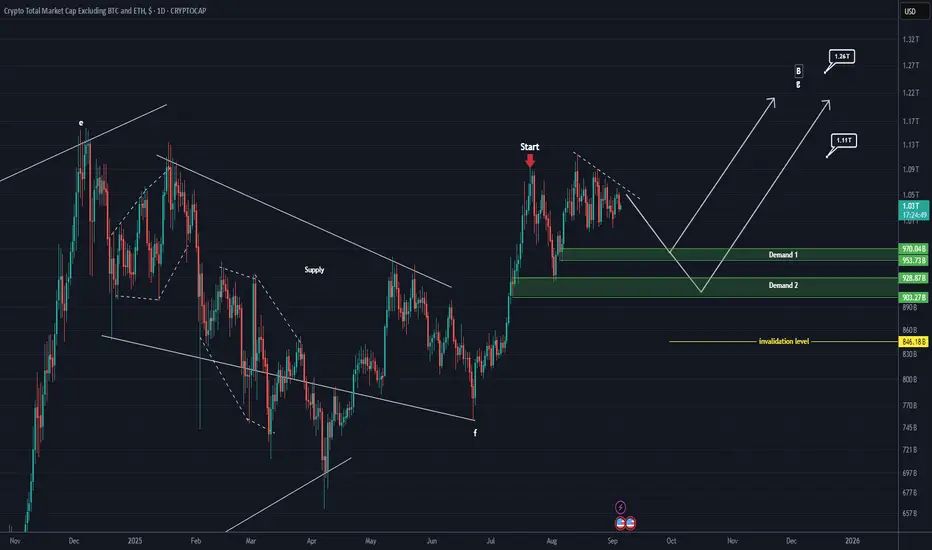
TOTAL 3 Update (1D)This analysis is an update of the analysis you see in the "Related publications" section
An upward move has been added to the previous analysis, and wave b has developed into three parts.
In our view, one more bearish wave c is still remaining, which could complete at Demand Zone 1 or Demand Zone 2. Up to the highlighted green areas, this index still looks bearish to us.
The demand zones in this analysis have been updated, and the invalidation level has also been revised.
Let’s wait and see what happens.
For risk management, please don't forget stop loss and capital management
When we reach the first target, save some profit and then change the stop to entry
Comment if you have any questions
Thank You
TOTAL3 – Altcoin Market Cap (Excluding BTC & ETH) Weekly TF 2025Summary
TOTAL3 is currently in a macro bullish cycle and undergoing a mid-cycle correction. The chart presents a Fibonacci-based structural roadmap with 3 Take Profit zones, identifying both correction supports and breakout targets. There is a high probability of short-term downside before a significant altcoin rally.
🌈 Chart Context
Fibonacci Retracement (Primary Leg):
100% = 285.3B
0% = 1.16T
Trend-Based Fibonacci Extension
A = 285.3B
B = 775B
C = 464.11B
Price as of analysis: ~845.62B
Key Technical Observations
Support Levels:
61.8% Fib Retracement = 618.5B
Strong Confluence Zone: Fib Retracement 48% + Fib Extension 50–61.8% (highlighted on chart)
38.2% Fib Retracement = 824.38B
Resistance Levels:
951.73B: 23.6% Retracement + 100% Extension – strong resistance zone before $1T psychological level
Take Profit Zones:
1 TP (1.1T) = 127% Fib Extension (Upper leg of parallel extension)
2 TP (1.28T) = 161.8% Fib Extension
3 TP (1.7T) = -61.8% Fib Retracement and 261.8% Extension confluence zone
Pattern & Projection:
The structure suggests a possible correction phase to lower support before continuation.
Bullish continuation expected after corrective phase, shown by the projected dotted path.
Structure: Bullish structure with healthy correction in mid-phase of the macro uptrend.
Fundamental Context
Altcoin Lag: TOTAL3 remains ~40% below its ATH, while BTC and ETH have already hit new highs.
Liquidity Shift Expected: Altcoin capital rotation tends to follow after BTC dominance stabilizes or drops.
Macro Backdrop:
Fed expected to cut rates later in 2025
Stablecoin legislation and ETF narratives building altcoin trust
Institutional inflows are slowly diversifying from BTC to ETH and large-cap alts
These suggest a possible shakeout or deeper correction before altseason breakout gains strength.
Bias & Strategy Implication:
Bias: Bullish Mid-Term – Correction Before Continuation
Expected Scenario: Pullback to strong support zones (824B–733B–618B), followed by a sustained breakout toward 1.1T–1.7T.
Invalidation: Weekly close below 618B may delay bullish structure and extend correction.
Strategy:
Long entries at support zones with tight invalidation
Scaling out near TP1, TP2, TP3 based on market momentum
Philosophical View
Patience is the virtue of the second leg in a macro trend. The correction serves to eject the impatient, reprice risk, and strengthen conviction. When TOTAL3 rises from deep support, it will be not just price but confidence that rallies.
Related Reference Charts
TOTAL Market Cap Structural Breakout:
TOTAL2 Altcoin Chart with Fibonacci Path:
✅ Tags
#TOTAL3 #AltcoinMarket #Fibonacci #Altseason #CryptoCorrection #CryptoMacro #TechnicalAnalysis #BullishOutlook #MidCycleCorrection #Crypto2025
⚠️ Notes & Disclaimers
This analysis is educational and not financial advice. Markets are inherently risky. Do your own research and manage risk accordingly.

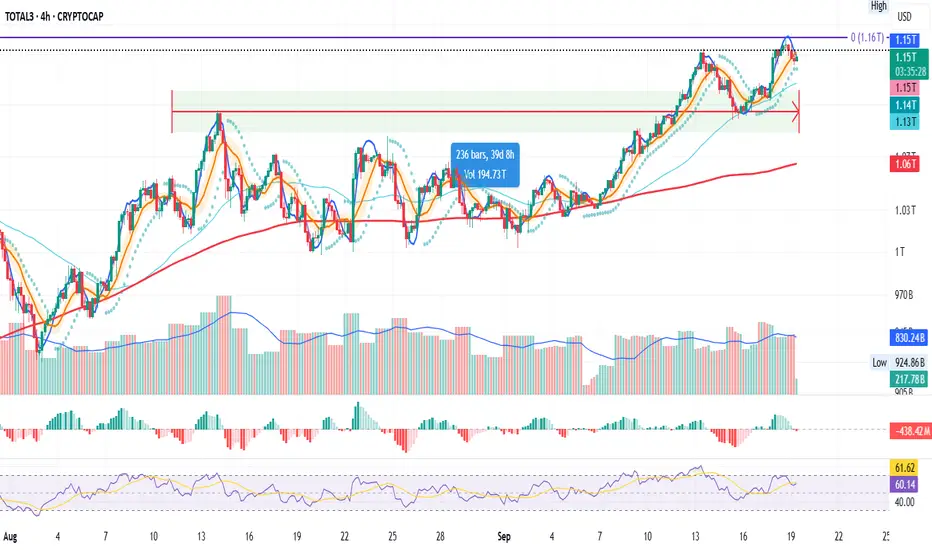
ETH SERIES | Part 6 – TOTAL3 (4H)
Last 40 days:
TOTAL3 is the strongest chart in this series.
Just printed a new ATH at 1.16T yesterday.
Structure is clean: higher highs + higher lows.
All previous episodes now point to the same conclusion → altcoins are setting up for a powerful push.
Final stop → BTC.D to see if Bitcoin dominance agrees with this scenario.
Always take profits and manage risk.
Interaction is welcome.
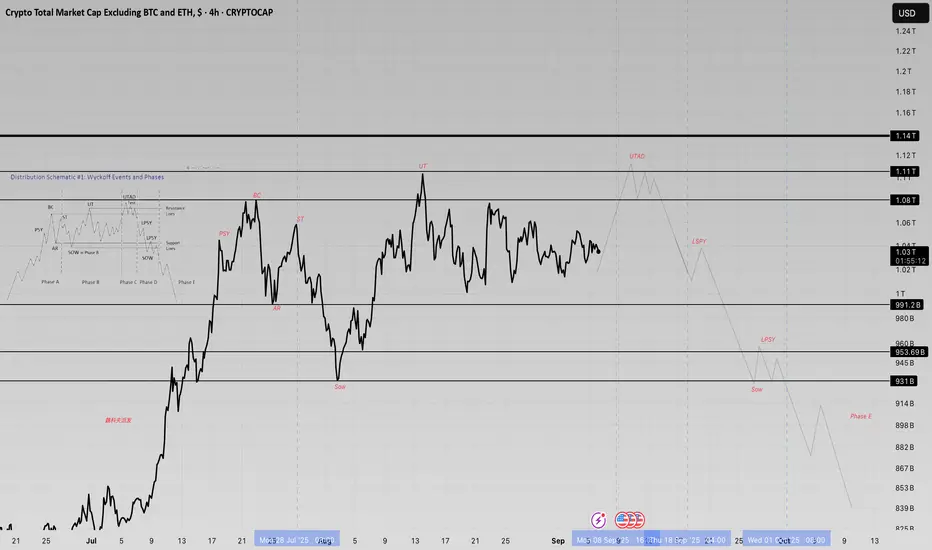
The Anatomy of a Trap: Total 3Chart, Wyckoff DistributionPrice action is beginning to show characteristics often associated with distribution. Multiple retests of resistance with waning momentum could be a sign of absorption rather than genuine strength. If this pattern develops further, the next move may involve a deceptive breakout attempt before revealing the market’s true direction.”
TOTAL 3 New Update (1D)As you know, capital first flows into Bitcoin, then into Ethereum, and afterward into other altcoins. This index serves as a good indicator to understand when altcoins, apart from Ethereum, will turn bullish.
It seems that one more corrective wave remains in this index, which could complete within one of the green zones. After that, we expect to see another bullish wave.
The targets are marked on the chart.
A daily candle close below the invalidation level will nullify this analysis.
For risk management, please don't forget stop loss and capital management
When we reach the first target, save some profit and then change the stop to entry
Comment if you have any questions
Thank You
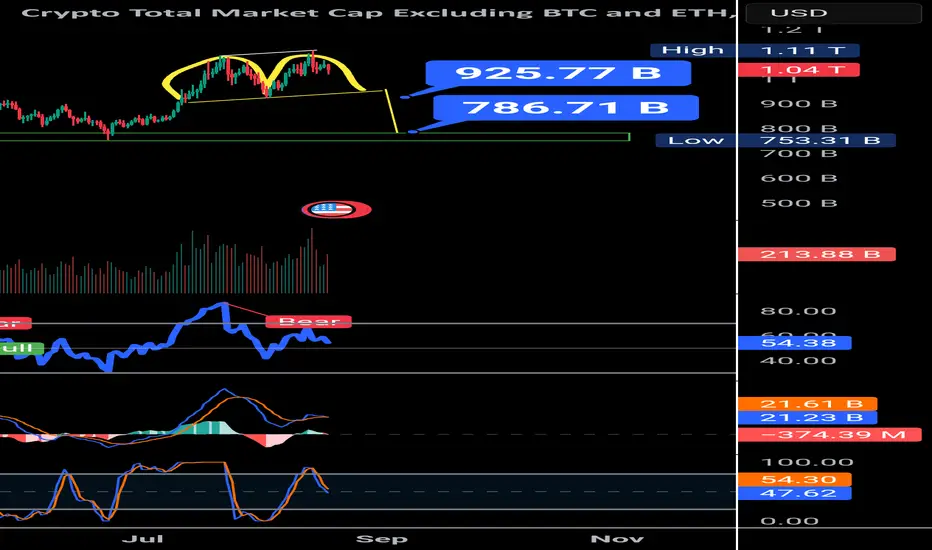
TOTAL3 double top with bearish divergenceThe TOTAL3 (altcoin market cap excluding BTC & ETH) has now climbed back to the $1T zone, almost testing its previous highs. But if we look closer, the chart is flashing a clear bearish divergence alongside a double top (M-pattern) structure.
Here’s the key takeaway:
If the pattern plays out, 950B support becomes the crucial line to watch.
A bounce at 950B could just be a healthy correction from the bearish divergence.
But if 950B breaks, the next strong support sits near 786B.
That zone could open doors for fresh altcoin accumulation opportunities. On the other hand, for those already holding, this level can also be considered a final profit-taking area before a deeper correction sets in.
Overall, the chart suggests the altcoin market is due for correction, especially with Bitcoin dominance on the rise. Patience and risk management are key here.
TOTAL 3 New Update (12H)This analysis is an update of the analysis you see in the "Related publications" section
This index has broken below the red zone; if a pullback to this area occurs, it may act as support again and the index could move upward
For risk management, please don't forget stop loss and capital management
Comment if you have any questions
Thank You
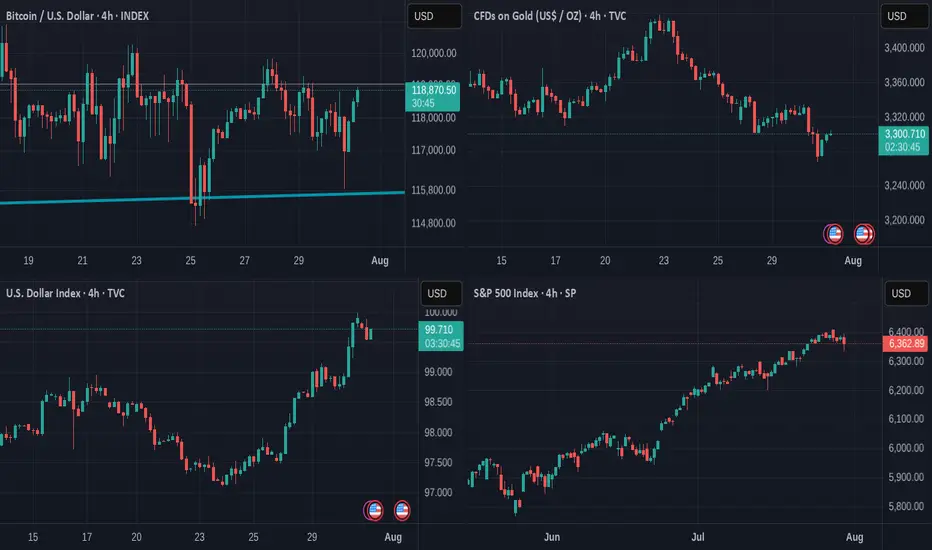
Has Bitcoin become a "SAFE" asset ? These charts show that......
After we heard the US Federal Reserve hold rates yesterday, Markets Fell some.
And Bitcoin joined them for a couple of hours but Look now.
While the $ falls, the S&P Falls, GOLD is the traditional haven of safety and we can see how it Rose in Value over the last 12 hours
The $ has Fallen over the last 8 hours
S&P Stalled for the last 24 hours
And the STRONGEST positive moves over the last 12 hours were from BITCOIN rising, though it is taking a breather for the moment.
SO, has it become a SAFE HAVEN ?
Put it like this. Bitcoin has NOT lost value like it used to when under pressure.
We have yet to see what would happen once it reaches its cycle Top. Will it retreat as it has historicaly...
But for now, it does seem to be a strong store of Value and remains with potential and likelihood of further rises.
The TOTAL CRYPTO MARKET CAP chart below
This shows us that the investor market seems Very confident in the Crypto Market,,Just going from strength to strength.
The TOTAL 2 Market Cap chart shows us something very interesting.
The TOTAL2 chart is the Total Market Cap MINUS BITCOIN
Compare the 2 charts and you will see how the TOTAL chart has risen way over its previous cycle ATH but the TOTAL2 is currently being rejected off its previous ATH line.
This clearly shows us that BITCOIN is the strength in the Crypto Market.
It is the same story on the TOTAL3 chart ( TOTAL minus BTC & ETH )
It is the same on the OTHERS chart ( Top 125 coins minus top 10 by market Cap )
BITCOIN CARRIES THE MARKET
These are early days but the Future of Bitcoin does seem VERY good
So far this cycle, the largest retrace was -31%
This drop was NOT a sharp Drop over a short period of time. It was an expected and controlled drop over 112 days.
But the zoomed out version of that chart tells us something VERY GOOD
PA has risen above and Tested and held that line of resistance that had rejected PA at Cycle Top ATH in 2017 and 2021.
That is a HUGE move and we wait to see if we Hold and move higher away from this line.
SO, Is Bitcoin a Safe Haven ?
It is certainly looking more and more like it.
PA is secure, has held position well and is in Price discovery...slowly and with caution...but always moving forward.
The traditional 4 yeat Cycle would end in late Q4 this year and so we have to wait and see what happens then.
But Bitcoin PA has moved into New ground on so many fronts now.
The traditinal BEAR market may not appear, in which case, YES, Bitcoin could become a New SAFE HAVEN
Buy Bitcoin
Hold Bitcoin
TOTAL3 exc BTCÐTOTAL3 is at the all-time high again and pushing to break that.
according to previous cycles the 1.414% of Fibonacci retracement at $1.98T is the top & timing of before the end of November 2025

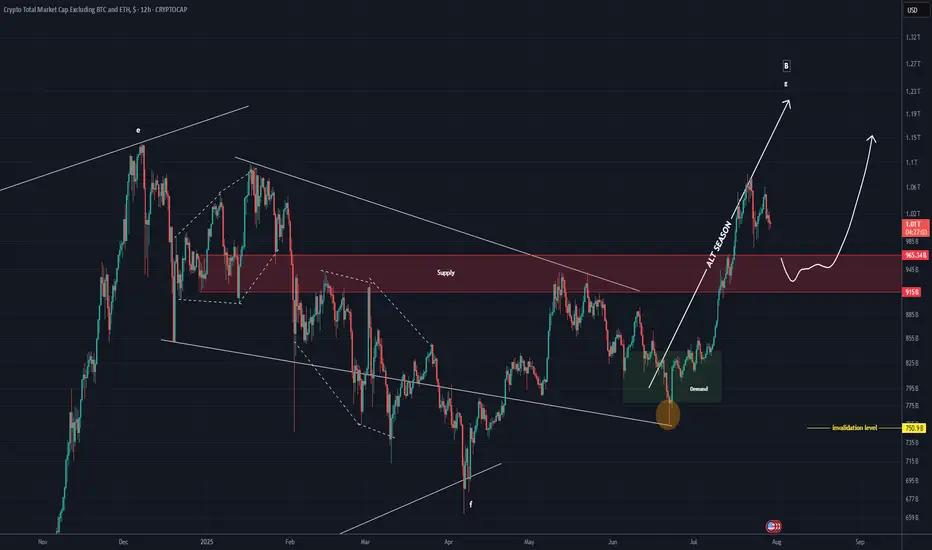
TOTAL 3 New Update (12H)This analysis is an update of the analysis you see in the "Related publications" section
TOTAL3 refers to the total crypto market cap excluding Bitcoin and Ethereum.
It pumped from the lower demand zone to the marked red box and has surged by 21%.
We now need a retracement to make the price more attractive.
If the invalidation level and the green zone hold, we could witness another bullish wave.
In this analysis, the invalidation level has been updated. A daily candle closing below this level will invalidate the setup.
Some altcoins are currently bullish, and each chart must be analyzed individually| so be cautious with your short positions.
For risk management, please don't forget stop loss and capital management
Comment if you have any questions
Thank You
USDT dominance chart!The chart shows USDT.D (Tether dominance) moving within a descending channel.
Currently, USDT.D is testing the upper resistance of the channel, around 4.65%.
If the dominance gets rejected at this level, the next potential target is the lower channel support around 3.9-4.0%.
This could indicate a risk-off environment where traders move capital from stablecoins (USDT) to more volatile assets like Bitcoin or altcoins.
The 50 and 200 moving averages provide dynamic resistance levels that support this potential downside move.
Thanks for your support!
DYOR. NFA

TOTAL3 ROADMAPMy scenario is like this.
* The purpose of my graphic drawings is purely educational.
* What i write here is not an investment advice. Please do your own research before investing in any asset.
* Never take my personal opinions as investment advice, you may lose your money.

TOTAL3 Update: Potential Recovery on the Daily ChartLooking at TOTAL3 on the daily:
Yesterday, we saw a wick below the 200MA, but the price managed to close above it by the end of the day—a good sign for recovery. 🔄
Although the MLR < SMA < BB Center isn't ideal, we continue to monitor price action in relation to the 200MA. If we close above it again today, things might start to turn positive. 🌱
⚠️ Keep an eye on macro news and hope for no more downgrades from agencies like Moody’s.
Thanks for reading! Stay safe and manage your risk. 📊

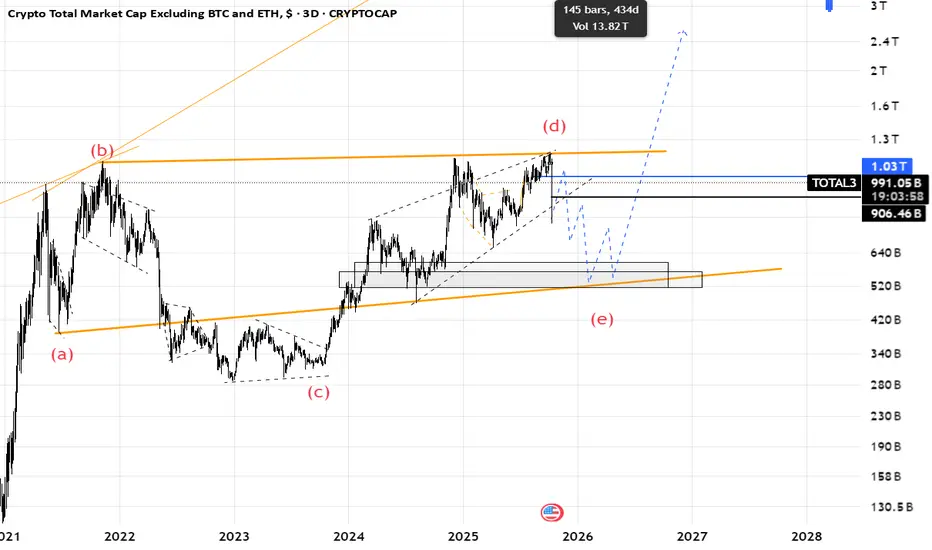
TOTAL 3 ROADMAP (3D)This analysis is an update of the analysis you see in the "Related publications" section
TOTAL3 refers to the total crypto market cap excluding Bitcoin and Ethereum.
If we zoom out and observe what altcoins are doing, we might gain better control over the market.
We know that in the past few days, there have been heavy pump-and-dump moves that have hunted liquidity.
From the point where we placed the red arrow, it appears that a correction in TOTAL3 has begun. This correction seems to be forming a flat pattern, and we are currently in wave B of that flat. Wave B itself appears to be a diagonal (diametric), and we are now in wave F of it.
The triangle from the previous analysis is actually the triangle of wave F, and altcoins have turned red as they are likely in wave e of this triangle.
Wave g of B is expected to start soon (from the green zone), and a bullish rally could follow.
After this rally, price may enter a deeper correction equal in size to wave A, forming a large wave C | a move that could take over 423 days to complete.
This seems to be the roadmap for TOTAL3.
For risk management, please don't forget stop loss and capital management
Comment if you have any questions
Thank You

Altcoin Market Holding Strong – Breakout on the Horizon!📈🚀 Altcoin Market Holding Strong – Breakout on the Horizon! 🌈📊
Hey Traders!
The altcoin market is gearing up for a powerful breakout! TOTAL3 (the altcoin market cap excluding BTC and ETH) is holding perfectly above the critical $893B support zone. This is exactly the kind of price action we expect before major upside explosions!
📊 Key Levels to Watch:
📍 Support Holding Strong: $893B – Bulls are defending this level with conviction.
🚀 Breakout Zone: A clear move above $900B sets the stage for a rapid surge toward $1.13 Trillion, a potential +25% rally!
✅ The structure is bullish, momentum is building, and the charts don’t lie—this market wants higher!
📚 Why This Time Feels Different:
BTC dominance is struggling at resistance—this is the perfect environment for altcoins to shine! 🌟
Real crypto projects are finally starting to show strength amid all the meme coin noise.
We’ve seen this setup before… and it led to explosive alt rallies. History may not repeat perfectly, but it sure loves to rhyme! 🎯
💬 Your Next Move:
Are you already positioned for this altseason breakout, or planning your entries now?
Which altcoins are you most bullish on for this run to $1.13T and beyond?
This is the moment serious traders wait for—don’t let it slip by! The market is loading the rocket… will you be on it when it takes off? 🚀
One Love,
The FXPROFESSOR 💙

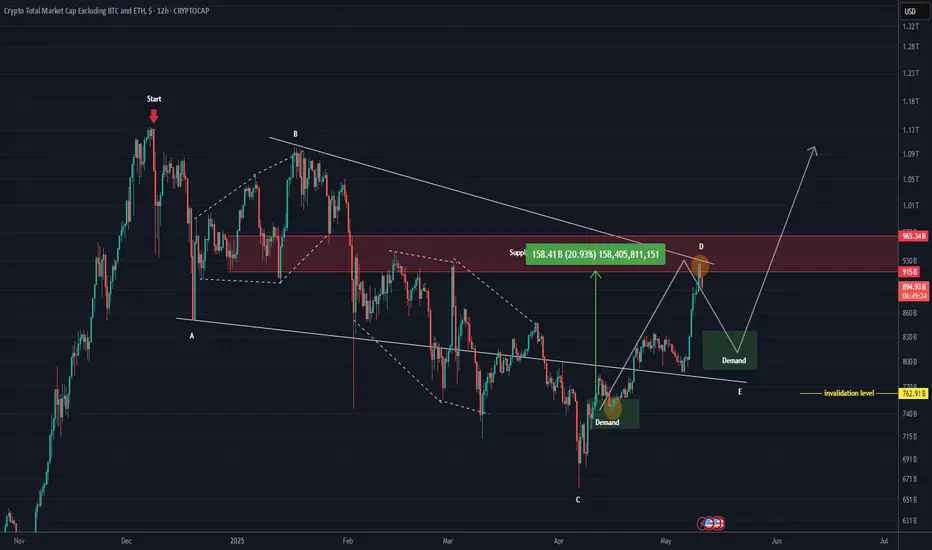
TOTAL3 Set to Explode: Altcoin Season Incoming? (12H)TOTAL3 refers to the total crypto market cap excluding Bitcoin and Ethereum.
The correction of TOTAL3 started from the point where we placed the red arrow on the chart.
It seems to have formed a triangle, and wave C now appears to be complete.
As long as the demand zone holds, it can move up toward the supply box and complete wave D.
After hitting the red box, a drop is expected for wave E — followed by the main bullish move.
Altcoins seem ready for a strong move; let’s see how it plays out.
A weekly candle close below the invalidation level will invalidate this analysis.
For risk management, please don't forget stop loss and capital management
When we reach the first target, save some profit and then change the stop to entry
Comment if you have any questions
Thank You
