Coin Citadel CCTL Projections This is an update of a chart I previously did on 02/17/21. As we see the pattern has held the "future supports" I had mapped out and should continue into my target zone. Once we break the previous ATH we will higher growth and I will continue to post on this stock.
Please like and follow!
Thanks
Tothemoon


BTC go to 60k before crash ?It seems that this prediction seems realistic regarding Eliot waves and Fibo extension. 60k could be a critical point.
Let's see if Mcafee will keeps its nuts 😜

45% swing incomingIf there is not a trend break for NIO in the next few days, this thing will likely have a massive run-up to 80$. CCIV or Lucid is currently trading at around 57$, making Lucid a 57*1,2 = 68,4 billion dollar company, as a direct competitor to NIO. However, NIO is far ahead, and their vehicle deliveries might hit 100k this year. NIO's current evaluation is LOW compared to Lucid, whom will likely go even higher on a 100% confirmed merger deal. NIO is in the background becoming more and more attractive as a swing trade or just a great entry for long-term holds. Keep this high on your watchlists!

for me vib is definitely lookinG ReAdY for shootinG up !! Since some time we saw VIB making like 500% gains ,,, it's an awesome promessing project but for me as shown on the chart it's a 100% pump coin that could do an astronomical terrifying GainS !!
-->Next BiG target is around the 378-398 SATs Guys ,, you can buy a little bag (maximum 10%-15% of your capital) to expect like 150% tastY Gains
PS : midterm Trade ,,, So be a little patient guys ,,, and whatever happening with the big DAD (BTC) VIB will smash those 378-403 potential targets
PS : Am not your financial adviser those are MY OWN PERSONAL THOUGHTS ,,, I Just Love sharing with you guys my PERSONAL TRADES
PS : Do not but badly Greedy !!! (this is golden advice)

$ZOM Chart patterns. Potential breakoutThis is my prediction of the next uptrend towards Truforma's launch date. The first device from Zomedica.
$ZOM is currently in an aggressive upward trend and is likely to continue in this trend. Why? Because you can see in the chart above that $ZOM is currently in its next consolidation just like it was in January.
During the making of this post the price has fallen below the resistance. This was also the case in January, but it was immediately corrected the next day (false outbreak).
Also the RSI also reveals the new uptrends.
Ultimately, I think the idea is that $ZOM will go to $8 and stay there in the next consolidation until they make revenue for the first time.
I know that a stock price of $8 entails a huge market cap. But because of the hype of Truforma investors first condone that.
I would like to hear feedback from you guys and what you think will happen to the stock in the near future!

i do beleive that lit will get to the 19.70 to 21busd price taG I do believe that lit will get to the 19.70 busd price tag within 1-2 weeks ,,, very bullish in that particular sturdy project ,,, keep an Eye on that project guy I see a 41-53% tradinG opportunity !!


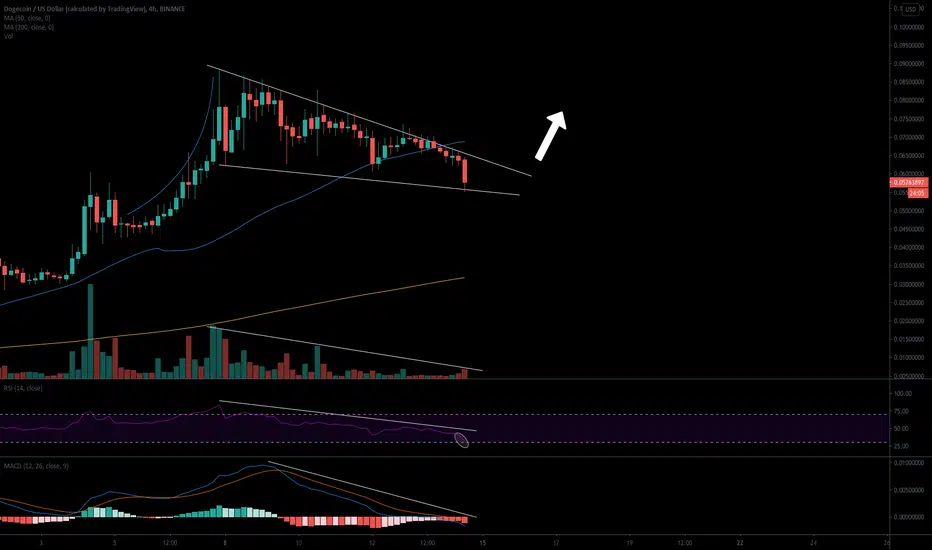
DOGE to the Moon in the next 2 days! Falling Wedge on the 4H!Very bullish indicators all over the 4 hour BITTREX:DOGEUSD chart. First of all, MACD, RSI, volume, and DOGE are all moving declining in unison. RSI is a rock bottom low levels.
There is a falling wedge forming that gives DOGE the technical catalyst to launch to new all-time highs when it reaches the apex. I expect all the cyrptos to have a break-out week as even Ethereum is beginning to get attention from institutional investors.
link is ready to visite the little baby mOn at 45,27 busdlink is ready to visite the little baby mOn at 45,27 busd
looking forward that tastly priCe TaG to JUST Open a beer and sel 5-7% of my personnal BAG
,,,,, be ready guys to party with ME ^^

Top altcoins making x100 movesAll my positions are tagged with red and analyzed daily. Good buy options in my opinion are tagged yellow and the ones I still haven't looked into enough are tagged green.

Altcoins Boom! Let's Take a Closer Look!Altcoins gain 80% in value over just two weeks! Let’s take a closer look at the situation.
The Rally Begins
Over the past six months, Bitcoin has been doing incredibly well, continuously making higher highs and showing consistent growth. However, the same cannot be said for most altcoins. With a few exceptions, most altcoins did not move nearly as much and were mostly consolidating. However, beginning January 28th, the altcoin season began, with the Midcap Index growing by 80% in just two weeks. The Midcap Index consists of 23 mid-cap coins, so it’s safe to say that it accurately represents mid-cap coins.
Trend Direction: The MACD on the daily chart works well as a strategy for BTC. It appears that it also tends to work on the Midcap Index. If you had used it as a strategy since the index’s creation and took only long trades, you could have made a 184% return, which is not excellent considering that the buy and hold would yield 326%. Even when adding the 56% open P/L, you would still only have 230%. Therefore it is better used to identify the trend direction rather than to trade signals off it.
Who is Taking the Lead?
DeFi tokens have been some of the best-performing assets in this bull run. The DeFi index grew 300% in 2021 alone! Other coins related to DeFi, such as LINK and ETH, have also been doing well.
Apart from DeFi, exchange coins have been booming as well. BNB and FTT this year grew by 220% and 270% respectively. OKB also reached a new all-time high.

BNB probably going to 200$ – but what do i know.Volume is increasing, the CEO of Binance is the opposite of a boomer (probably a member of WSB).
We'll maybe see 200$ before next week.

You're in luck! The market is pulling back but $ABCE will MOON! Looking juicy! 💦
ABCO Energy, Inc. is a commercial and residential installer of Photo Voltaic (PV) solar systems, LED lighting solutions and financing for all of these energy saving products. ABCO Energy, Inc. is a Nevada corporation, doing business as 'ABCO Solar' which maintains offices located in Tucson, Arizona. In 2020 ABCO added energy efficient HVAC business.
not trading advice

The Party Isn't Over!! $SNDL to the MOON!!! Cannabis Boom!Yessum! The party isn't over, we can still dance! Weak hands will sell but strong ones will HODL for years and reap the benefits!!
Not trading advice!


TSLA's doing it again. Don't be fooled. 1:5 Risk-Reward Trade.I'm expecting a great 2021 for TSLA overall, regardless of what investors and traders decide. I've drawn a premature triangle representing the region between two levels which I believe are crucial support and likely resistance for the next month and a half. The resistance I based on multiple different Fibonacci extensions drawn out from multiple swings. The support is crucial, not because I believe firmly that it will not break. Rather, it is crucial for this moon move. If we are going to the moon in March, then this support should not break. That is my thesis.
I've also drawn out some key levels from previous charts.
Bear in mind that this triangle matures once we have hit and reversed off of its top and bottom sides at least three times in total. So until now, the trade is not confirmed. However, if you're already long TSLA from my previous posts, then the stop loss should remain as it was at $722.9. This makes the potential loss about 9%. The target is the height of the triangle, supposing the triangle will mature and then break to the upside. That's a target of $1270, a 49% potential profit. Of course the moon is much higher than $1270. That's why I call it an initial target. The achievable moon for the year 2021 is at $2400 as I imagine it.
Either way, let's observe and I will keep updating this idea as exciting TSLA price action unfolds.

Bitcoin Technical Analysis. New Target!Hello, guys!
Yestergay was a huge pump because of 1.5 billion investment in Bitcoin by Tesla. Now it has a great fundamentals to grow.
The price formed the ascending trend channel which was broken 10 hours ago. The was a huge growth and now there are difficulties to break through the R2 pivot ($48000). If the price is able to find support above it, the next target is R3 ($54000). If the rejection is the case and price is able to find support on the trend channel's upper band it is also the great sign of small reaccumulation before the growth continuation.
DISCLAMER: Information is provided only for educational purposes. Do your own study before taking any actions or decisions.

EOS is a great ROI in next mounthesTake as much EOS as you can, it is the best technological BlochChain in the world...

bnb ^_^ ^_^ ^_^ bnb ^_^ ^_^ ^_^ bnb is going to 1000$ late this summer i challenGe dooooo nooooooooot sellll you bnb's !!!!!!! Do not even it will correct !!!!!!
it's a BiG mistake guys !!!!

ZOM Next Price Target $3.5?The trend is strong with this one, but so is the hype. Even rocket ships need to refuel. A slight, healthy correction may be due. OR maybe not.


Doge double top turned doge cup and handle?Could be the makings of a cup and handle here at the 15 if things keep the way they're going. Good time to buy in now if so. If it's a cup and handle then we can expect another day of crazy trading.
