15.08.25 Morning ForecastPairs on Watch -
FX:GBPJPY
FX:EURJPY
FX:GBPAUD
A short overview of the instruments I am looking at for today, multi-timeframe analysis down to what I will be looking at for an entry. Enjoy!
Trade!

Analysis LearnOpen the image to see it in higher quality. 🕯 The points marked are potential entries based on market conditions and higher timeframe analysis. If confirmed, I may take the trade. The win rate usually ranges between 30% and 60%, which means that out of all these buy and sell setups, up to 60% might result in a loss.
📕 Many of you have asked for tutorials here and on TradingView. Please understand that I don’t have the time to provide them, and the best way to learn is by trading with your own money—which you’ve worked hard to earn—of course, not with large amounts but with proper risk management.
🙏 I hope this chart helps you.

EUR USD - PRICE MAY FALL BACK TO 0.5 FIB LEVEL 1.16600 EUR USD here we can see that market created a new high of these week today, now price may take support at 1.16600,make a short entry as shown after breakout of 1.17008 keep a target at 1.16600 short trade, follow and check my page for more live updates...

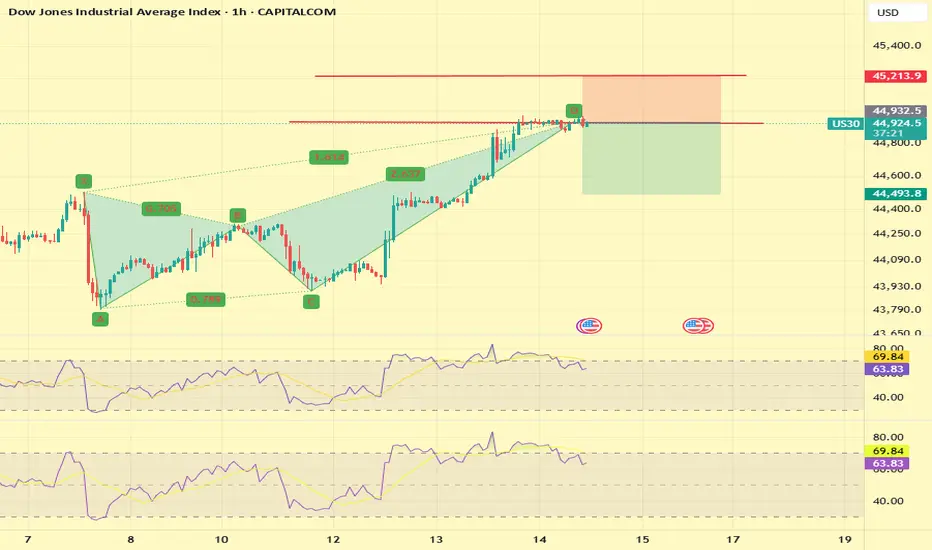
US30 Short This trade is massively overbought on all timeframes and at the all-time high with very good resistance
There is a crab pattern on H1 and H4
Multiple tops on M15 and M30 are showing massive divergence
stoploss above 150 pips
This is against the trend so will have to monitor when it is time to exit
14.08.25 Morning ForecastPairs on Watch -
FX:EURCAD
FX:GBPAUD
OANDA:XAGUSD
FX:GBPJPY
A short overview of the instruments I am looking at for today, multi-timeframe analysis down to what I will be looking at for an entry. Enjoy!

At which support zone will the correction wave end?✏️The accumulation of Gold price in today's trading day from Fibocacci 0.5-0.618 is raising the question of whether the bullish wave structure will continue. Previously a perfect push of Gold price from 3282 to 3406 formed a wave 3 increase, currently the decline in the beginning of the week of Gold is running in the corrective wave of wave 4. 3330 is an important zone in the bullish wave structure, if this zone is broken, the market will end the bullish wave towards ATH.
📉 Key Levels
BUY trigger The reaction of the buying candle at 3330
BUY trigger The confirmation of the candle closing above 3357 (fibonacci 0.618)
Target 3383 Higher is 3431
Leave your comments on the idea. I am happy to read your views.

13.08.25 Morning ForecastPairs on Watch -
FX:GBPAUD
FX:EURCAD
FX:EURUSD
A short overview of the instruments I am looking at for today, multi-timeframe analysis down to what I will be looking at for an entry. Enjoy!

VOLTAS In breakoutNSE:VOLTAS in breakout. As it approaches the key level of 1390, I recommend buying once it decisively crosses that threshold. With bullish momentum building, we can set our sights on the first target at 1480 and an ambitious second target at 1565!
Remember, investing requires careful analysis and risk management. Stay informed, and let’s navigate this market together! What are your thoughts? Are you eyeing VOLTAS or any other stocks for potential growth? Let’s discuss in the comments below! 💬💰 #StockMarket #InvestmentStrategy #VOLTAS #BreakoutTrading

ARPA IS READY FOR NEW MOON FLYArpa seems to give us an important signal of volume, which can lead in the next 50% increase and more, will follow this coin for further building steps.

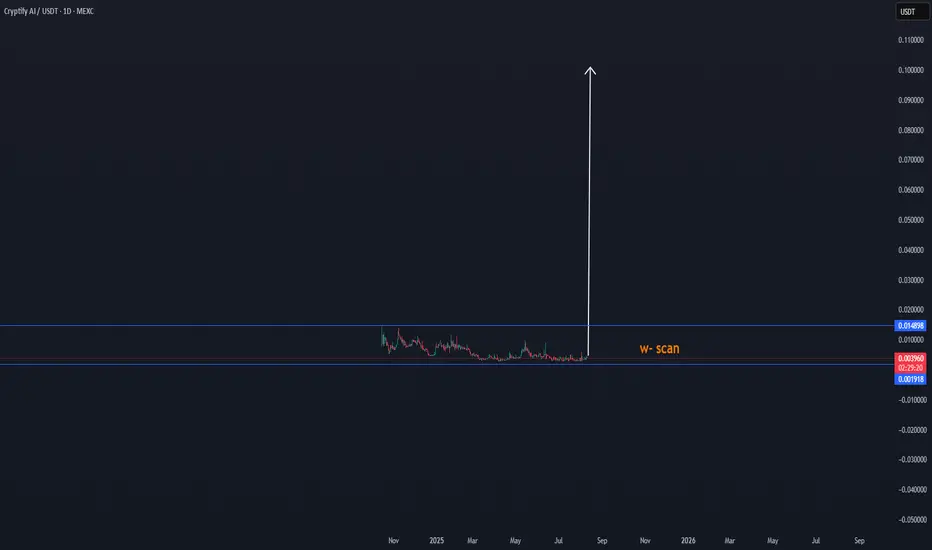
CRAI/USDT is able to breakout as never before x10Our study shows that this small-cap coin can show interesting targets in the coming time, as data shows this, so we will follow it to see new confirmations.
All updates will be here on this page
The price is running now at around: $0,03947 as the chart shows.
12.08.25 Morning ForecastPairs on Watch -
FX:GBPAUD
FX:CADJPY
FX:USDJPY
A short overview of the instruments I am looking at for today, multi-timeframe analysis down to what I will be looking at for an entry. Enjoy!

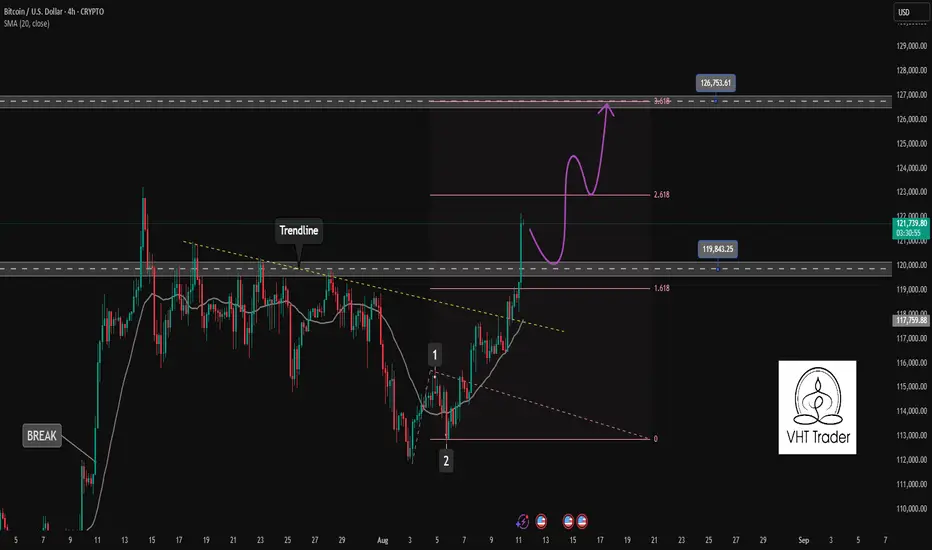
BTCUSD is running wave 3 of the Elliott wave pattern✏️BTCUSD forms a bullish wave after the end of the correction wave at the support zone around 112000. The bullish Dow 2 pattern is formed when there is confirmation of a candle above 115500. Currently, BTCUSD is running wave 3 of the Elliot wave theory and the absolute principle is not to trade against the trend of the main wave. Wait for the profit-taking wave of investors so that the BTC price can adjust to buy towards the Fibonacci zone 3.618.
📉 Key Levels
Buy Trigger: Retest and rejection at the support zone 120,000
Target 127000
Leave your comments on the idea. I am happy to read your views.
EURUSD waiting for recovery to buy✏️EURUSD is still trading in an uptrend and is facing last week's top resistance at 1.170. The lower boundary of the price channel at 1.160 forms a 10-price boundary of the pair. Wait for support retests and buyers' reactions to trigger buying strategies towards the resistance at 1.181 next week
📉 Key Levels
Support: 1.159-1.145
Resistance: 1.169-1.181
BUY Trigger: Rejection of the support zone at 1.159
BUY zone 1.145 (Strong support zone)
Leave your comments on the idea. I am happy to read your views.

EUR/USD 4-Hour Candlestick Chart - OANDA4-hour candlestick pattern for the Euro/U.S. Dollar (EUR/USD) currency pair on the OANDA platform, showing a recent price of 1.16068 with a 0.00348 (-0.30%) decrease. Key levels include a sell signal at 1.16059 and a buy signal at 1.16076, with a highlighted resistance zone around 1.16697-1.16797 and support around 1.15453. The chart indicates a downward trend following a peak, with price action tracked from August 11 to September 11, 2025.

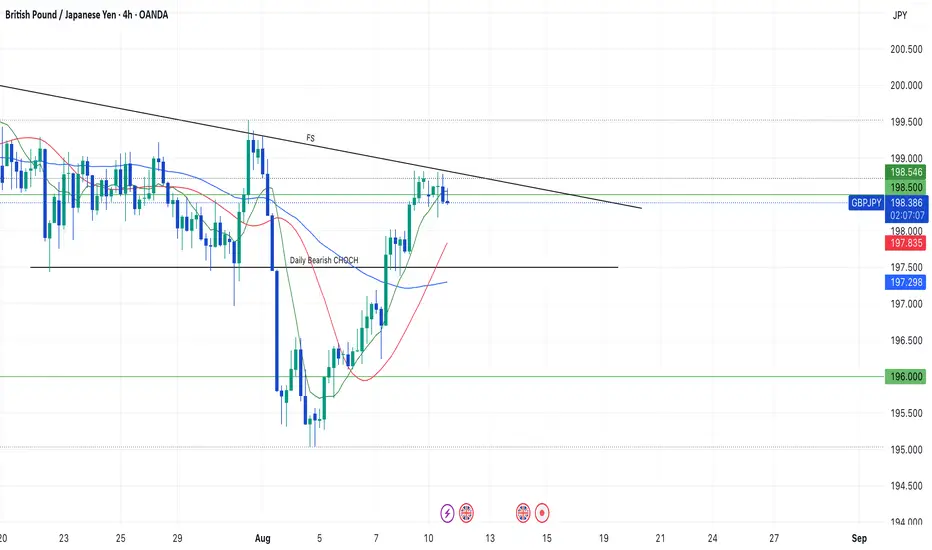
My Confluences to give a SetupHi Traders!
With GJ tapping 198.500 so many times, and eating up Monday July 28th Weekly Bearish candle on Monday the 4th, and testing a weekly CHOCH with rejection- I'm just waiting for a break set up. But, I'd like to see a few confluences first to have more confidence in a long. If price can retrace in between 198.000/197.000 on a higher TF (because it's had 4 Daily runs in a row) and create a new HL, that may confirm to me that the Daily bearish CHOCH would be invalid. Or for price to stay above 198.500 with bounces off that area showing momentum to break the failed swing. IMO, these confluences could give me the best set up possible. Patience is required to see if this set up will work.
*DISCLAIMER: I am not a financial advisor. The ideas and trades I take on my page are for educational and entertainment purposes only. I'm just showing you guys how I trade. Remember, trading of any kind involves risk. Your investments are solely your responsibility and not mine.*
JPN225 ShortThis trade has massive resistance as it is at the all time high
There is a massive Bat pattern on H4
All timeframes are overbought
There is a head and shoulders present on M30 and H1
Massive divergence
stoloss of 250 pips

11.08.25 Morning ForecastPairs on Watch -
FX:USDCAD
FX:GBPAUD
FX:CADJPY
OANDA:XAGUSD
A short overview of the instruments I am looking at for today, multi-timeframe analysis down to what I will be looking at for an entry. Enjoy!

Gold Price Analysis August 11Last week, gold closed the last trading session in a sideways state in the accumulation zone. Entering the beginning of this week, the market is waiting for a new push to break the 3385–3405 zone, from which to trade in the winning direction.
If the lower edge breaks: A correction will be formed, then there is a high possibility of a new uptrend towards the historical peak (ATH).
If the upper edge breaks: The buyers can completely take advantage of the uptrend to bring the price closer to the ATH mark around 3445 in a short time.
📌 Key Levels
Support: 3383 – 3345
Resistance: 3404 – 3431 – 3445

EURUSD Analysis week 33🌐Fundamental Analysis
The US Dollar (USD) struggled to find buying momentum on Thursday, but the EUR/USD pair struggled to build upside momentum. The US economic calendar will not release any macroeconomic data that could boost USD valuations over the weekend. Therefore, investors may pay attention to comments from Federal Reserve officials and risk sentiment.
A bullish move on Wall Street after the opening bell could limit the USD’s upside momentum and help the EUR/USD pair find support. Conversely, the pair could continue to decline if the market turns cautious in the second half of the day.
🕯Technical Analysis
EURUSD is still trading in an uptrend and is facing resistance at 1.170. A break above 1.160 forms a lower boundary support zone that should prevent further downside. Pay attention to the resistance and support zones noted on the chart to have a strategy when there is a price reaction in that area.
📈📉KEY LEVEL
Support: 1.160-1.145
Resistance: 1.170-1.181

ORDER/USDT NEW TREND VOLUMEThe order shows a new trend in volume, which can be confirmed in the coming hours.
We will follow this coin for the coming confirmation flow.
Order/usdt started from $0,1072 with a new confirmed volume, which has now paused since $0,1214. The trend can stay here for a time, stable and build new uptrend volume to up $0,16 as the first target. As long as the coin stays up $0,09, the trend is healthy.

EUR/USD Breaking Point! ALERT Price action is coiling up in a tight triangle and a breakout is imminent! See how the ABCDE pattern on the chart is setting up for a potential explosive move. Will EUR/USD surge higher or drop to key support?
I've mapped out BOTH scenarios with clear technical targets—don’t miss your chance to catch the next big wave!
💡 Tap "Boost" if you found this analysis helpful.
📈 Follow my page for daily actionable trading setups!
👇 Drop your predictions in the comments below—are you bullish or bearish on EUR/USD this week?
Let’s win together!

AUDJPY & CADJPY Trade Recaps 08.08.25A long position on AUDJPY taken Monday for a -1%, the trade had great potential but one of those ones that didn't have enough steam to commit. Followed by a CADJPY short taken yesterday for a +2% manual close.
Full explanation as to why I executed on these positions and the management plan with both.
Any questions you have just drop them below 👇

08.08.25 Morning ForecastPairs on Watch -
FX:GBPJPY
FX:EURNZD
FX:GBPAUD
A short overview of the instruments I am looking at for today, multi-timeframe analysis down to what I will be looking at for an entry. Enjoy!
