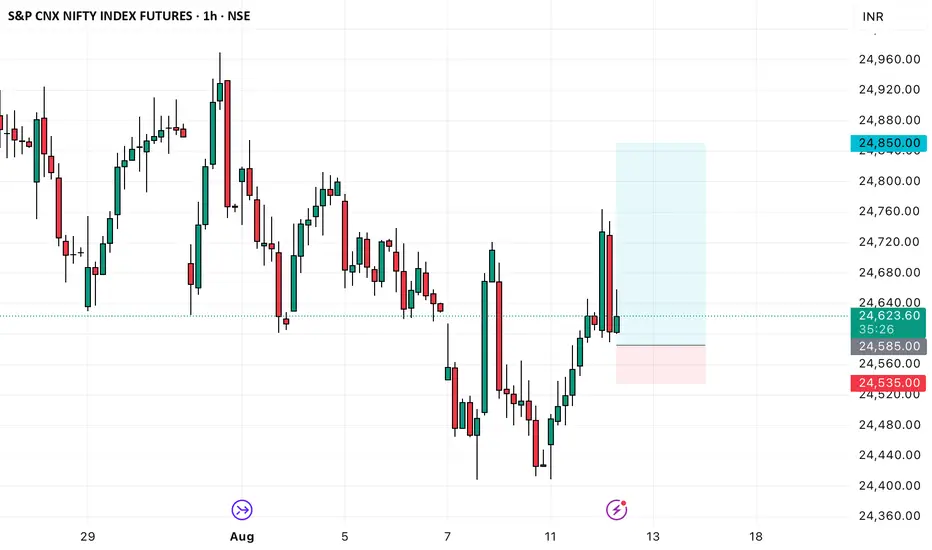
NF FUT long setupNF FUT long setup
Entry - 24585
Stop loss - 24529
Target - 24942
Risk Reward - 1:6.3
Tradesetup
UPST Bear Breakdown Incoming! Put Strike $58
# ⚡ UPST Swing Alert – 2025-08-15 ⚡
**Sentiment:** Moderate Bearish
**Setup:** Put Option Trade
---
## 📉 Market Snapshot
* **Daily RSI:** <45 → Bearish momentum
* **5 & 10-Day Trend:** Negative → Confirmed downtrend
* **Volume:** Avg (1.0x) → Weak breakout confirmation
* **Call/Put Ratio:** 1.00 → Neutral
* **VIX:** Favorable low volatility for controlled downside
---
## ⚖️ Consensus & Conflicts
**Agreement:**
* Bearish momentum confirmed across models
* Structural weakness supported by multi-timeframe negative performance
* VIX favors swing execution
**Disagreement:**
* Timing & execution vary: some models recommend immediate puts, others await volume confirmation or breakdown
* Strike selection differs slightly (\$58 vs \$61)
---
## 🎯 Trade Setup – UPST PUT
**Entry Condition:** Confirm bearish breakdown at market open
**Strike:** \$58.00
**Expiration:** 2025-08-29
**Entry Price:** \$1.00
**Confidence:** 72%
**Profit Target:** \$2.00 (100% gain)
**Stop Loss:** \$0.60 (≈40% of premium)
**Key Risks:**
* Corporate developments (e.g., convertible notes) may alter price direction
* Sudden bullish reversals or volume spikes
---
## 📝 TRADE DETAILS (JSON)
```json
{
"instrument": "UPST",
"direction": "put",
"strike": 58.0,
"expiry": "2025-08-29",
"confidence": 0.72,
"profit_target": 2.00,
"stop_loss": 0.60,
"size": 1,
"entry_price": 1.00,
"entry_timing": "open",
"signal_publish_time": "2025-08-15 16:14:27 UTC-04:00"
}
```
---
## 📊 Quick Reference – TradingView Ready
🎯 **Instrument:** UPST
🔀 **Direction:** PUT (Short)
💵 **Entry Price:** \$1.00
📈 **Profit Target:** \$2.00
🛑 **Stop Loss:** \$0.60
📅 **Expiry:** 2025-08-29
📏 **Size:** 1 contract
⏰ **Entry Timing:** Market Open
🕒 **Signal Time:** 2025-08-15 16:14 EDT
---
### Suggested Viral Title & Tags:
**🔥 UPST Bearish Swing Alert: Put Strike \$58 Ready ⚡**
\#UPST #SwingTrade #OptionsTrading #Bearish #PutOption #Momentum #TradeSetup #TechnicalAnalysis #StockAlerts #Finance #TradingSignals #MarketWatch #ShortTrade

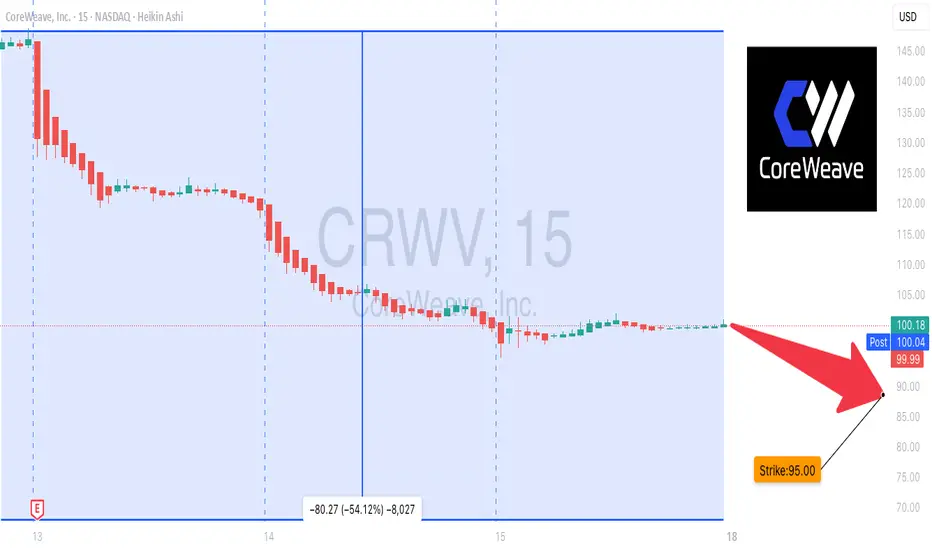
CRWV Breakdown Alert: Short Setup Ready!
## **⚠️ CRWV Bearish Swing Setup – Puts in Play!**
**Moderate Bearish Bias | Aug 15, 2025**
**📊 Key Highlights:**
* **RSI:** 37.9 – Clear bearish momentum 📉
* **5D Perf:** -17.98% 🚨
* **10D Perf:** Similar heavy downside pressure
* **Volume:** Average (1.0x) – no panic selling, but no bullish rescue either
* **Options Flow:** Neutral Call/Put (1.00)
* **VIX:** 14.84 – Low volatility, clean downside setups
---
**💡 Trade Plan:**
* **Type:** Aug 29 ’25 \$95 PUT
* **Entry:** \$6.50 (on confirmed break < \$98)
* **Stop Loss:** \$2.52 (-40%)
* **Target 1:** \$9.45 (+50%)
* **Target 2:** \$15.75 (+150%)
* **Confidence:** 75%
---
**⚠️ Risks:**
* Reversal above \$100 = high risk of stop hit
* Premiums elevated vs historical norms
* Weak volume = could slow downside momentum
---
📆 **Signal Time:** 2025-08-15 11:46 EDT
💎 **Execution:** Enter at open ONLY if \$98 breaks with momentum
---
\#CRWV #OptionsAlert #SwingTrade #PutOptions #NASDAQ #BearishTrade #MomentumStocks #StockMarket
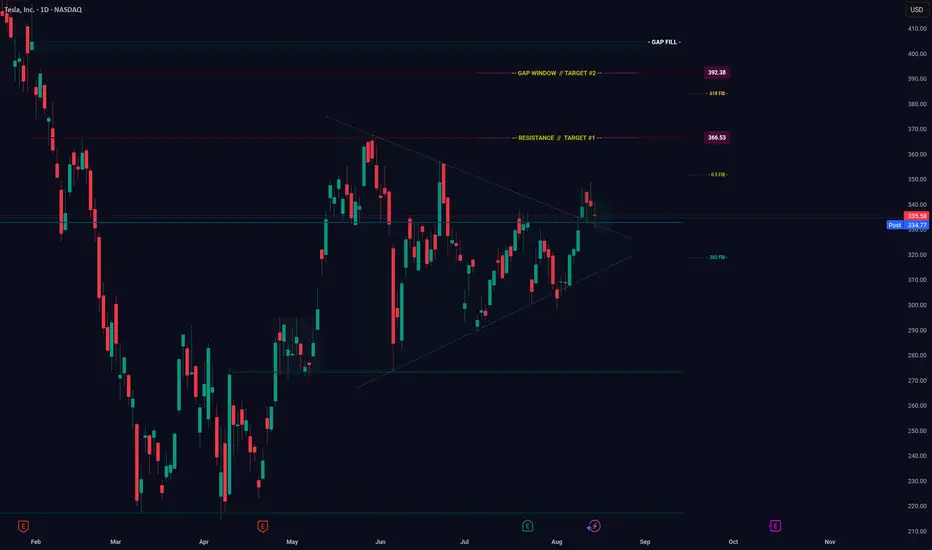
TESLA BREAKOUT -- TARGET LEVELSHello Traders! Tesla recently broke out of its wedge pattern, with price currently consolidating just outside the breakout trendline.
Price should continue to the upside based on the technicals.
I have charted the target levels for Tesla for an upside move.
Thanks everyone!
GBPUSD SHORTWe can expect a notable sell-off in the coming days from here. Im short on this pair, are you?

My Confluences to give a SetupHi Traders!
With GJ tapping 198.500 so many times, and eating up Monday July 28th Weekly Bearish candle on Monday the 4th, and testing a weekly CHOCH with rejection- I'm just waiting for a break set up. But, I'd like to see a few confluences first to have more confidence in a long. If price can retrace in between 198.000/197.000 on a higher TF (because it's had 4 Daily runs in a row) and create a new HL, that may confirm to me that the Daily bearish CHOCH would be invalid. Or for price to stay above 198.500 with bounces off that area showing momentum to break the failed swing. IMO, these confluences could give me the best set up possible. Patience is required to see if this set up will work.
*DISCLAIMER: I am not a financial advisor. The ideas and trades I take on my page are for educational and entertainment purposes only. I'm just showing you guys how I trade. Remember, trading of any kind involves risk. Your investments are solely your responsibility and not mine.*
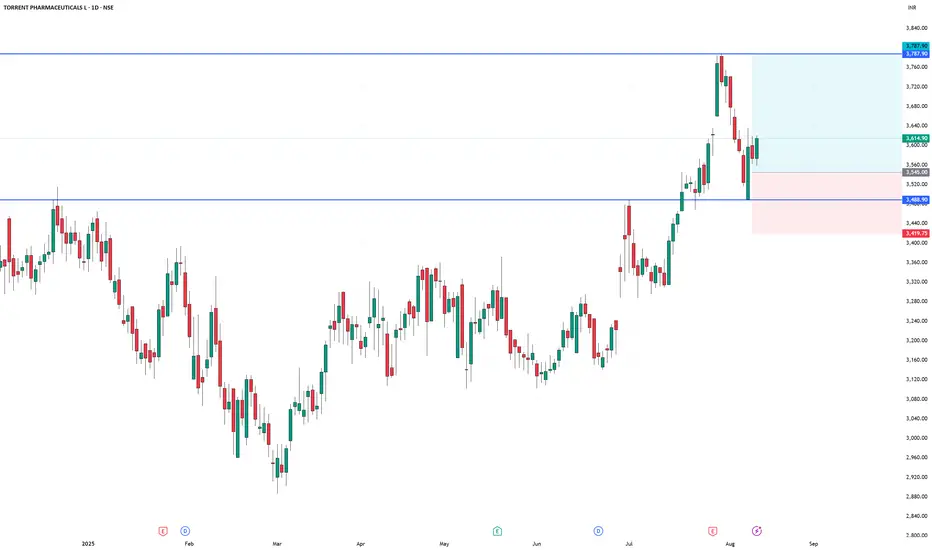
TORNTPHARM long setupTORNTPHARM long setup
Entry - 3545
Stop loss - 3420
Target - 3788
Risk Reward - 1:1.94
BTC - Short Trade / Crash Update and DetailsPer my previous post here are the details on my personal trade. Note this is NOT financial advice, and this is my own personal trading plan only. Please use your own judgement.
Entry - 116,300 to 116,600
Stop Loss - 121,800
Target 1 - 95,700
Target 2 - 61,500
Target 3 - 35,000
Target 4 - 8,000
Note that Bitcoin should move up from the 35,000 target to 88,000 making a corrective wave on HTF.
At this point I will post an update and advise my own strategy and if I long 35,000 to 88,000.
Happy trading

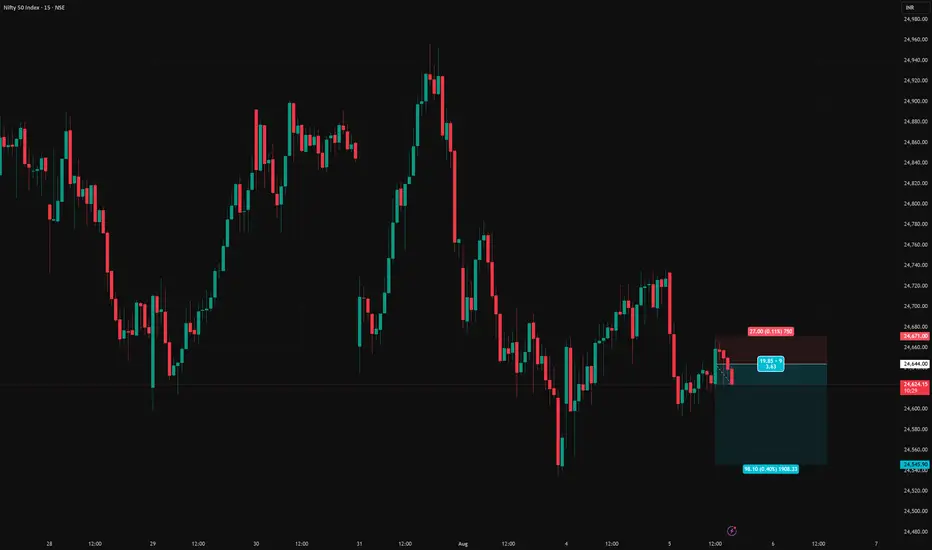
NIFTY long setupNifty long setup
Entry price - 24408.55
Stop loss - 24354.60
Target - 24542.90
Risk Reward - 1:2.5
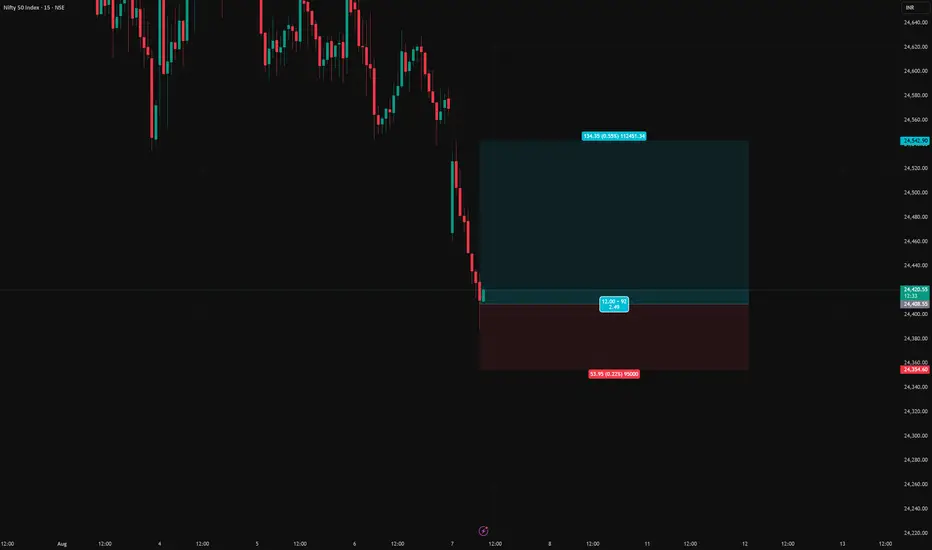
NIFTY short setupNifty short setup
Entry - 24644.00
Stop loss - 24671.00
Target - 24545.90
Risk Reward - 1:3.6
BTC - About to TankBitcoin is holding below these bearish trendlines pointed out on previous posts.
Here we can see liquidation levels on the HTF.
I see two potential moves:
Scenario A)
115,000 to 17,000-20,000 range
Scenario B)
3 Wave Corrective Pattern
115,000 to 35,000
35,000 to 83,000
83,000 to 8,000-10,000
DXY is retesting a major bearish breakdown on the weekly / monthly time frame. This is why we have been seeing the recent drop, and preparation for a mass liquidation / flash crash.
The above stated is my own personal views and is not intended as financial advice. Please trade responsibly.

BTC - Not the End of the DropRather the beginning. Bitcoin has fallen below this bearish intersection. Anticipating price to fall rapidly on one of these two pathways to the Uber low liquidity levels.
DXY is retesting a major bearish breakdown - this is the conduit that will justify a flash crash of this magnitude prior to a 3-5 year bull run.
Happy trading.
HOW TO TRADE 'BIG CANDLE"This is an educational video showing a trade set up based on big candles.
This video is for information/education purpose only. you are 100% responsible for any actions you take by reading/viewing this post.
please consult your financial advisor before taking any action.
----Vinaykumar hiremath, CMT

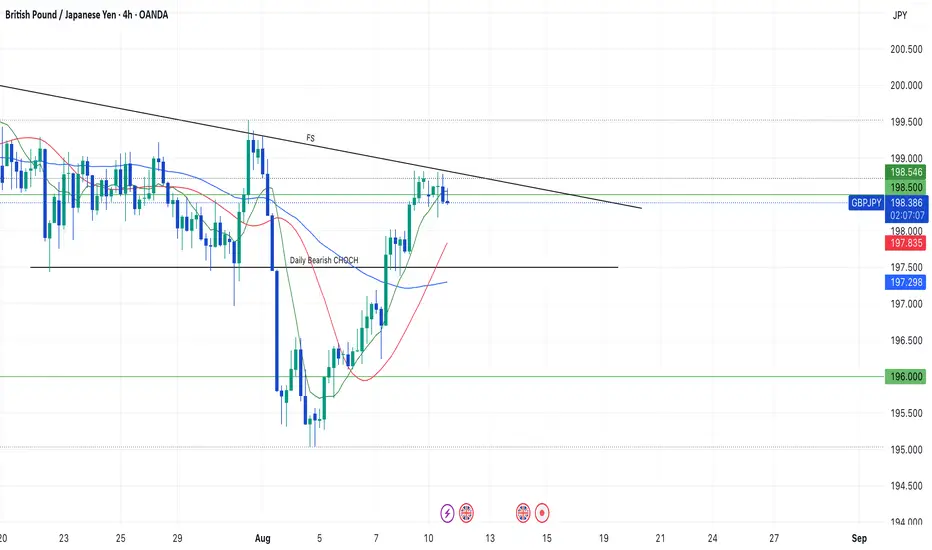
GBP/JPY: A Key Short Setup Forms as Momentum FadesHello traders,
Taking a look at GBP/JPY on the 4-hour timeframe. After a significant run, the price action has stalled, and we're seeing clear signs of fading momentum. This is creating a well-defined consolidation zone, which may present a key opportunity for a short position.
The Technical Picture 📊
1️⃣ Price Consolidation: GBP/JPY is currently trading sideways within a tight range, highlighted on the chart. This period of indecision and balance between buyers and sellers often precedes a significant directional move. The structure suggests a phase of distribution may be underway.
2️⃣ Fading Momentum: The Relative Strength Index (RSI) confirms this loss of momentum. A sustained reading below the 50 midline would signal that sellers are beginning to gain control and that the path of least resistance is shifting to the downside.
The Strategy 🧠
The core idea is to anticipate a bearish breakdown from the identified consolidation zone. A clean break and hold below this range would serve as confirmation that sellers have taken over, providing an opportunity to enter a short position targeting a continuation of the larger bearish move.
Trade Parameters 📉
👉 Entry: 198.895
⛔️ Stop Loss: 201.405
🎯 Take Profit: 192.872
Risk/Reward Ratio: approx. 2.4
This is my personal analysis and perspective, not financial advice. Always conduct your own research and manage your risk accordingly.
Good luck, and trade safe.

Bitcoin Day Trade Signsl To Buy NowIf this trade plays out I will make 7x my risk!
Subscribe to my YT channel at DNiceFx to watch me trade live!!

EURAUD Weekly Trade Setup(14 to 18th July 2025) - Head&ShoulderThis week, EURAUD (Euro/Australian Dollar) has entered a critical price zone, providing a textbook technical opportunity for traders. A clear Head & Shoulders pattern has formed on the 4-hour chart, pointing toward a potential trend reversal from bullish to bearish.
Let’s explore how to trade this intelligently from both bullish and bearish perspectives.
1. Bearish Setup – Head & Shoulders Pattern Breakdown
This is the primary trade idea for the week.
✅ Trade Logic:
Price has completed a classic Left Shoulder → Head → Right Shoulder formation.
The neckline (support) will be tested.
The current price is will pulling back to retest the right shoulder resistance zone, offering an ideal short opportunity.
🔻 Entry Plan:
Wait for bearish reversal confirmation (candlestick rejection or bearish engulfing) on the 1H or 4H timeframe.
Enter short once confirmation appears near 1.7850–1.7900.
📉 Stop Loss:
Place SL above the right shoulder high, adjusting for volatility and swing high (around 1.7950).
🎯 Targets:
Target zone: 1.7450–1.7500 (profit booking zone marked on the chart)
Potential Risk/Reward Ratio: 1:2, 1:3, or even 1:4+
2. Alternative Bullish Setup – Reversal at Neckline (High Risk)
This setup is for experienced or aggressive traders who spot early reversals.
✅ Trade Logic:
Price may bounce from the neckline and 200 EMA support area.
If this happens, a temporary bullish reversal may push price back toward the right shoulder zone.
🔺 Entry Plan:
Wait for bullish confirmation (reversal candle) near the neckline and EMA support (around 1.7700).
🚨 Stop Loss:
SL must be below the neckline swing low (around 1.7650).
🎯 Targets:
Resistance zone (right shoulder): 1.7850–1.7900
R:R setups of 1:2 or 1:3 possible
⚠️ This is considered a counter-trend trade and should be traded with caution.
3. Technical Confluence and Indicators
Pattern: Head & Shoulders (bearish reversal)
EMA 200: Price reacting around the long-term trend line
Support/Resistance: Cleanly defined horizontal zones
Reversal zones: Highlighted in red (supply) and green (demand)
4. Final Thoughts
This week’s EURAUD setup is a strong example of structure-based trading. With a well-formed head and shoulders pattern and a clean neckline break, the market signals a shift in momentum.
Safe Approach: Trade the short side after resistance rejection.
Risky Approach: Try a long on neckline bounce with tight SL.
Always confirm with your system and maintain strict risk management. Trade what you see, not what you feel.
Ready to trade? Save this setup, monitor price action, and execute only with confirmation.
=================================================================
Disclosure: I am part of Trade Nation's Influencer program and receive a monthly fee for using their TradingView charts in my analysis.
=================================================================

BTC - Zoomed Out ScenarioAs predicted DXY has broken down a major monthly bearish trendline - currently finishing a bearish retest before further free fall.
If this plays out we have 2-3 years of a weakening / correcting dollar, and a strengthening investment in assets such as Bitcoin.
This means an extended bull market spanning 2-4 years on Bitcoin and equities.
However - there is a mass amount of liquidity to the uber lows towards 10,000 on BTC.
Market is showing manipulated intention to hit these lows by keeping the price below this bearish cross section - and that’s why bitcoin hasn’t been moving up yet.
This tells me this is more likely than we all think to play out.
I’m trading the following:
Short - 108,200 to 35,000
Long - 35,000 to 80,000
Short - 80,000 to 10,000
Will update accordingly if the plan changes.
Happy trading.

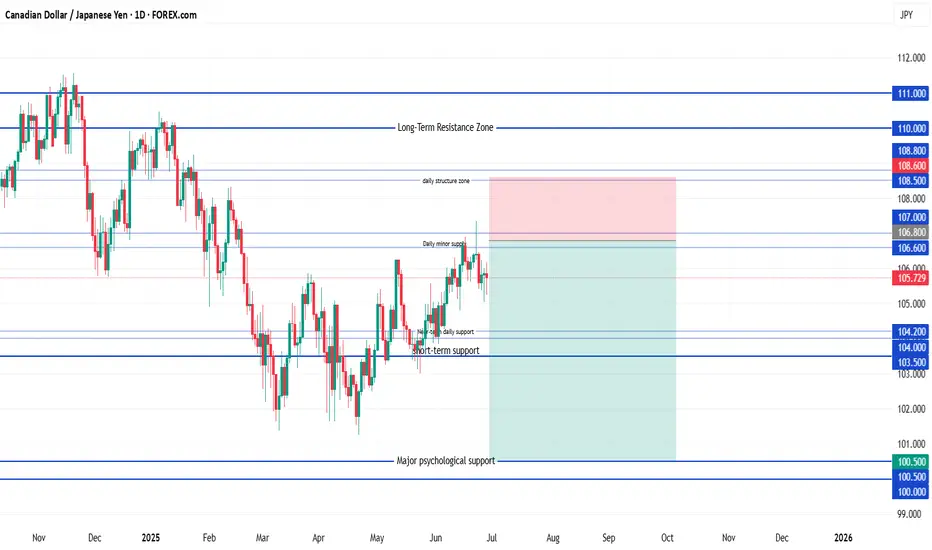
CAD/JPY ShortSell Limit Entry: 106.80
(Just under the resistance trap zone: 106.60–107.00)
Stop Loss: 108.60
Target 1: 104.20
(First minor support zone)
Target 2: 103.00
(Deeper support + recent structure base)
Target 3 (Optional hold): 100.50
(Long-term structural support zone)
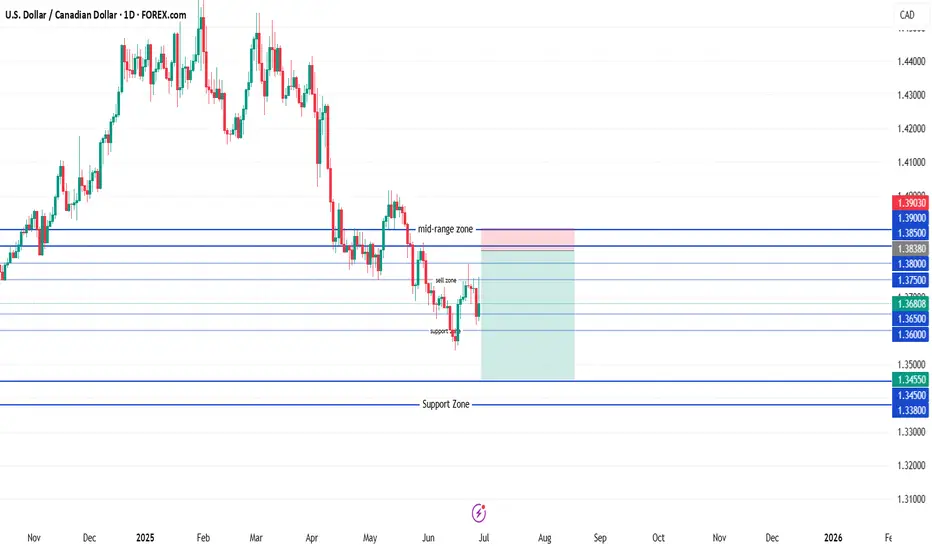
USD/CAD ShortSell-limit order: 1.3838
Stop-loss: 1.3903
Target 1: 1.3705
Target 2: 1.3605
Target 3 (optional runner): 1.3455
Place the limit at 1.3838 and keep the stop above 1.3900; scale out at the listed targets as price moves in your favor.
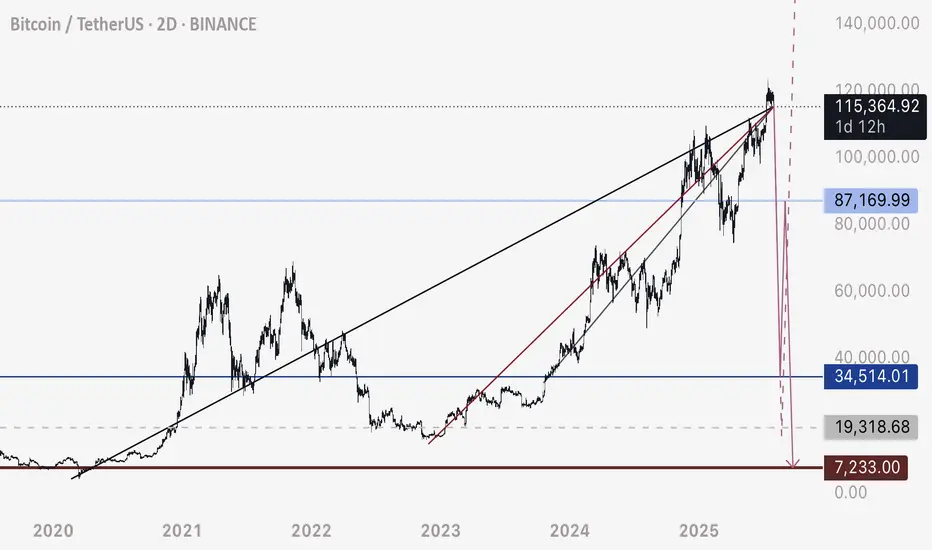
Why BTC hasn’t moved up recentlyBTC has been bobbing above and below this bearish triple crossover the past few months. What we see as consolidation is rather price getting stuck around these resistance levels.
The only reason why this would be occurring in my view, is due to the market makers having intention to allow this drop to play out.
The resistance is located at around 107,000 to 107,400 - watch this zone closely for a hold below / rejection and fast drop.
Scenario 1 marked with solid red line.
Scenario 2 marked with dotted red line.
Little update for y’all. Happy weekend trading.

SUI Is Ready To Run!Good Morning Trading Fam,
I'm putting out a quick trade setup here on SUI, a coin I am honestly a long-term hodl'er of. I believe this coin has an exciting future ahead of it with tremendous potential to change the blockchain landscape for the better.
But this post is for those of you interested in trading it.
We have a perfect setup here. Descending bullish triangle, which we are nearing the end of. Strong long-time support underneath us. And my proprietary indicator has given us a buy signal at the point of confluence of both of the above. I have set three targets for you. Obviously, the higher the target, the higher the risk. Trade accordingly and let me know in the comments how you did. It makes me happy to know my followers are successful in their trades.
Best,
Stew

GBP/USD Downtrend Wedge Breakout Setup – Bullish Target AheadThe GBP/USD pair is currently displaying a downtrend wedge pattern, a structure that typically signals a bullish reversal when confirmed. The pattern is formed by a descending resistance trendline (in red) and a gradually sloping support line (in green), converging to a point. Price has bounced off the wedge’s support multiple times while forming lower highs, creating pressure that often leads to a breakout.
As seen in the chart, the pair recently surged toward the upper resistance line and is now attempting to break above it. A successful breakout with bullish candle confirmation could lead to a strong move upward.
📈 Breakout Scenario
If the price manages to close above the resistance zone (~1.3490–1.3500), it would confirm the wedge breakout. Based on the height of the pattern, the projected breakout target is around 1.3692. This target is calculated by measuring the vertical height of the wedge and adding it to the breakout point. Confirmation of breakout should ideally include a retest of the broken resistance acting as new support.
📉 Rejection Scenario
However, if the breakout attempt fails and the price gets rejected again from the red resistance line, the pair could retest the wedge’s support area around 1.3360. A breakdown below the green zone would invalidate the bullish outlook and suggest continued bearish pressure.
⚙️ Strategy Tips
Buy Setup: Enter after breakout candle closes above 1.3500 with stop loss just below breakout zone.
Take Profit: Use the 1.3692 level as the primary target or scale out on the way up.
Confirmation: Always wait for breakout confirmation before entering; avoid false breakouts.
✅ Conclusion
This wedge breakout setup offers a bullish trading opportunity if confirmed. The clear structure, repeated tests of both support and resistance, and recent momentum build a strong technical case. Still, confirmation is key before initiating any positions.
=================================================================
Disclosure: I am part of Trade Nation's Influencer program and receive a monthly fee for using their TradingView charts in my analysis.
=================================================================
