USDCHF Is Very Bullish! Buy!
Here is our detailed technical review for USDCHF.
Time Frame: 1D
Current Trend: Bullish
Sentiment: Oversold (based on 7-period RSI)
Forecast: Bullish
The market is testing a major horizontal structure 0.795.
Taking into consideration the structure & trend analysis, I believe that the market will reach 0.806 level soon.
P.S
Please, note that an oversold/overbought condition can last for a long time, and therefore being oversold/overbought doesn't mean a price rally will come soon, or at all.
Like and subscribe and comment my ideas if you enjoy them!
Trading

GBPCHF Is Going Down! Sell!
Take a look at our analysis for GBPCHF.
Time Frame: 30m
Current Trend: Bearish
Sentiment: Overbought (based on 7-period RSI)
Forecast: Bearish
The market is approaching a key horizontal level 1.045.
Considering the today's price action, probabilities will be high to see a movement to 1.043.
P.S
The term oversold refers to a condition where an asset has traded lower in price and has the potential for a price bounce.
Overbought refers to market scenarios where the instrument is traded considerably higher than its fair value. Overvaluation is caused by market sentiments when there is positive news.
Like and subscribe and comment my ideas if you enjoy them!

STRK/USDT – Position accumulation in a descending channel.StarkNet - is a permissionless decentralized Validity-Rollup (also known as a “ZK-Rollup”). It operates as an L2 network over Ethereum, enabling any dApp to achieve unlimited scale for its computation – without compromising Ethereum’s composability and security, thanks to StarkNet’s reliance on the safest and most scalable cryptographic proof system – STARK.
StarkNet Contracts and the StarkNet OS are written in Cairo – supporting the deployment and scaling of any use case, whatever the business logic.
CoinMarketCap : #106
Twitter(X) : 346,4k
Currently, STRK is trading within a large descending channel , with the price sitting at the support of the inner channel . After the hype, the price has dropped by -95% ! The Series B & C Round zones are being tested. A -30% drop to the support of the outer channel is not ruled out.
STRK will likely move only when ETH starts growing , as it is an L2 solution.
During the listing phase , this coin was heavily hyped— bloggers were screaming to buy before it "took off" , but they forgot to mention that the rocket was headed downward . Most of them had no real idea what they were doing—it was all just for hype and content .
Now, few still believe in its potential … faith is gone .
But this is exactly why fear is unnecessary . Historically, negative zones often provide some of the best entry points.
I expect STRK to outperform ETH in profitability due to its low liquidity.
I’ve marked everything on the chart—consider this in your trading strategy.

DYDX/USDT – Working within the horizontal channel. Continuation.dYdX - is DeFi’s pro trading platform and a pioneer in decentralized finance, known for being the first to offer decentralized margin trading and derivatives, as well as inventing flash loans and DEX aggregators in 2018. Built on a custom Layer-1 blockchain using the Cosmos SDK, dYdX provides a professional-grade, decentralized trading experience with high leverage, deep liquidity, and low fees. Governed by the community through the DYDX token, dYdX is focused on delivering a transparent and user-driven financial system.
CoinMarketCap : #107
I've been working within this channel for about 2.5 years.
From my previous trading idea, two marked zones were reached:
1.6447 (+80%)
2.5007 (+176%)
The maximum squeeze reached +185.5%.
I'm continuing to work within the channel.
Last time, liquidity was accumulated below the support of the inner channel.
Now, liquidity is being gathered below the support of the outer channel—as always.
I've marked potential final liquidity grabs on the chart, as well as resistance zones where the price is likely to react.
The profit is significant, and if you work with compound interest, well… I'll just keep quiet—not everyone understands this and keeps waiting for the final rally.
A reminder:
Right now, fear dominates across all coins. This is the phase where nobody wants to buy or where many have already run out of funds. Why? Because, as always, most people buy at the top.
Take all of this into account in your trading strategy.

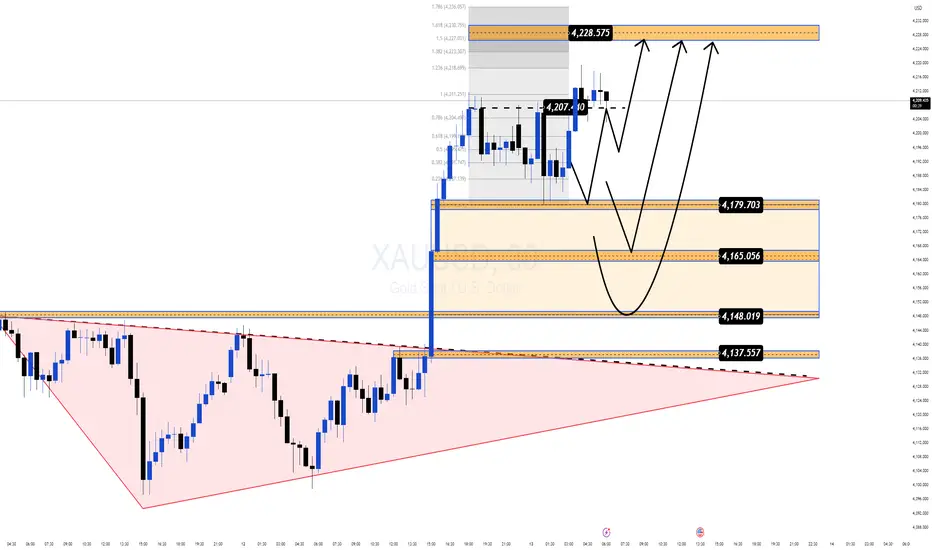
Gold Hits a 3 Week High but the Real Move Might Still Be LoadingGold just tapped $4,213 — the highest level in three weeks, powered by growing expectations of a dovish Fed and optimism around the potential reopening of the US government.
But the real story isn’t the headline spike — it’s the structure forming right beneath it.
📌 Why this zone matters right now
Price is pulling back into $4,179–$4,165, a clean Demand zone aligning with Fibo + breakout structure.
Buyers remain firmly in control despite a mild USD recovery.
The market swept liquidity around $4,207, hinting at accumulation before the next expansion.
The broader pattern resembles a falling-wedge breakout, often appearing before strong upside continuation phases.
🎯 Most Probable Scenario (Mind Insight)
Gold is in a “compression before expansion” phase.
Once this squeeze resolves, momentum is likely to continue in the direction that’s already dominant — and right now, that’s the bulls.
🔶 MMF BUY Zone
$4,179 → $4,165
Looking for a shallow pullback before the next leg.
🔼 Bullish Targets
• $4,207 (liquidity tap)
• $4,228 (Fibo 1.618)
• $4,236 (Fibo 1.786 — major reaction zone)
🧠 Key Takeaway
As long as Gold holds above $4,165, the bullish structure remains intact and the upside expansion toward the upper Fibo cluster stays in play.
LRC/USDT – Horizontal channel. Continuing to work.Loopring - is an open protocol designed for building decentralized crypto exchanges.
CoinMarketCap : #262
Since the publication of my trading idea, the price has reached the resistance zone of the inner channel at $0.3338 (+158%). From there, it retraced back to the support of the outer channel, following the overall market movement.
I've marked potential liquidity grabs (wicks) as well as future target zones in case of a trend reversal on the chart.
Remember, if you're feeling scared right now, so is everyone else. Many have lost faith in a market recovery. Typically, these are strong triggers for position accumulation.
There's no need to guess where the price will go—just build your strategy and follow it.
My previous idea generated solid profit, and I'm now reinvesting from profits using compound interest.

SCRT/USDT – Testing support. Will the scenario repeat?Secret - is a privacy-focused blockchain built on Cosmos. Its smart contracts, called Secret Contracts, enable DApps to utilize private data on Secret, similar to how smart contracts function on other blockchains. However, Secret Contracts transmit encrypted data through encrypted channels without exposing it. This is made possible by encrypting the contract state during execution.
All the charts are cropped, so I found a more complete historical chart of the coin and overlaid it to the left.
This coin has dropped by approximately -98% since its distribution. To put it in perspective, if you had invested $1,000 , you would now have only $20 …
We observe a formation resembling an internal channel (120%) and an external channel (280%) . The price is once again being squeezed near support at the lowest price zones available on Binance (where the main liquidity is).
My previous trading idea played out successfully in three zones .
Profit from the time of publication to the squeeze: +270%.
The price is moving within a descending channel , but at the same time, the sideways range I previously anticipated is also forming. Here, it’s crucial to adapt to the situation.
Right now, the entire market is experiencing a pullback toward support levels .
I've marked potential final liquidity grab zones on the chart—consider these in your trading strategy.
Also, I want to highlight how negative the news sentiment is at the moment. No one believes in a rally. But that's exactly how it always looks in similar price reversal zones !)))

GBPUSD: Testing Daily HTLKey Observations
- On the D1 TF, price is in a downtrend; however, it's currently testing a key HTL
- If price is able to hold below this level, this is a good indication of keeping my bearish bias
- However, the bullish daily bars is not a great sign for downside strength
- ATL had to be drawn multiple times, which is signaling a weaker price action and a point of concern for the downtrend strength

Stop Overcomplicating Trading: The Consistency Blueprint No One Stop Overcomplicating Trading: The Consistency Blueprint Nobody Wants to Talk About
Two decades in the market have taught me a very real truth:
Profit isn’t about being the smartest or catching the breakout. It’s about showing up for yourself every week; especially when motivation disappears and the trades get hard.
I’ve been at this 20 years; through bull runs, ugly drawdowns, burnout, and those quiet Sunday reviews where nothing made sense. The only thing that’s kept me in the game and steadily profitable? Building ultra-simple consistency habits that actually fit my life.
Let me give it to you straight: here’s how to move the needle, no matter where you are:
Forget perfection. Track what REALLY matters.
For most, it’s not a magic strategy—often it’s reviewing trades, keeping promises to yourself, and taking care of your brain and sleep before the next setup.
Pick 2-3 metrics and make them sacred:
For me, it’s weekly trade review, a “focus” score for my setups, and legit sleep tracking. I only look at these, period.
Make review time non-negotiable:
I set aside 20 min a week, never skipped. It’s my reset button after wins and losses.
Write out quick wins & lessons—immediately after they happen.
Let the good trades teach you, but also let the ugly ones humble you and anchor your next week.
Adapt your process to real life:
Swing trading while working? Happens. Family? Kids? You can STILL win long-term—just make the review and tracking match your schedule, not some internet hustle template.
Build the feedback loop
When you slip, note it fast and tweak (don’t obsess). When you nail it, reward yourself—not with risk, but acknowledgment.
How do you know it works? Because it’s kept me in profit while teaching hundreds of traders to turn routines into actual results.
If you’re battling for consistency DM me “Tools” or drop it in the comments. I’ll send my simple routines that changed the game for me and dozens of traders.
Let’s build consistency that lasts and celebrate small wins relentlessly.
If I can help, I will.
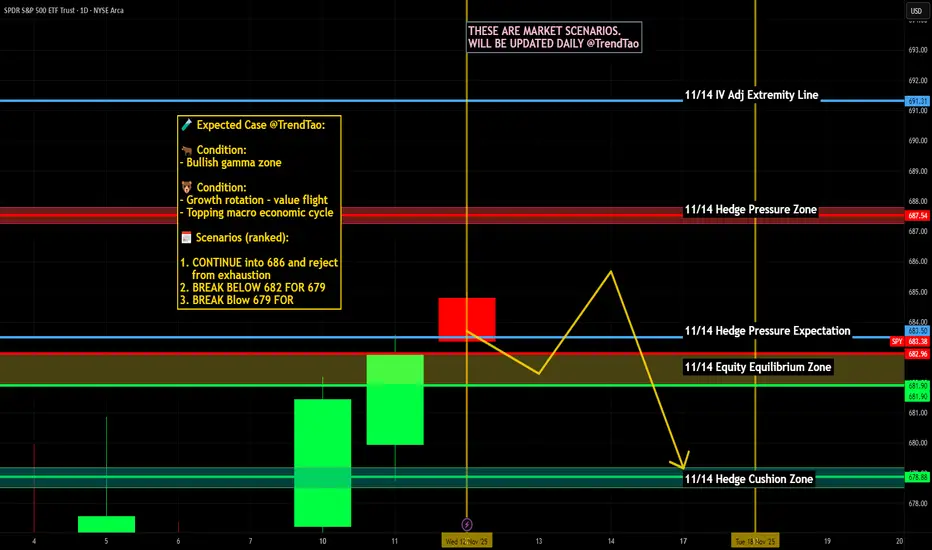
$SPY $SPX Scenarios — Thursday, Nov 13, 2025🔮 AMEX:SPY SP:SPX Scenarios — Thursday, Nov 13, 2025 🔮
🌍 Market-Moving Headlines
🚨 Inflation spotlight (⚠️ delay risk): October CPI and Jobless Claims — both subject to government shutdown delay — were originally scheduled for release this morning. Markets may stay cautious or reactive to leaks and private inflation trackers in the absence of official prints.
💬 Fed rotation continues: A packed Fed lineup — Mary Daly, John Williams, Kashkari, Hammack, and Bostic — will steer tone across the day, shaping expectations for December guidance.
📉 Budget check: A fresh federal deficit report (-$215B) adds to the fiscal backdrop narrative, though reaction may stay muted if major data doesn’t hit.
📊 Key Data and Events (ET)
⏰ 8:00 AM — Mary Daly (San Francisco Fed) speech
⏰ ⚠️ 8:30 AM — Consumer Price Index (Oct) | +0.3% MoM | +3.1% YoY (subject to delay)
⏰ ⚠️ 8:30 AM — Core CPI (Oct) | +0.3% MoM | +3.1% YoY (subject to delay)
⏰ ⚠️ 8:30 AM — Initial Jobless Claims (Nov 8) | 225,000 forecast (subject to delay)
⏰ 9:20 AM — John Williams (NY Fed) welcoming remarks
⏰ 10:25 AM — Neel Kashkari (Minneapolis Fed) opening remarks
⏰ 12:15 PM — Alberto Musalem (St. Louis Fed) speech
⏰ 12:20 PM — Beth Hammack (Cleveland Fed) speech
⏰ 2:00 PM — Monthly U.S. Federal Budget (Oct) | -$215B deficit vs -$257.5B prior
⏰ 3:20 PM — Raphael Bostic (Atlanta Fed) speech
⚠️ Note:
CPI and Jobless Claims carry the highest market impact this week — but both remain at risk of delay due to the ongoing federal data blackout. Fed speakers and any CPI proxies (like Cleveland Fed’s nowcast) will drive intraday volatility instead.
⚠️ Disclaimer: Educational and informational only — not financial advice.
📌 #SPY #SPX #trading #CPI #inflation #Fed #Williams #Bostic #Musanlem #Hammack #macro #markets #yields #shutdown
CADJPY FREE SIGNAL|LONG|
✅CADJPY swept equal lows and shifted structure bullish after tapping a key discount zone. Price is likely to rebalance inefficiency toward premium liquidity above.
—————————
Entry: 110.512
Stop Loss: 110.239
Take Profit: 110.969
Time Frame: 4H
—————————
LONG🚀
✅Like and subscribe to never miss a new idea!✅

NZD-USD Bearish Wedge! Sell!
Hello,Traders!
NZDUSD formed a bearish wedge structure and broke its lower boundary, hinting at bearish continuation toward the next liquidity level resting below. Time Frame 4H.
Sell!
Comment and subscribe to help us grow!
Check out other forecasts below too!
Disclosure: I am part of Trade Nation's Influencer program and receive a monthly fee for using their TradingView charts in my analysis.

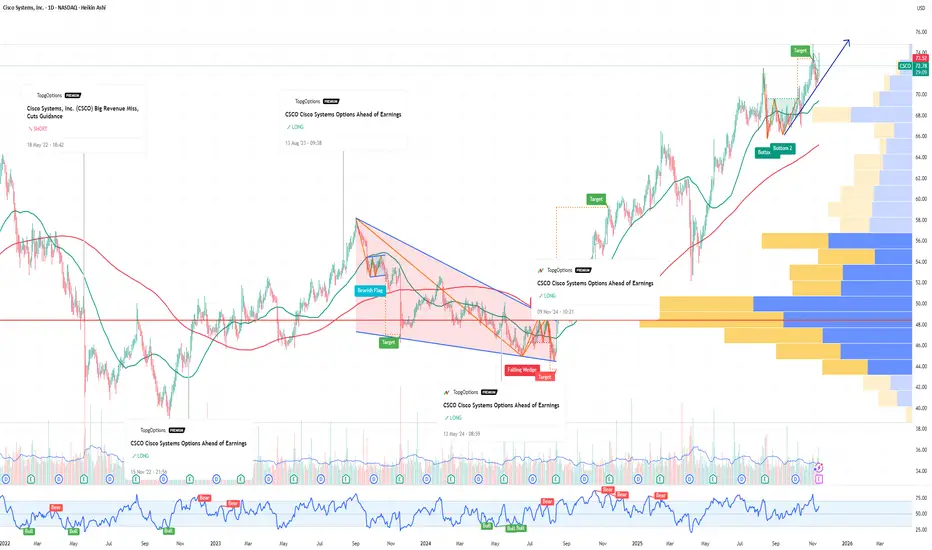
CSCO Cisco Systems Options Ahead of EarningsIf you haven`t bought CSCO before the previous earnings:
Now analyzing the options chain and the chart patterns of CSCO Cisco Systems prior to the earnings report this week,
I would consider purchasing the 74usd strike price Calls with
an expiration date of 2025-11-14,
for a premium of approximately $1.75.
If these options prove to be profitable prior to the earnings release, I would sell at least half of them.
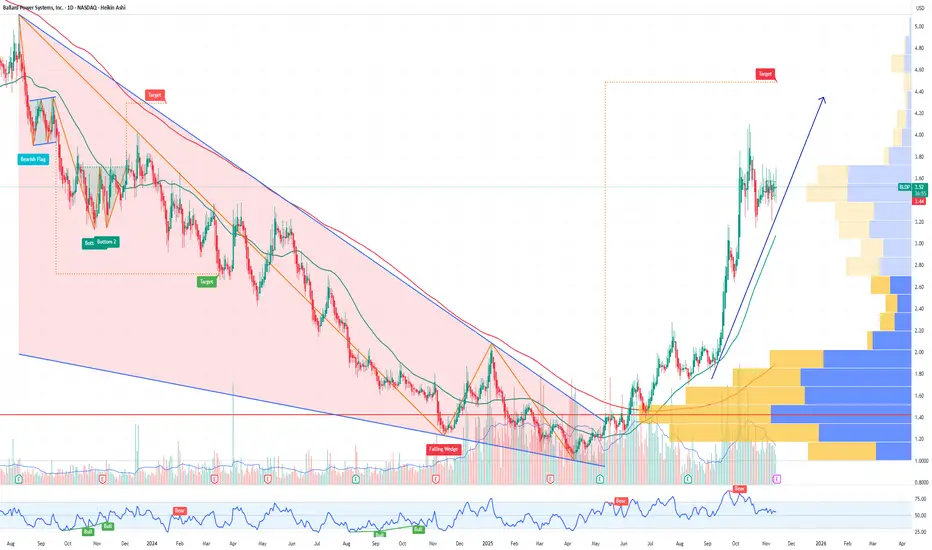
BLDP Ballard Power Systems Options Ahead of EarningsAnalyzing the options chain and the chart patterns of BLDP Ballard Power Systems prior to the earnings report this week,
I would consider purchasing the 3usd strike price Calls with
an expiration date of 2026-2-20,
for a premium of approximately $1.00.
If these options prove to be profitable prior to the earnings release, I would sell at least half of them.
SLS SELLAS Life Sciences Group Options Ahead of EarningsAnalyzing the options chain and the chart patterns of SLS SELLAS Life Sciences Group prior to the earnings report this week,
I would consider purchasing the 3.50usd strike price Calls with
an expiration date of 2027-1-15,
for a premium of approximately $0.52.
If these options prove to be profitable prior to the earnings release, I would sell at least half of them.

ONDS Ondas Holdings Options Ahead of EarningsAnalyzing the options chain and the chart patterns of ONDS Ondas Holdings prior to the earnings report this week,
I would consider purchasing the 10usd strike price Calls with
an expiration date of 2028-1-21,
for a premium of approximately $3.95.
If these options prove to be profitable prior to the earnings release, I would sell at least half of them.

BOND Break Out?💣 Bonds Near a Major Breakout — And It’s Not Bullish for Risk Assets
We’re approaching a critical breakout zone in bonds.
At first glance, you might think: “High demand for U.S. debt? That’s great! Higher bond prices, lower yields, cheaper interest payments!”
That’s Trump-math logic — the same kind that says prices are “down 300%.” 😅 You can only go down 100%, folks. No matter where the price goes!
Here’s the real story:
For bond prices to surge, investors must be running from risk. Big money managers don’t dump billions into a $250k FDIC-insured savings account 😅 — they rotate into Treasuries when fear spikes.
That’s a double whammy:
1️⃣ Reducing margin
2️⃣ Stocks and other risk assets get liquidated.
When this rotation accelerates, expect risk assets to crater — the “buy-the-dip,” “crypto-Lambo bros,” “GME, AI memers” & "Colorful Chartists" crowd gets ANNIHILATED!
All of that from this one silly chart? No, there is no single holy grail of an analysis chart. Just a piece of the puzzle.
Smart money is moving to safety. Don’t get caught holding the bag. Keep an eye on this chart!
Thank you ALL FOR getting me up to 5,000 followers!! ))
Click boost, follow, comment nicely for more authentic, no BS, raw analysis. Let's get to 6,000 followers. ))

ABT Update📊 ABT Update
ABT is approaching a big red resistance zone 🔴
It could be wise to take some profits before price reaches this level 💰
Sellers may step in around this zone and push the price down ⚠️
Watch for rejection signs or bearish candles near resistance 👀

TAKE Update📊 TAKE Update
TAKE is testing the red resistance zone 🔴
If it breaks out above, the first target will be the green line level 🟢
Momentum is building — watch for a confirmed breakout candle 📈

LINEA Update📊 LINEA Update
LINEA failed once again to break out above the red resistance zone 🔴
This shows that sellers are still strong at this level, keeping pressure on the price ⚠️
A clean breakout above the zone would be needed to confirm bullish momentum 📈

POPCAT Update📊 POPCAT Update
POPCAT is facing a strong red resistance zone 🔴 on the daily time frame ⏰
Until it breaks out above this level, there’s no major sign of a bullish reversal trend ⚠️
Patience is key — wait for a clear breakout confirmation before jumping in 📉➡📈

XRP Update📊 XRP Update
XRP is approaching the green support zone 🟢
Now the question is — will it bounce or break below? ⚖️
If it holds, we could see a strong rebound 📈
But if it breaks, expect a deeper correction 🔻

PLTR CAUTION!PLTR is at a key critical area, which has already given a warning shot to bulls.
We have a complete rising wedge structure with 3 waves up and a hook that has already cracked! Within it, we also have a head and shoulders at the top, which is bearish. (H&S not a top is usually a continuation pattern.) AS is always the case, if the overall market is not ready to head south, it will fail as a full-on reversal pattern.
I urge CAUTION!! to PLTR bulls.
For shorts, you need to see a crack, gap fill, plus follow through for a new lower low in a small time frame. You can't have a reversal without lower lows and lower highs.
Thank you ALL FOR getting me up to 5,000 followers!! ))
Click boost, follow, comment nicely for more authentic, no BS, raw analysis. Let's get to 6,000 followers. ))
