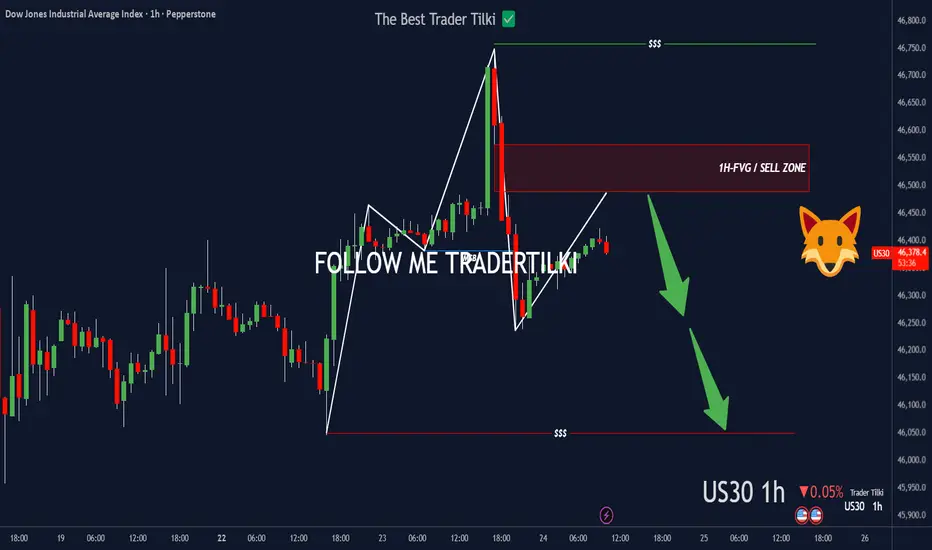
US30 left a footprint—FVG’s callin’.Hey Guys,
Once US30 hits my SELL zone, I’m pulling the trigger—targeting 46049.0
• Entry: 46574.5.0 or 46488.9
Set the stop point according to your own margin, my friends.
Every like you drop pushes me to share more setups like this. Big thanks to everyone showing support!
Trading
World gold prices under pressure to fallGold was pressured lower mainly due to the strong USD. The DXY index - measuring the greenback's volatility - increased 0.6% compared to a basket of six major currencies in the world to 97.82 points. The USD increased in value despite investors still betting almost certainly that the US Federal Reserve (Fed) will cut interest rates at both meetings in October and December.
The USD increased in value as some other major currencies were pressured by less positive economic information.
Deutsche Bank continues to maintain its view that gold prices are likely to reach $4,000/ounce next year. Accordingly, the resumption of the Fed's easing cycle, while the European Central Bank (ECB) pauses interest rate cuts and the Bank of England (BoE) begins to "hawkish" will put pressure on the USD, weakening the high-yield advantage, thereby reducing demand for holding the greenback.
Gold is also supported by buying demand from central banks, including the People's Bank of China (PBOC).
In 2026, Deutsche forecasts that gold could continue to increase by 24%, mainly due to central bank demand and a favorable macroeconomic environment.

BTCUSD on the 30m timeframe1. Trend Context
BTCUSD on the 30m timeframe remains in a clear downtrend, forming consistent Lower Highs and Lower Lows.
2. Key Zones
SZ (Supply Zone): 114,250 – 114,750. Origin of the strong selloff, major resistance if price retraces upward.
SR (Structure Reversal): 113,000 – 113,250. Previously marked a short-term structural shift, now likely to act as dynamic resistance.
DZ (Demand Zone): 111,200 – 111,750. Price is currently testing this zone, which serves as short-term support.
3. Trading Scenarios
If DZ holds, a short-term bounce toward SR is possible.
If price rejects at SR, it offers a favorable short setup in line with the prevailing downtrend.
If DZ breaks, the downtrend may extend with a target around 110,000 or lower.
Please like and comment below to support our traders. Your reactions will motivate us to do more analysis in the future 🙏✨

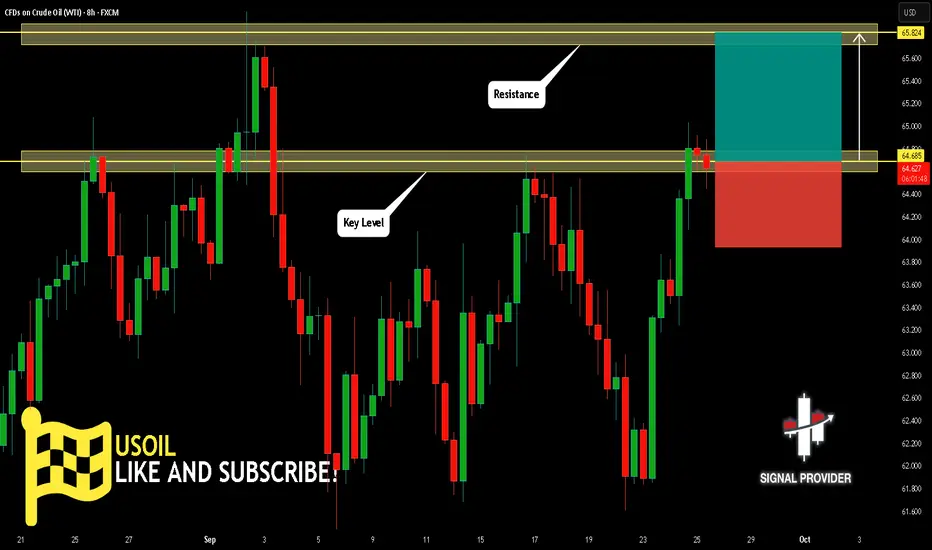
USOIL Is Bullish! Long!
Please, check our technical outlook for USOIL.
Time Frame: 8h
Current Trend: Bullish
Sentiment: Oversold (based on 7-period RSI)
Forecast: Bullish
The market is trading around a solid horizontal structure 64.685.
The above observations make me that the market will inevitably achieve 65.824 level.
P.S
The term oversold refers to a condition where an asset has traded lower in price and has the potential for a price bounce.
Overbought refers to market scenarios where the instrument is traded considerably higher than its fair value. Overvaluation is caused by market sentiments when there is positive news.
Like and subscribe and comment my ideas if you enjoy them!
EURUSD Is Very Bullish! Buy!
Here is our detailed technical review for EURUSD.
Time Frame: 3h
Current Trend: Bullish
Sentiment: Oversold (based on 7-period RSI)
Forecast: Bullish
The market is testing a major horizontal structure 1.173.
Taking into consideration the structure & trend analysis, I believe that the market will reach 1.179 level soon.
P.S
We determine oversold/overbought condition with RSI indicator.
When it drops below 30 - the market is considered to be oversold.
When it bounces above 70 - the market is considered to be overbought.
Like and subscribe and comment my ideas if you enjoy them!

AUDUSD Is Going Up! Long!
Take a look at our analysis for AUDUSD.
Time Frame: 9h
Current Trend: Bullish
Sentiment: Oversold (based on 7-period RSI)
Forecast: Bullish
The market is approaching a key horizontal level 0.658.
Considering the today's price action, probabilities will be high to see a movement to 0.668.
P.S
Overbought describes a period of time where there has been a significant and consistent upward move in price over a period of time without much pullback.
Like and subscribe and comment my ideas if you enjoy them!

USDCHF Will Fall! Short!
Please, check our technical outlook for USDCHF.
Time Frame: 12h
Current Trend: Bearish
Sentiment: Overbought (based on 7-period RSI)
Forecast: Bearish
The market is approaching a significant resistance area 0.795.
Due to the fact that we see a positive bearish reaction from the underlined area, I strongly believe that sellers will manage to push the price all the way down to 0.786 level.
P.S
Please, note that an oversold/overbought condition can last for a long time, and therefore being oversold/overbought doesn't mean a price rally will come soon, or at all.
Like and subscribe and comment my ideas if you enjoy them!

GBPUSD Will Go Down! Sell!
Please, check our technical outlook for GBPUSD.
Time Frame: 15m
Current Trend: Bearish
Sentiment: Overbought (based on 7-period RSI)
Forecast: Bearish
The market is trading around a solid horizontal structure 1.346.
The above observations make me that the market will inevitably achieve 1.345 level.
P.S
Overbought describes a period of time where there has been a significant and consistent upward move in price over a period of time without much pullback.
Like and subscribe and comment my ideas if you enjoy them!

GOLD SHORT FROM RESISTANCE
GOLD SIGNAL
Trade Direction: short
Entry Level: 3,743.82
Target Level: 3,553.39
Stop Loss: 3,870.43
RISK PROFILE
Risk level: medium
Suggested risk: 1%
Timeframe: 1D
Disclosure: I am part of Trade Nation's Influencer program and receive a monthly fee for using their TradingView charts in my analysis.
✅LIKE AND COMMENT MY IDEAS✅

EUR/GBP BEARS ARE GAINING STRENGTH|SHORT
Hello, Friends!
EUR/GBP pair is in the downtrend because previous week’s candle is red, while the price is clearly rising on the 12H timeframe. And after the retest of the resistance line above I believe we will see a move down towards the target below at 0.867 because the pair is overbought due to its proximity to the upper BB band and a bearish correction is likely.
Disclosure: I am part of Trade Nation's Influencer program and receive a monthly fee for using their TradingView charts in my analysis.
✅LIKE AND COMMENT MY IDEAS✅

AUD/CAD BULLS ARE GAINING STRENGTH|LONG
Hello, Friends!
AUD/CAD pair is trading in a local uptrend which know by looking at the previous 1W candle which is green. On the 4H timeframe the pair is going down. The pair is oversold because the price is close to the lower band of the BB indicator. So we are looking to buy the pair with the lower BB line acting as support. The next target is 0.914 area.
Disclosure: I am part of Trade Nation's Influencer program and receive a monthly fee for using their TradingView charts in my analysis.
✅LIKE AND COMMENT MY IDEAS✅

BELDEX - Privacy Coin or Manipulated Pump - Should I Join In?With the charts, we always focus on two things: thefundamental analysis and thetechnical analysis. On one side, the breakout above 0.0824–0.0859 looked clean, momentum was there, and the market structure shifted bullish. However, the token gains a $700M market cap but has only ~1,000 holders. That mismatch actually is a problem
BDX is bullish based on current price action and trading signals. The oscillators and moving averages flash Strong Buy. If I just looked at that, I could say this is a simple uptrend and an easy trade. But price candles show long wicks, sharp pushes, and limited corrections. That is not the behavior of natural accumulation. That is the footprint of fast money in and out.
If I were to focus only on the short term, I’d seen the price exeeded the Resistance level (0.081-0.086) and bought it. But if I focus on the bigger picture, it looks like BDX is being manipulated by concentrated capital. That’s why it keeps climbing while the broader crypto market is stuck at Fear & Greed Index 41. The rest of the market is tired, but BDX is still running. Unusual, right?
As traders, we cannot beat the market. But we don’t need to beat it; we only need to make money. And there are many ways. With BDX, the way is simple: accept this is high risk, short-term momentum. Don’t marry the coin, don’t believe the hype. If you play it, you play the trend.
For me, that means:
Entry (EP): 0.087 – 0.090
Stop Loss (SL): 0.078
Target (TP): 0.103, 0.14, 0.16, 0.19
That’s how you treat a setup. Manage risk. No more than 5–10% of capital in such a trade. Because if this is truly manipulated, it can disappear just as fast as it rose.
If you can’t make money slow, you won’t make it fast. BDX might be exciting right now, but excitement fades. Trading is not about chasing pumps; it’s about managing risk and staying alive.
So, should you join in? Only if you know your plan before you press buy.
Thanks for reading. Stay sharp.
TheCryptoFire.

Introduction: The Timeless Role of Gold in Global Trade1. The Enduring Allure of Gold
From the earliest days of civilization, gold has held a unique place in human society. Unlike other metals, gold does not tarnish, corrode, or lose its luster. Its rarity, beauty, and durability gave it symbolic and economic importance across cultures. While silver, copper, and iron found widespread use in tools and daily necessities, gold was reserved for temples, thrones, crowns, and coins. Its association with divinity, immortality, and wealth made it the ultimate store of value.
In global trade, gold became more than just a precious metal—it evolved into a universal medium of exchange, a unit of account, and a reserve of wealth. Whether in ancient Mesopotamia, medieval Europe, or modern-day financial markets, gold has been deeply interwoven with the dynamics of commerce and global economic power.
2. Gold in Early Civilizations and Trade Networks
2.1 Ancient Mesopotamia and Egypt
Records from Mesopotamia (around 3000 BCE) reveal the use of gold in temple offerings, jewelry, and early forms of trade settlement. In Egypt, gold mining in Nubia became a cornerstone of the pharaohs’ wealth. Egyptian traders exchanged gold for cedarwood from Lebanon, incense from Arabia, and lapis lazuli from Afghanistan.
2.2 India and China
India, often referred to as the “Golden Bird,” was historically one of the world’s largest consumers of gold. Gold was central to Hindu rituals, dowries, and wealth preservation. Ancient trade routes such as the Silk Road facilitated the flow of gold into China, where it was prized in ornaments and as tribute currency.
2.3 The Mediterranean World
For the Greeks and Romans, gold coinage was critical in organizing commerce across vast empires. The Roman aureus became an international currency, accepted in transactions stretching from Britain to Asia Minor. Roman conquest and expansion were often driven by the desire to secure gold mines and trading routes.
3. Gold as the Foundation of Monetary Systems
3.1 Emergence of Gold Coinage
The invention of standardized gold coins by the Lydians (7th century BCE) revolutionized trade. Coins allowed merchants and states to conduct transactions with a reliable measure of value. This innovation spread across civilizations, creating trust in cross-border exchanges.
3.2 Medieval Europe and Islamic Trade
Gold coinage resurfaced in medieval Europe with the Florentine florin and Venetian ducat, which dominated European and Mediterranean trade. Meanwhile, Islamic caliphates issued the gold dinar, which facilitated trans-Saharan trade in salt, slaves, and textiles. Gold mined in West Africa, especially from Mali and Ghana, fueled Mediterranean commerce and even influenced the rise of cities such as Timbuktu.
3.3 The Gold Standard Era
By the 19th century, gold became the backbone of international finance. The gold standard, formally adopted in Britain in 1821, linked national currencies directly to fixed amounts of gold. This system enabled stable exchange rates and fueled global trade expansion during the Industrial Revolution. The reliability of gold-backed currencies helped finance colonial empires, international investments, and the integration of global markets.
4. Gold and the Age of Exploration
4.1 The Spanish Conquest and the “Gold Rush”
The European Age of Exploration was driven largely by the pursuit of gold. The Spanish conquest of the Americas in the 16th century brought enormous quantities of gold and silver into Europe. Ships laden with bullion crossed the Atlantic, fueling European economies but also causing inflation known as the “Price Revolution.”
4.2 Global Trade Routes and Colonial Rivalries
Control of gold mines and trade routes became a key motive for colonization. The Portuguese, Dutch, and British expanded their empires to secure resources. Gold became not just a means of trade but a strategic tool in geopolitical rivalries, funding wars, navies, and the rise of mercantile powers.
5. Gold as a Symbol of Trust and Stability
5.1 Safe Haven Across Crises
In times of war, economic collapse, or inflation, gold retained value when paper money or credit systems failed. For example, during World War I and the Great Depression, individuals and nations turned to gold as the ultimate refuge.
5.2 Bretton Woods and the U.S. Dollar
After World War II, the Bretton Woods system pegged global currencies to the U.S. dollar, which in turn was tied to gold at $35 per ounce. This arrangement made gold the anchor of global trade and financial stability. Even after the U.S. ended dollar-gold convertibility in 1971, central banks continued to hold vast gold reserves as confidence assets.
6. Gold in Modern Global Trade
6.1 The Post-Gold Standard World
Although fiat currencies dominate today, gold still plays a critical role. Central banks across the world maintain gold reserves as part of their foreign exchange holdings. The International Monetary Fund (IMF) also holds significant gold stocks, underscoring its importance in global finance.
6.2 Gold in International Settlements
Even in the modern era, gold is sometimes used in bilateral trade agreements, particularly where currency trust issues arise. Countries facing sanctions or inflation often rely on gold to bypass traditional financial systems. For instance, gold has facilitated trade in energy and commodities among countries excluded from dollar-based systems.
6.3 Commodities and Investment
Gold remains one of the most actively traded commodities worldwide. Futures contracts, exchange-traded funds (ETFs), and bullion markets make it integral to global finance. In addition, gold jewelry and artifacts continue to represent cultural and social wealth in regions like India, the Middle East, and East Asia.
7. Cultural and Symbolic Dimensions of Gold in Trade
7.1 Gold Beyond Economics
Gold’s value is not purely economic—it embodies cultural, religious, and symbolic meanings. From wedding jewelry in India to lunar offerings in China, gold has deep cultural associations that sustain its demand and global trade relevance.
7.2 Festivals and Seasonal Demand
Global gold trade is strongly influenced by cultural events such as Indian weddings, Diwali, and Chinese New Year. Seasonal demand cycles reflect how gold straddles both commerce and tradition, shaping global pricing and trade flows.
8. Geopolitics and the Strategic Role of Gold
8.1 Central Banks and Reserve Power
Central banks worldwide are increasing gold holdings to reduce dependence on the U.S. dollar. Nations like China, Russia, and India have steadily added to their reserves, viewing gold as a hedge against geopolitical risks and currency volatility.
8.2 Gold in Sanctions and Trade Wars
Gold often functions as a sanctions-proof currency. Countries excluded from international banking systems, such as Iran or Venezuela, turn to gold to facilitate trade and preserve economic stability. This role underscores gold’s timeless utility in bypassing political and financial restrictions.
9. Gold in the Digital and Green Economy Era
9.1 Gold and Technology
Gold is not only a financial asset but also a key industrial metal. Its conductivity, malleability, and corrosion resistance make it vital in electronics, medical devices, and aerospace. This growing industrial use links gold directly to modern technological trade.
9.2 Gold-Backed Digital Currencies
With the rise of blockchain and digital finance, gold-backed cryptocurrencies and tokens are emerging as trade instruments. These combine the stability of gold with the efficiency of digital transfer, potentially reshaping global trade settlements.
9.3 Sustainability and Ethical Trade
Modern concerns about environmental impact and human rights in gold mining have reshaped trade policies. Initiatives like “Fairtrade Gold” and traceability systems aim to ensure that global gold trade aligns with sustainable development goals.
10. Conclusion: Gold’s Timeless Role in Global Trade
Gold’s journey through history reflects its dual nature as both a cultural symbol and an economic pillar. From ancient Egyptian temples to Wall Street vaults, from the Roman aureus to blockchain-backed tokens, gold has retained its ability to inspire trust, drive exchange, and preserve wealth.
In global trade, gold has been:
A medium of exchange connecting ancient empires.
A foundation for monetary systems under the gold standard.
A geopolitical tool shaping colonization and wars.
A safe haven asset during crises.
A cultural cornerstone sustaining demand across civilizations.
A modern commodity integral to finance, technology, and industry.
Even in a world dominated by fiat money, digital currencies, and advanced financial systems, gold remains indispensable. Its timeless role lies not just in its physical properties, but in the enduring human belief in its value. As global trade evolves in the 21st century—with digitalization, geopolitics, and sustainability shaping commerce—gold continues to shine as a bridge between tradition and innovation, ensuring its place in the heart of global exchange for centuries to come.
Why Emerging Economies Are Driving Global ProfitsPart 1: Understanding Emerging Economies
1.1 Definition of Emerging Economies
Emerging economies are countries transitioning from low-income to middle- or high-income status. They typically feature:
Rapid GDP growth
Increasing industrialization
Expanding consumer base
Integration into global markets
Structural reforms improving business conditions
Examples include China, India, Brazil, South Africa, Mexico, Turkey, Vietnam, and Indonesia. Collectively, they form key groups such as the BRICS (Brazil, Russia, India, China, South Africa) and MINT (Mexico, Indonesia, Nigeria, Turkey).
1.2 Why They Matter Today
Emerging markets contribute over 60% of global GDP growth.
They account for the majority of global trade growth.
Hundreds of millions of people are entering the middle class, becoming powerful consumers.
Part 2: Historical Shifts in Global Profit Centers
2.1 Post-WWII Era: Developed Market Dominance
After WWII, developed nations rebuilt with the help of the Marshall Plan, became hubs of manufacturing, and dominated global profits. Emerging economies were peripheral, often tied to resource exports.
2.2 1980s–1990s: Liberalization & Globalization
China opened its economy in 1978, setting the stage for massive manufacturing growth.
India liberalized in 1991, spurring IT and service sector expansion.
Eastern Europe joined global trade networks after the Soviet Union’s fall.
This era marked the shift of supply chains toward emerging economies.
2.3 2000s Onwards: The Rise of Emerging Market Giants
China became the “world’s factory”, exporting everything from textiles to electronics.
India became the “back office of the world”, leading IT services and outsourcing.
Brazil and Russia leveraged commodities to drive global profits.
Southeast Asia became a hub for electronics, shipping, and consumer manufacturing.
Today, multinational profits are increasingly tied to emerging market demand rather than just low-cost production.
Part 3: Structural Drivers of Profit Growth
3.1 Demographic Advantages
Young, growing populations in countries like India, Indonesia, and Nigeria fuel workforce availability and consumption.
By 2030, emerging markets will account for two-thirds of the global middle class.
3.2 Urbanization & Infrastructure Development
Rapid urbanization is creating megacities in Asia and Africa.
Infrastructure investments—roads, ports, airports, digital connectivity—unlock new markets.
Real estate, transport, and construction generate huge profits for companies.
3.3 Consumer Market Expansion
Rising incomes = growing demand for consumer goods, services, healthcare, and technology.
Emerging markets are becoming demand centers, not just supply bases.
Example: India’s smartphone penetration skyrocketed due to affordable mobile internet.
3.4 Digital Leapfrogging
Many emerging economies skipped traditional development stages and adopted mobile-first, digital solutions.
Mobile banking in Africa, e-commerce in Southeast Asia, and super-apps in China illustrate this.
These innovations generate new ecosystems of profit.
3.5 Global Supply Chain Integration
Companies diversify manufacturing beyond developed nations into Asia, Latin America, and Africa.
“China+1 strategy” pushes investments into Vietnam, India, and Indonesia.
This integration spreads profits across emerging economies.
Part 4: Sectoral Profit Engines
4.1 Technology & Digital Economy
China: home to Alibaba, Tencent, Huawei.
India: global IT services hub with Infosys, TCS, Wipro.
Southeast Asia: booming e-commerce platforms like Shopee, Lazada, Tokopedia.
The digital economy is a major source of profit, fueled by young, tech-savvy consumers.
4.2 Manufacturing & Industrial Growth
China leads global electronics and machinery production.
Vietnam and Bangladesh dominate textiles and apparel exports.
India is growing in pharmaceuticals, automobiles, and electronics.
4.3 Energy & Commodities
Brazil, Russia, and South Africa drive profits in oil, gas, minerals, and agriculture.
Emerging markets are both producers (exporting raw materials) and consumers (fueling demand).
4.4 Financial Services
Microfinance and digital banking in Africa and Asia empower new customers.
Fintech innovation (UPI in India, M-Pesa in Kenya) creates profit opportunities.
4.5 Healthcare & Education
Rising incomes = higher demand for private healthcare and education.
Medical tourism in India, Thailand, and Mexico is booming.
Emerging market pharmaceutical companies are gaining global market share.
Part 5: Why Multinationals Depend on Emerging Markets
5.1 Revenue Diversification
Western companies increasingly rely on emerging markets for growth.
Example: Apple, Coca-Cola, and Unilever earn significant profits from Asia and Africa.
5.2 Scale of Demand
Emerging markets offer hundreds of millions of consumers in a single country.
Example: India’s population (1.4 billion) provides unmatched consumer scale.
5.3 Innovation Opportunities
Companies innovate products suited for cost-sensitive, value-driven markets.
Example: Tata’s $2,500 Nano car, or Nestlé’s single-serve sachets of coffee in rural markets.
5.4 Strategic Partnerships
Multinationals partner with local firms for distribution, branding, and market entry.
Example: Walmart’s investment in Flipkart (India).
Part 6: Challenges and Risks
6.1 Political & Regulatory Uncertainty
Sudden policy changes, trade barriers, and corruption can affect profits.
6.2 Infrastructure Gaps
Logistics and energy shortages can constrain business growth.
6.3 Currency Volatility
Emerging market currencies can be unstable, impacting corporate earnings.
6.4 Competition from Local Firms
Domestic champions in China and India rival multinational dominance.
6.5 Environmental & Social Concerns
Rapid industrialization raises sustainability challenges.
Firms must balance profits with ESG commitments.
Part 7: Future Outlook
7.1 Emerging Markets as Global Growth Engines
By 2050, China and India together could account for nearly 40% of global GDP.
Africa is set to be the next frontier, with a billion young consumers by 2040.
7.2 Green Energy & Sustainability
Transition to renewable energy creates profit opportunities in solar, wind, and EVs.
India and China are among the world’s biggest renewable investors.
7.3 Digital Transformation
Artificial intelligence, fintech, and e-commerce will accelerate profit growth.
Emerging markets are not just catching up—they are leading in many niches.
7.4 Multipolar World Order
Emerging economies are shaping trade, investment, and geopolitics.
BRICS+ expansion signals a new era of South-South cooperation.
Conclusion
Emerging economies are no longer “peripheral players.” They have become the epicenter of global profits, thanks to:
Rapid economic growth
Expanding consumer markets
Technological leapfrogging
Integration into global trade
Yes, risks remain—political instability, infrastructure gaps, and volatility—but the profit story is undeniable. For businesses, investors, and policymakers, the rise of emerging economies is the defining story of the 21st century.
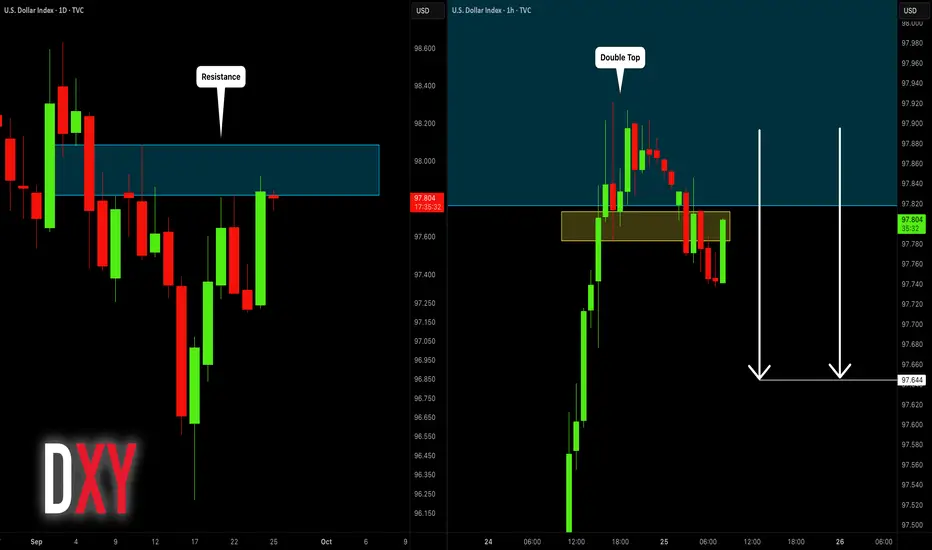
DOLLAR INDEX (DXY): Overbought Market & Pullback
Dollar Index is testing a major daily resistance cluster now.
With a high probability, the market will retrace from that.
A double top pattern that was formed on an hourly time frame
indicates a clear overbought state.
The index may drop to 97.65
❤️Please, support my work with like, thank you!❤️
I am part of Trade Nation's Influencer program and receive a monthly fee for using their TradingView charts in my analysis.
XAUUSD – Pressure at 3777 zone XAUUSD – Pressure at 3777 zone, adjustment scenario and trend-following buy
Technical Analysis
After a strong upward move, gold (XAUUSD) is now approaching the resistance zone of 3777–3780, where it converges with the Fibonacci expansion cluster and the old resistance structure. This is a price area prone to short-term selling pressure, and a decisive point for the next trend.
EMA200 (H1: 3685) is still clearly sloping upwards → the main trend remains upward, but the market is in a state of range expansion, with a potential adjustment phase before continuing upward.
RSI (14) is currently oscillating around 57–60, indicating that the upward momentum has cooled, not yet entering the overbought zone but posing a risk of divergence if a new peak is formed without accompanying momentum.
Volume Profile levels and support zones 3738–3740 / 3719–3722 / 3661–3665 will be where buyers can react to protect the main trend.
Trading Scenarios
Scenario 1 – Sell adjustment at resistance zone:
Entry: 3777–3780
SL: 3784
TP: 3755 – 3742 – 3730 – 3705
Scenario 2 – Short-term scalping buy:
Entry: 3738–3740
SL: 3734
TP: 3747 – 3755 – 3770
Scenario 3 – Trend-following buy (priority when deep adjustment):
Entry: 3719–3722
SL: 3715
TP: 3728 – 3740 – 3765 – 3780
Price Zones to Watch
3777–3780: critical resistance, potential Sell zone.
3738–3740: nearby support, suitable for scalping buy.
3719–3722: main Buy zone for recovery, confluence of support structure.
3705: deep support, target if adjustment trend expands.
Outlook
The major trend for gold still leans towards upward, however, the 3777–3780 zone currently plays a decisive role. Sellers can take advantage of short-term Sell to catch the adjustment phase, while buyers should wait for prices to pull back to support zones to enter trend-following orders.
This is a reference scenario based on technical analysis, not an investment recommendation. Stay tuned for earlier analyses and prepare well for your trading plan.

LiamTrading – XAUUSD IN-DEPTH ANALYSIS OF CURRENT TRENDSLiamTrading – XAUUSD Today's Scenario: Opportunities at Key Price Levels
Gold continues its strong upward momentum, currently oscillating around the 376x–377x range after a series of breakouts. The technical structure on the H1 chart indicates the market is forming clear resistance and support zones, suitable for short-term trading plans.
Technical Analysis
RSI is cooling off from high levels, indicating the potential for a short-term correction.
The upper price zone around 3818–3821 is a strong confluence of resistance, coinciding with wave peaks and Fibonacci extensions, making it prone to selling reactions.
Conversely, the support zones at 373x and 370x show dense liquidity, serving as potential buying points when prices correct.
The short-term Dow structure still leans towards an uptrend, but attention is needed at the sell confirmation zone if gold fails at the peak.
Trading Plan Reference
Sell Zone: 3818 – 3821, SL 3828, TP 3805 – 3785 – 3760 – 3732 – 3650
Buy Scalping: 3728 – 3731, SL 3723, TP 3750 – 3777 – 3790
Buy Zone: 3706 – 3709, SL 3700, TP 3725 – 3738 – 3750 – 3777 – 3790
In summary, the main trend still favors an uptrend, but with gold approaching strong resistance zones, the likelihood of a correction is high. Traders should patiently wait for reactions at the marked zones for optimal entry, while managing risk tightly.
This is my personal view on XAUUSD. If you're interested in gold scenarios, follow me for the fastest updates.

ES-mini Futures - (SPX) Analyses for Sep 25Market drivers for Thu, Sep 25 (ET)
• 8:30 — GDP 2Q (Third estimate) + Corporate Profits (annual update). Official BEA release.
• 8:30 — Durable Goods (Advance, Aug). Census M3 advance report (release time 8:30 a.m. ET).
• 8:30 — Initial Jobless Claims (weekly). DoL weekly claims (standard Thu 8:30 a.m. ET cadence).
• 10:00 — Existing-Home Sales (Aug). National Association of Realtors, scheduled for Thu 10:00 a.m. ET.
• Fed speakers — Vice Chair Bowman: 9:00 a.m. (Economic Outlook) and 1:00 p.m. (Approach to Monetary Policy).
• Treasury — Multiple bill auctions scheduled for Sep 25 (4-, 6-, 13-, 26-, 52-week). Watch rate/curve reaction around midday.
• (Context) Atlanta Fed GDPNow next update Fri, Sep 26 (used by markets for GDP tracking).
Risk windows to respect: 8:30 (data cluster) and 10:00 (housing). Avoid fresh entries ~5m before/after these prints; expect liquidity gaps.
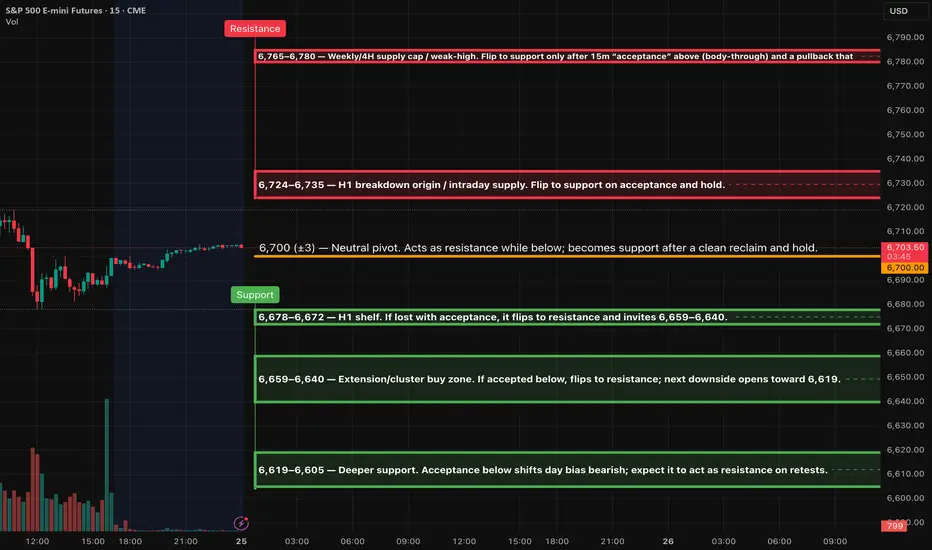
Overall bias & PA projection (overnight → tomorrow)
Structure: Uptrend on higher timeframes, but near a weekly/4H supply cap ~6,76x–6,78x with a fresh H1 pullback printed.
Bias into NY: Balanced-to-slightly-bullish if 6,67x holds. Below that, rotation toward the extension cluster 6,66x–6,64x likely before buyers try again.
Overnight projection: Asia/London likely to range 6,68x–6,70x. A London stop-run under 6,678 that quickly reclaims sets the stage for NY bounce. Acceptance below 6,672 opens 6,659 → 6,640 → 6,619.
NY session — A++ setups (Level-KZ Protocol 15/5/1)
Management rules (as usual): TP1 = next opposing MAJOR level; close 70% at TP1, leave 30% runner → TP2/TP3; hard SL = 15m trigger wick ±0.25–0.50pt; time-stop 45–60m; max 2 attempts per level.
ES SHORT (A++) — Rejection Fade at 6,735–6,750
Trigger: 15m rejection close back inside the zone → 5m re-close down with LH → 1m pullback fail to enter.
Entry: 6,740 ±2 (within zone after the 1m pullback).
SL: Above the 15m signal wick / hard cap 6,768.
• TP1: 6,700 pivot.
• TP2: 6,678–6,672 shelf.
• TP3: 6,659–6,640 ext cluster.
Invalidation / maintenance: Two whipsaws or a 15m body-through ≥1.0pt above 6,768 → demote/stand down; acceptance >6,768 flips bias to longs toward 6,78x.
ES LONG (A++) — Acceptance-Continuation from 6,658–6,642
Context: High-prob “flush & reclaim” at the extension cluster before/after 8:30 data.
Trigger: 15m full-body close back above 6,652, 5m HL + re-close up, 1m HL entry.
Entry: 6,650 ±3 after reclaim.
SL: Below the 15m signal wick / hard cap 6,637.
• TP1: 6,700 pivot.
• TP2: 6,724–6,735 supply.
• TP3: 6,760–6,770 (weekly cap).
Notes: If the 8:30 print gaps price through TP1 immediately, manage fills but still honor runner plan; no trailing before TP2 per protocol.
==========
London session game plan (02:00–05:00 ET)
Base case: Range 6,678–6,700 with liquidity sweeps. Reclaim of 6,700 during London often fades back into the range; prefer patience for NY AM.
Alternative: London sell program to 6,66x–6,64x → if quick reclaim above 6,652, that’s the Tier-2 bounce that feeds the NY long setup.
Bear path: Acceptance <6,640 in London → prepare for a trend-day lower toward 6,619 unless NY reverses on data.
Gold price analysis September 25The corrective downtrend is heading towards the next important support zones 3701 and 3671. Today's strategy is still looking for better SELL points. Pay attention to price reactions at important support zones. If it is confirmed that buyers want to jump into the market, we can follow that buying force to execute BUY strategies. 3750 plays an important role today and the SELL strategy will no longer be effective when this zone is broken.

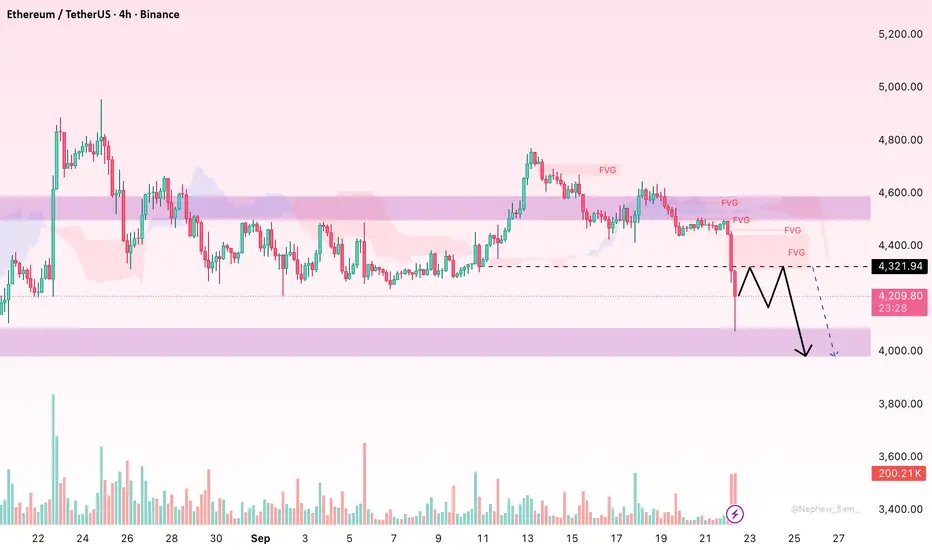
ETH: Sharp Flush, Filling the FVG or Preparing for a Deeper DropHello everyone,
On the H4 chart the recent red candle in ETH was a textbook flush: price plunged straight below the Ichimoku Cloud, selling volume spiked, and a large cluster of FVGs has formed overhead around 4.32k–4.40k. This setup typically favours a technical rebound to fill those gaps before the market chooses its next direction.
Why did ETH fall so sharply?
First, mass liquidation of leveraged positions: this morning alone, hundreds of millions in long positions were wiped out, with ETH accounting for a significant share, intensifying the move lower.
Second, deteriorating ETF flows: after a period of strong inflows, spot ETH ETFs saw heavy redemptions in early September (from ~$505M to ~$952M within days), adding supply as investors took profit or rotated into BTC.
Third, risk-off sentiment ahead of the Fed and lingering regulatory uncertainty around ETH ETFs—particularly the delayed review of staking features—has curbed appetite. Finally, the wider crypto market saw broad-based selling, wiping out tens of billions in market cap and dragging ETH down with it.
From a technical view, I expect ETH to rebound toward 4.32k–4.36k (lower FVG edge, possibly extending to 4.38k–4.40k near the Cloud) to retest supply. If selling pressure re-emerges there, price is likely to reverse toward 4.08k–4.02k, retesting the recent absorption zone. Holding 4.02k could allow another attempt back at 4.32k; breaking and closing H4 below 4.02k, however, opens risk toward ~3.98k.
Only if ETH closes above 4.40k–4.43k on H4 (escaping the FVG and regaining the Cloud) would I consider a scenario of building a higher base.
What about you—do you lean towards “rebound to sell” or “base building for a reversal”?
World gold prices are experiencing profit-taking. After soaring to nearly $3,800 an ounce, world gold prices are facing profit-taking. Rising US new home sales have put pressure on the precious metal.
According to a report released on Wednesday by the US Census Bureau and the Department of Housing and Urban Development, new home sales increased 20.5% last month to an annualized rate of 800,000 units, compared to an adjusted rate of 664,000 units in July.
New home sales increased 15.4% year-on-year and are now at their highest level since February 2022.
Despite the decline, world gold prices still receive positive forecasts from experts. Bart Melek - Managing Director, Head of Global Commodity Strategy at TD Securities predicts that gold prices could reach $4,000/ounce in the short term as central banks, especially China and many emerging markets, will buy millions of ounces more to increase their reserve ratios.
The main reason is that the US Federal Reserve (FED) continues to loosen monetary policy as it enters 2026. There is a high possibility of another interest rate cut this year, or even two, although the FED Chairman did not confirm it clearly in his speech on Tuesday," Melek said in an interview on Tuesday.

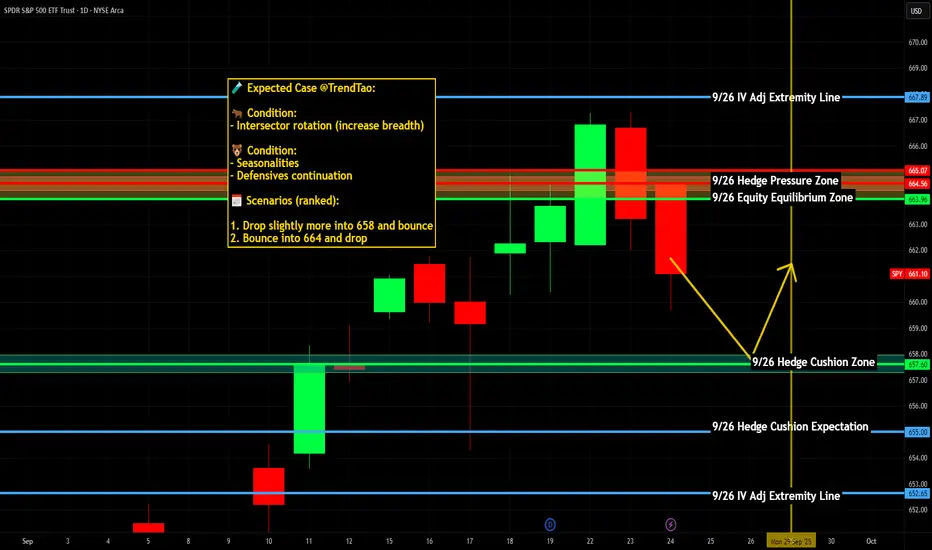
$SPY / $SPX Scenarios — Thursday, Sept 25, 2025🔮 AMEX:SPY / SP:SPX Scenarios — Thursday, Sept 25, 2025 🔮
🌍 Market-Moving Headlines
📉 Data-heavy morning: Multiple macro releases hit at 8:30 AM, setting tone across bonds, USD, and equities.
💬 Fed chorus: Packed lineup of Fed speakers keeps policy narrative in focus.
💻 Tech + rates tension: AMEX:XLK flows remain sensitive to bond yield direction post-FOMC.
🛢️ Energy lens: Oil volatility continues to act as an inflation wildcard.
📊 Key Data & Events (ET)
⏰ 🚩 8:30 AM — Initial Jobless Claims (weekly)
⏰ 🚩 8:30 AM — GDP (Q2, third estimate)
⏰ 🚩 8:30 AM — Durable Goods Orders (Aug)
⏰ 10:00 AM — Existing Home Sales (Aug)
🗣️ Fed Speakers:
• 8:20 AM — Austan Goolsbee (Chicago Fed)
• 9:00 AM — John Williams (NY Fed) & Jeff Schmid (Kansas City Fed)
• 10:00 AM — Michelle Bowman (Fed Vice Chair for Supervision)
• 1:00 PM — Michael Barr (Fed Gov.)
• 1:40 PM — Lorie Logan (Dallas Fed)
• 3:30 PM — Mary Daly (San Francisco Fed)
⚠️ Disclaimer: Educational/informational only — not financial advice.
📌 #trading #stockmarket #SPY #SPX #GDP #joblessclaims #durablegoods #housing #Fed #Powell #Dollar #bonds #megacaps
BABA Alibaba Group Holding Limited Options Ahead of EarningsIf you haven`t bought the dip on BABA:
Now analyzing the options chain and the chart patterns of BABA Alibaba Group Holding Limited prior to the earnings report this week,
I would consider purchasing the 135usd strike price Calls with
an expiration date of 2025-9-19,
for a premium of approximately $14.25.
If these options prove to be profitable prior to the earnings release, I would sell at least half of them.
