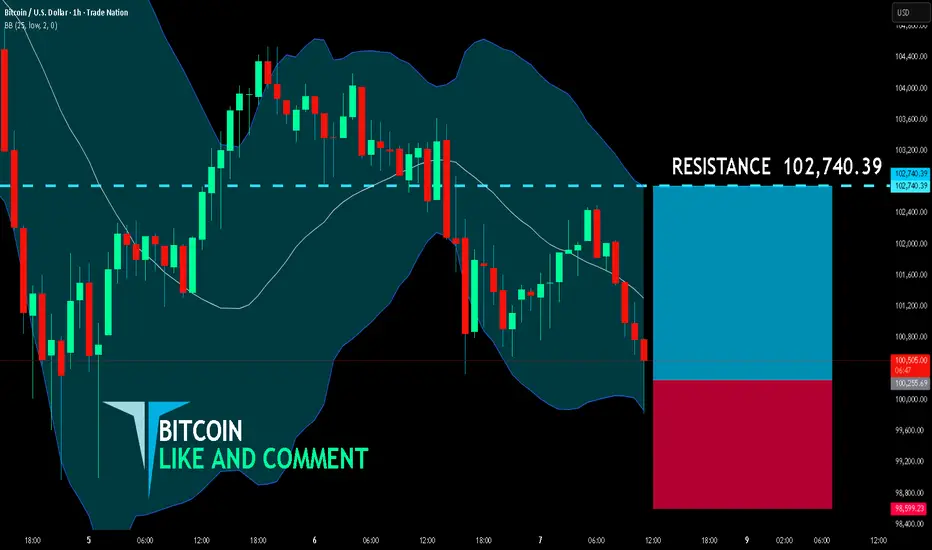
BITCOIN BULLS ARE GAINING STRENGTH|LONG
BITCOIN SIGNAL
Trade Direction: long
Entry Level: 100,255.69
Target Level: 102,740.39
Stop Loss: 98,599.23
RISK PROFILE
Risk level: medium
Suggested risk: 1%
Timeframe: 1h
Disclosure: I am part of Trade Nation's Influencer program and receive a monthly fee for using their TradingView charts in my analysis.
✅LIKE AND COMMENT MY IDEAS✅
Trading
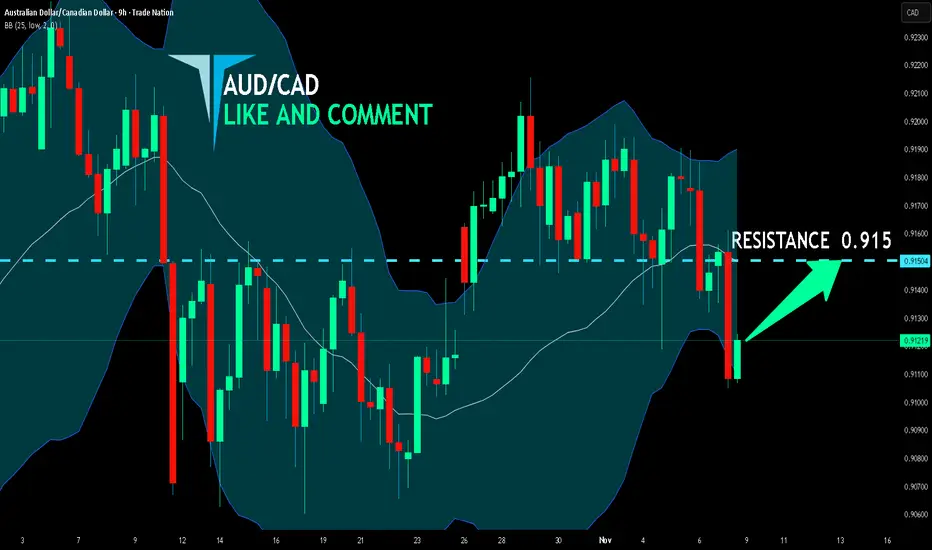
AUD/CAD SENDS CLEAR BULLISH SIGNALS|LONG
Hello, Friends!
We are targeting the 0.915 level area with our long trade on AUD/CAD which is based on the fact that the pair is oversold on the BB band scale and is also approaching a support line below thus going us a good entry option.
Disclosure: I am part of Trade Nation's Influencer program and receive a monthly fee for using their TradingView charts in my analysis.
✅LIKE AND COMMENT MY IDEAS✅
NZDUSD Will Fall! Short!
Please, check our technical outlook for NZDUSD.
Time Frame: 1h
Current Trend: Bearish
Sentiment: Overbought (based on 7-period RSI)
Forecast: Bearish
The market is trading around a solid horizontal structure 0.564.
The above observations make me that the market will inevitably achieve 0.561 level.
P.S
Overbought describes a period of time where there has been a significant and consistent upward move in price over a period of time without much pullback.
Like and subscribe and comment my ideas if you enjoy them!

GBPJPY Will Go Lower From Resistance! Sell!
Here is our detailed technical review for GBPJPY.
Time Frame: 1D
Current Trend: Bearish
Sentiment: Overbought (based on 7-period RSI)
Forecast: Bearish
The market is testing a major horizontal structure 203.050.
Taking into consideration the structure & trend analysis, I believe that the market will reach 200.345 level soon.
P.S
Please, note that an oversold/overbought condition can last for a long time, and therefore being oversold/overbought doesn't mean a price rally will come soon, or at all.
Like and subscribe and comment my ideas if you enjoy them!

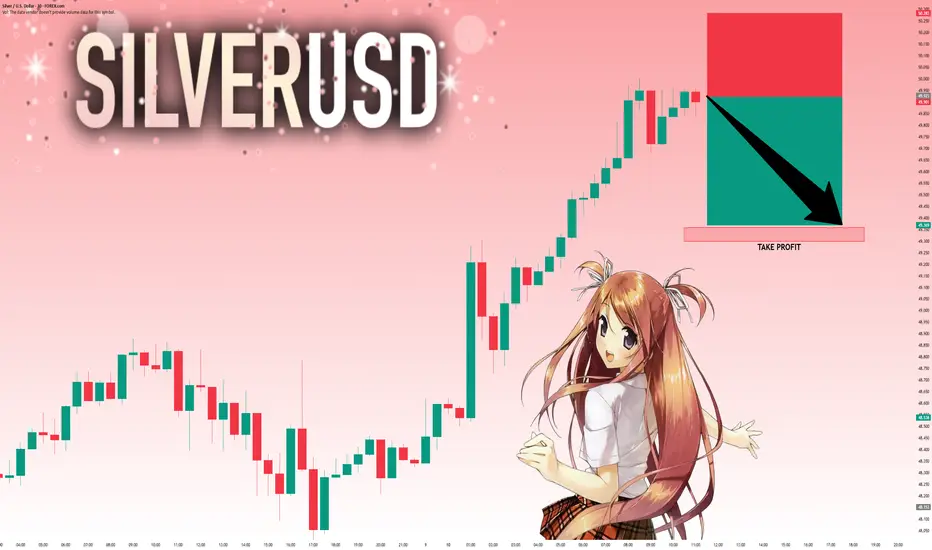
SILVER: Move Down Expected! Short!
My dear friends,
Today we will analyse SILVER together☺️
The in-trend continuation seems likely as the current long-term trend appears to be strong, and price is holding below a key level of 49.923 So a bearish continuation seems plausible, targeting the next low. We should enter on confirmation, and place a stop-loss beyond the recent swing level.
❤️Sending you lots of Love and Hugs❤️
GBP/USD BEARS ARE GAINING STRENGTH|SHORT
GBP/USD SIGNAL
Trade Direction: short
Entry Level: 1.315
Target Level: 1.309
Stop Loss: 1.319
RISK PROFILE
Risk level: medium
Suggested risk: 1%
Timeframe: 3h
Disclosure: I am part of Trade Nation's Influencer program and receive a monthly fee for using their TradingView charts in my analysis.
✅LIKE AND COMMENT MY IDEAS✅

XAUUSD – Bullish structure aiming for 4,218 FVG zone 🎯 Price has completed a clean liquidity sweep above 4,087, confirming that Smart Money has cleared the short-term highs before continuing higher. The market structure has now shifted bullish, showing clear intent to reach the imbalance zone between 4,157–4,218, where an important Bearish FVG / Supply block remains unmitigated.
The 4,017–4,020 Bullish Order Block below current price is the key mitigation area I’m watching for potential re-entry. If price retraces into this zone and confirms with a BOS up, I’ll be looking for longs targeting 4,087 first, then 4,157–4,218 as the main liquidity draw.
As long as price holds above 4,017, the short-term bias stays bullish. A clean break below that would shift focus back to lower liquidity levels near 3,980, where the next accumulation could form.
Overall, this setup reflects a classic liquidity grab → structure shift → FVG draw, and I’ll stay patient to let price confirm from the OB before engaging.✨
This is my personal view based on SMC principles – not financial advice. Like & Follow for daily updates.


Silver (SLV): Multi-Year Cup & Handle SetupSilver appears to be repeating the same large-scale institutional “Cup and Handle” structure that played out almost perfectly on Gold.
The difference is that in SLV (iShares Silver Trust), the chart history is shorter, so the full formation is not as clearly visible — but if we reference the historical silver chart (since 1802), the pattern becomes unmistakable.
That long-term chart shows a massive multi-decade rounded base — the cup — and now price has already touched the upper boundary, effectively activating the pattern.
🧠 Technical Context
On the long-term silver chart, the handle represents the multi-year consolidation we’ve seen since the 2011 peak.
In SLV, this structure is compressed, but the correlation with physical silver remains ~99%, since the fund is backed by over 90% physical silver holdings.
This makes SLV an ideal instrument for expressing long-term silver exposure — it tracks spot silver almost tick-for-tick, while providing the liquidity and accessibility of an ETF.
Technically, silver has already tested the upper rim of the cup, confirming that the pattern is active.
This breakout will likely be followed by a short-term consolidation (the final part of the handle) before the market enters what could become a multi-year rally phase.
Based on historical fractals and volume structure, the first major pullback is expected toward the $35–25 zone, which corresponds to the previous 4th-wave cluster — a classic accumulation area in Elliott terms.
I’ll be looking to accumulate aggressively in the $35–30 range, scaling in gradually as price approaches those levels.
🎯 Trade Plan
Instrument: SLV (iShares Silver Trust ETF)
Correlation to Spot Silver: ~99%
Primary Support Zone (Accumulation): $25 – $35
Handle Breakout Level: around $50
Long-Term Target: $800+ (silver spot equivalent)
Stop-Loss: per individual risk management
Time Horizon: 5+ years
Once silver completes its consolidation and breaks above $50, the measured move of the Cup and Handle suggests a multi-hundred percent rally that could unfold over the next decade.
The breakout will likely be accompanied by rising institutional volume and strong follow-through momentum.
🧭 Strategic View
I trade silver exclusively through SLV, as it offers the most direct and reliable exposure to the underlying metal.
The fund’s near-perfect correlation with spot silver makes it ideal for implementing long-term accumulation strategies without the operational complexities of futures or CFDs.
This will be one of my core positions for the coming decade.
After the expected correction into the $30–35 range, I plan to build a large position, possibly hedged later on, and hold through the full bullish cycle.
Silver’s technical structure, macro fundamentals, and historical analogs all point toward a potential generational rally once this base completes.
This is the setup I’m positioning for — patiently, systematically, and with conviction.
Summary
Long-term “Cup and Handle” formation now confirmed
Final correction expected before the next secular rally
SLV offers near-1:1 tracking with physical silver
Accumulation zone: $35–25
Target: $800+ over the next decade

EURGBP Will Collapse! SELL!
My dear friends,
Please, find my technical outlook for EURGBP below:
The price is coiling around a solid key level - 0.8825
Bias - Bearish
Technical Indicators: Pivot Points Low anticipates a potential price reversal.
Super trend shows a clear sell, giving a perfect indicators' convergence.
Goal - 0.8804
About Used Indicators:
The pivot point itself is simply the average of the high, low and closing prices from the previous trading day.
Disclosure: I am part of Trade Nation's Influencer program and receive a monthly fee for using their TradingView charts in my analysis.
———————————
WISH YOU ALL LUCK

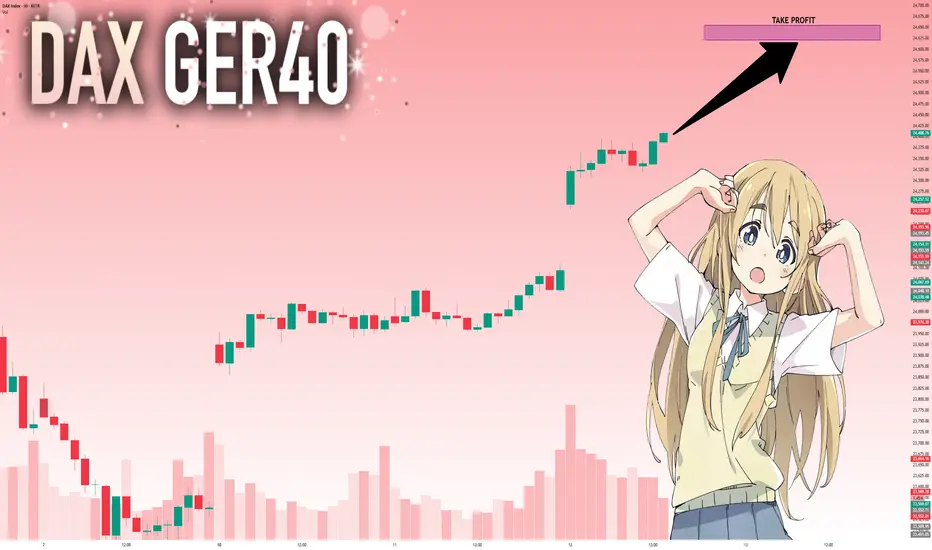
DAX: Bulls Are Winning! Long!
My dear friends,
Today we will analyse DAX together☺️
The recent price action suggests a shift in mid-term momentum. A break above the current local range around 24,402.44 will confirm the new direction upwards with the target being the next key level of 24,621.66 and a reconvened placement of a stop-loss beyond the range.
❤️Sending you lots of Love and Hugs❤️
AUDJPY The Target Is DOWN! SELL!
My dear followers,
This is my opinion on the AUDJPY next move:
The asset is approaching an important pivot point 101.25
Bias - Bearish
Safe Stop Loss - 101. 42
Technical Indicators: Supper Trend generates a clear short signal while Pivot Point HL is currently determining the overall Bearish trend of the market.
Goal - 100.95
About Used Indicators:
For more efficient signals, super-trend is used in combination with other indicators like Pivot Points.
Disclosure: I am part of Trade Nation's Influencer program and receive a monthly fee for using their TradingView charts in my analysis.
———————————
WISH YOU ALL LUCK

GBPUSD: Very Bearish Outlook 🇬🇧🇺🇸
Intraday price action on GBPUSD looks very bearish after a recent
test of a significant daily resistance that we discussed earlier.
The occurrence of a bearish imbalance indicates a highly probable
down movement.
I anticipate a fall at least to 1.3064
❤️Please, support my work with like, thank you!❤️
I am part of Trade Nation's Influencer program and receive a monthly fee for using their TradingView charts in my analysis.

SILVER: Next Move Is Down! Short!
My dear friends,
Today we will analyse SILVER together☺️
The in-trend continuation seems likely as the current long-term trend appears to be strong, and price is holding below a key level of 51.770 So a bearish continuation seems plausible, targeting the next low. We should enter on confirmation, and place a stop-loss beyond the recent swing level.
❤️Sending you lots of Love and Hugs❤️

EURUSD: Strong Growth Ahead! Long!
My dear friends,
Today we will analyse EURUSD together☺️
The market is at an inflection zone and price has now reached an area around 1.15800 where previous reversals or breakouts have occurred.And a price reaction that we are seeing on multiple timeframes here could signal the next move up so we can enter on confirmation, and target the next key level of 1.15927.Stop-loss is recommended beyond the inflection zone.
❤️Sending you lots of Love and Hugs❤️

GOLD: Will Go Down! Short!
My dear friends,
Today we will analyse GOLD together☺️
The price is near a wide key level
and the pair is approaching a significant decision level of 4,130.90 Therefore, a strong bearish reaction here could determine the next move down.We will watch for a confirmation candle, and then target the next key level of 4,123.80.Recommend Stop-loss is beyond the current level.
❤️Sending you lots of Love and Hugs❤️

GOLD SENDS CLEAR BEARISH SIGNALS|SHORT
GOLD SIGNAL
Trade Direction: short
Entry Level: 4,124.58
Target Level: 4,005.98
Stop Loss: 4,203.19
RISK PROFILE
Risk level: medium
Suggested risk: 1%
Timeframe: 9h
Disclosure: I am part of Trade Nation's Influencer program and receive a monthly fee for using their TradingView charts in my analysis.
✅LIKE AND COMMENT MY IDEAS✅

EUR/JPY BEARS ARE GAINING STRENGTH|SHORT
EUR/JPY SIGNAL
Trade Direction: short
Entry Level: 179.218
Target Level: 177.695
Stop Loss: 180.236
RISK PROFILE
Risk level: medium
Suggested risk: 1%
Timeframe: 4h
Disclosure: I am part of Trade Nation's Influencer program and receive a monthly fee for using their TradingView charts in my analysis.
✅LIKE AND COMMENT MY IDEAS✅

EUR/GBP SELLERS WILL DOMINATE THE MARKET|SHORT
Hello, Friends!
EUR/GBP pair is trading in a local uptrend which we know by looking at the previous 1W candle which is green. On the 1H timeframe the pair is going up too. The pair is overbought because the price is close to the upper band of the BB indicator. So we are looking to sell the pair with the upper BB line acting as resistance. The next target is 0.879 area.
Disclosure: I am part of Trade Nation's Influencer program and receive a monthly fee for using their TradingView charts in my analysis.
✅LIKE AND COMMENT MY IDEAS✅

USD/CHF BULLISH BIAS RIGHT NOW| LONG
Hello, Friends!
We are targeting the 0.804 level area with our long trade on USD/CHF which is based on the fact that the pair is oversold on the BB band scale and is also approaching a support line below thus going us a good entry option.
Disclosure: I am part of Trade Nation's Influencer program and receive a monthly fee for using their TradingView charts in my analysis.
✅LIKE AND COMMENT MY IDEAS✅

DCR Update📊 DCR Update
DCR is testing the red resistance zone 🔴
If it breaks out above, it could confirm a bullish setup 📈
The first target would be the green line level 🟢

USOIL Will Grow! Long!
Please, check our technical outlook for USOIL.
Time Frame: 1D
Current Trend: Bullish
Sentiment: Oversold (based on 7-period RSI)
Forecast: Bullish
The market is approaching a significant support area 60.422.
The underlined horizontal cluster clearly indicates a highly probable bullish movement with target 65.013 level.
P.S
We determine oversold/overbought condition with RSI indicator.
When it drops below 30 - the market is considered to be oversold.
When it bounces above 70 - the market is considered to be overbought.
Like and subscribe and comment my ideas if you enjoy them!

GBPUSD Will Go Higher From Support! Buy!
Here is our detailed technical review for GBPUSD.
Time Frame: 8h
Current Trend: Bullish
Sentiment: Oversold (based on 7-period RSI)
Forecast: Bullish
The market is on a crucial zone of demand 1.312.
The oversold market condition in a combination with key structure gives us a relatively strong bullish signal with goal 1.324 level.
P.S
Overbought describes a period of time where there has been a significant and consistent upward move in price over a period of time without much pullback.
Like and subscribe and comment my ideas if you enjoy them!
