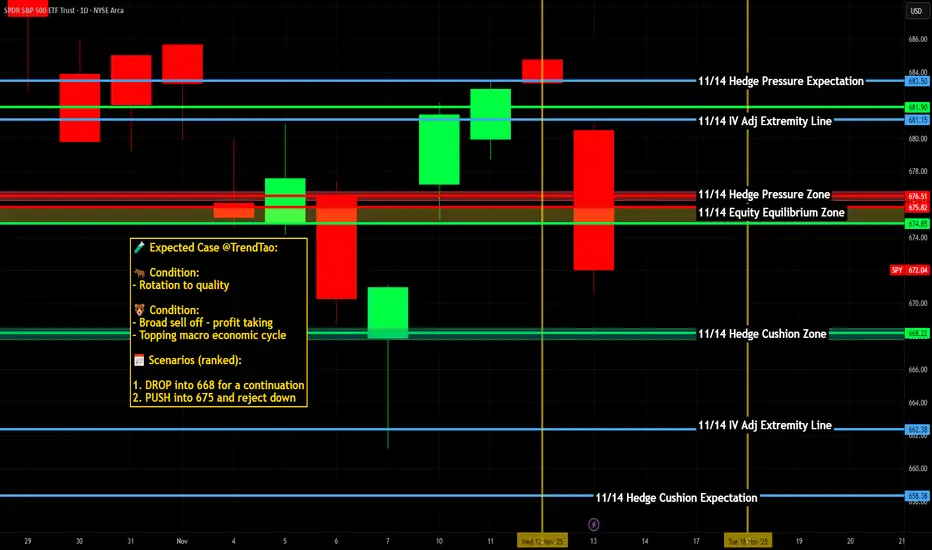
SPY & SPX Scenarios — Friday, Nov 14, 2025🔮 SPY & SPX Scenarios — Friday, Nov 14, 2025 🔮
🌍 Market-Moving Headlines
🚨 Shutdown disruption continues: The entire Retail Sales + PPI complex — normally one of the biggest monthly movers — is still at risk of nondelivery. Markets will trade on expectations, not prints.
📉 Volatility watch: With CPI, Claims, and Retail Sales all in backlog, positioning remains thin and reactive to yields + global risk sentiment.
💵 Bond market tone dominates: Without fresh inflation data, Treasury moves may guide SPX levels more than usual.
📊 Key Data & Events (ET)
All major data below is shutdown-risk flagged.
⏰ ⚠️ 8:30 AM — Retail Sales (Oct)
Forecast: -0.2%
Shutdown delay risk — high
⏰ ⚠️ 8:30 AM — Retail Sales ex-Auto (Oct)
Forecast: +0.2%
Shutdown delay risk — high
⏰ ⚠️ 8:30 AM — Producer Price Index (PPI, Oct)
Headline: +0.1%
Core: +0.3%
Shutdown delay risk — high
⏰ ⚠️ 10:00 AM — Business Inventories (Sept)
Forecast: +0.2%
Shutdown delay risk — medium
👉 All above data normally moves markets, especially Retail Sales + PPI.
Today, traders only get the reaction if the numbers publish.
⚠️ Disclaimer: Educational and informational only — not financial advice.
📌 #SPY #SPX #trading #inflation #PPI #RetailSales #macro #economy #Fed #markets #risk #shutdown
Trading
SKY Update📊 SKY Update
SKY is testing the blue support zone 🔵
If it breaks below, the price could drop toward the green line level 🟢
This support is important, so watch it closely 👀

LAZR Luminar Technologies Options Ahead of EarningsAnalyzing the options chain and the chart patterns of LAZR Luminar Technologies prior to the earnings report this week,
I would consider purchasing the 1usd strike price Puts with
an expiration date of 2026-2-20,
for a premium of approximately $0.58.
If these options prove to be profitable prior to the earnings release, I would sell at least half of them.

POET Technologies Options Ahead of EarningsAnalyzing the options chain and the chart patterns of POET Technologies prior to the earnings report this week,
I would consider purchasing the 17usd strike price Calls with
an expiration date of 2028-1-21,
for a premium of approximately $0.82.
If these options prove to be profitable prior to the earnings release, I would sell at least half of them.

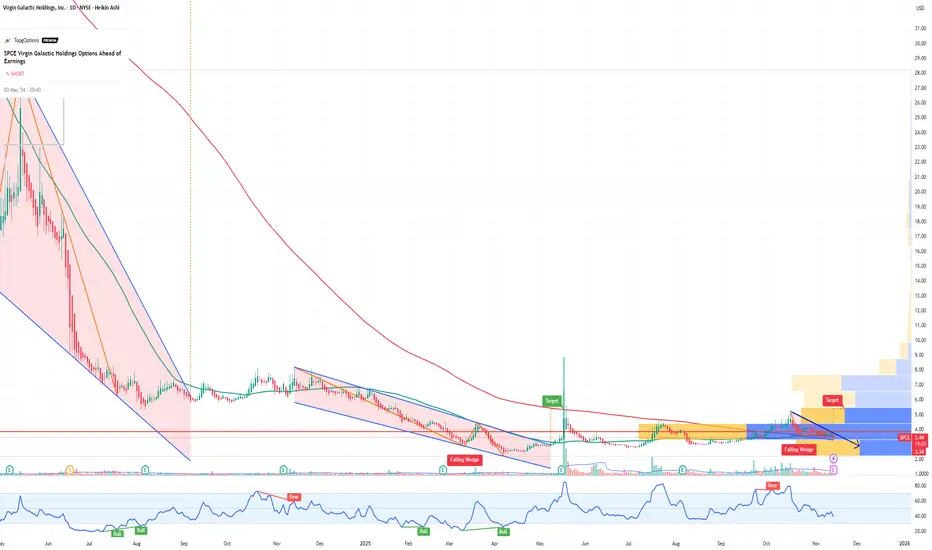
SPCE Virgin Galactic Holdings Options Ahead of EarningsIf you haven`t sold SPCE before the share dilution:
Now analyzing the options chain and the chart patterns of SPCE Virgin Galactic Holdings prior to the earnings report this week,
I would consider purchasing the 3.50usd strike price Puts with
an expiration date of 2025-11-14,
for a premium of approximately $0.37.
If these options prove to be profitable prior to the earnings release, I would sell at least half of them.
Markets are flashing MAJOR warning signs…Markets are flashing MAJOR warning signs… NASDAQ:QQQ AMEX:SPY
In this video, we will look at the 21 ema on the Daily charts to review the move since April and where we could go from here.
If you have money in this market, you need to see this ASAP 👇

Review and plan for 14th November 2025 Nifty future and banknifty future analysis and intraday plan.
Quarterly results- analysed.
This video is for information/education purpose only. you are 100% responsible for any actions you take by reading/viewing this post.
please consult your financial advisor before taking any action.
----Vinaykumar hiremath, CMT

US100 REBOUND AHEAD|LONG|
✅US100 is approaching a defined demand level where discount pricing aligns with bullish order flow. A potential rebound may deliver price toward the imbalance above. Time Frame 5H.
LONG🚀
✅Like and subscribe to never miss a new idea!✅

TESLA Bearish Breakout! Sell!
Hello,Traders!
TESLA broke below a key horizontal structure, confirming a bearish breakout. SMC perspective suggests smart money could drive price to mitigate inefficiency near $375 support zone. Time Frame 12H.
Sell!
Comment and subscribe to help us grow!
Check out other forecasts below too!
Disclosure: I am part of Trade Nation's Influencer program and receive a monthly fee for using their TradingView charts in my analysis.

SPX Update📊 SPX Update
SP:SPX has broken below the blue support level 🔵
As long as it doesn’t move back above this level, it remains bearish 🔻
Structure shows continued weakness — watch for the next support zone.
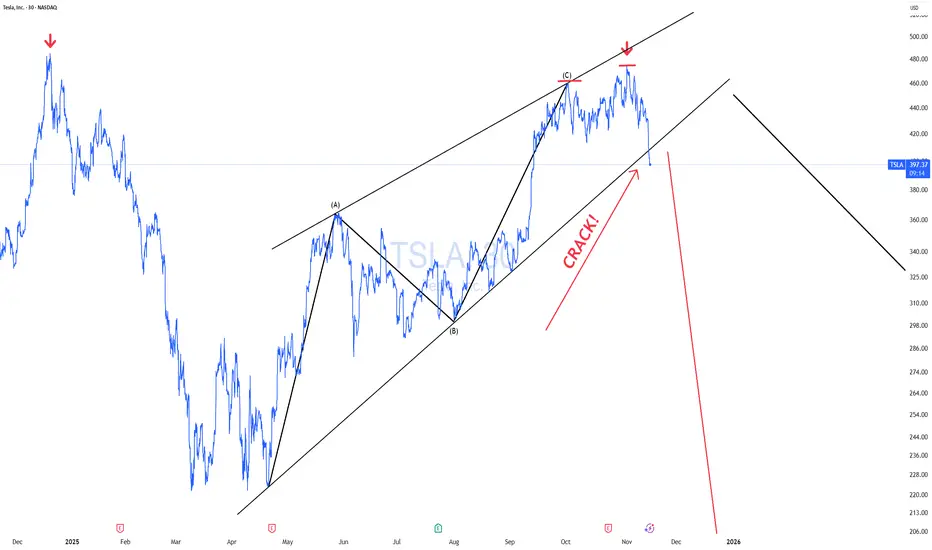
TSLA In Trouble! WARNING!🚫 Why No One Should Be Holding TSLA Right Now
Charting:
Triple Top! Rising wedge fully formed 3-wave rising wedge structure that has hooked and broken! mini double top.
I’ve been saying this for a while — no one should be long TSLA. The stock has done nothing since 2021, yet the hype machine for the boy band keeps spinning.
Ask yourself honestly: Where does Tesla actually lead anymore?
Not in EVs
Not in autonomy
Not in robots
Not in AI
Not in tech innovation
It’s become a stock story with no story left.
And when leadership is built on hype, not execution, it always ends the same way.
Never invest in toxic leadership or cult narratives.
TSLA is a real company, sure — but in fundamental terms, it’s an $8 stock wearing a $450 costume.
If you agree and sell, and it's wrong. Guess what? You will have a bunch of cash waiting to buy it. If you disagree, you won't have a bunch of cash waiting to buy lower BC YOU NEVER SOLD! You can't "BUY THE DIP" Ubless you first SELL THE RIP! It's 2nd-grade math that the boy band who will come in here hating on my call again cannot do. They will give me colorful charts, tell me about cup and handles while riding it all the way down!
They are always buying but NEVER selling. That's the trick with paper money, you can never run out of it. hahah!
Click boost, follow, comment nicely for more authentic, no BS, raw analysis. Let's get to 6,000 followers. ))
BTC Update📊 CRYPTOCAP:BTC Update
Remember guys — BTC can still move toward the $92,000 area 💰
This level lines up with the CME gap that could be filled 🔄
Nothing guaranteed, but it remains a possible target if the trend continues 📈

GBP-CAD Free Signal! Sell!
Hello,Traders!
GBPCAD is tapping into a horizontal supply area after a strong bullish move, where premium pricing aligns with potential distribution. Smart money could drive a corrective phase next.
--------------------
Stop Loss: 1.8548
Take Profit: 1.8495
Entry Level: 1.8520
Time Frame: 2H
--------------------
Sell!
Comment and subscribe to help us grow!
Check out other forecasts below too!
Disclosure: I am part of Trade Nation's Influencer program and receive a monthly fee for using their TradingView charts in my analysis.

DCR Update📊 DCR Update
DCR is testing the blue support zone 🔵
A break below this level is possible, which could signal further downside 🔻
Watch this zone closely — it’s a key level for the next move.

GBPJPY FREE SIGNAL|SHORT|
✅GBPJPY traded into a clear supply level where premium pricing aligns with prior liquidity grabs. Smart money could engineer a short-term distribution before delivery to lower inefficiency.
—————————
Entry: 204.000
Stop Loss: 204.420
Take Profit: 203.297
Time Frame: 4H
—————————
SHORT🔥
✅Like and subscribe to never miss a new idea!✅

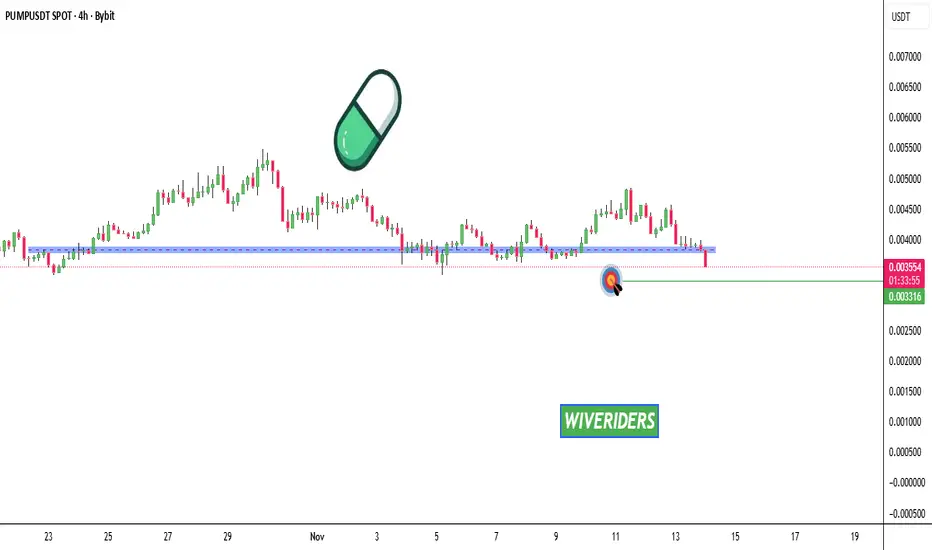
PUMP Update📊 PUMP Update
PUMP has broken below the blue support zone 🔵
Price could continue moving down, at least toward the green line level 🟢
Structure remains bearish as long as it stays below the broken support 🔻
AERO Update📊 AERO Update
AERO has formed a double top pattern 🔴 and is now in a downtrend 🔻
It could drop about 8% more, possibly reaching the green line level 🟢
Trend remains weak, so stay cautious and watch for confirmation.

USDCAD WEDGE BREAKOUT|LONG|
✅USDCAD broke out of a bullish wedge, signaling a potential continuation toward higher imbalance zones above 1.4050$. Liquidity resting above equal highs could be targeted next. Time Frame 4H.
LONG🚀
✅Like and subscribe to never miss a new idea!✅

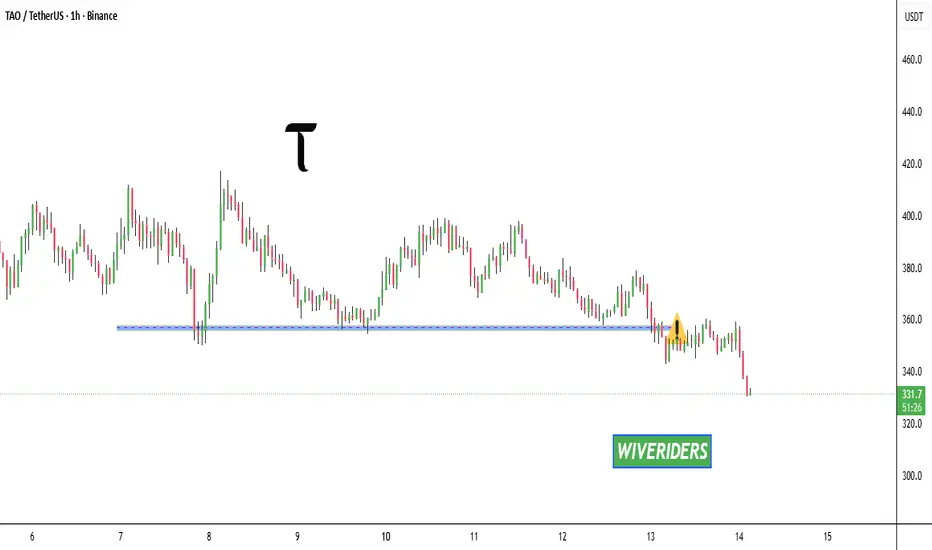
TAO Update📊 TAO Update
As we expected, TAO has broken below the blue support level 🔵
This confirms weakness in the structure and could signal a bearish move ahead 🔻
EUR-USD Local Short! Sell!
Hello,Traders!
EURUSD is approaching a horizontal supply area where short-term liquidity above recent highs may attract smart money reactions, creating a potential short setup. Time Frame 2H.
Sell!
Comment and subscribe to help us grow!
Check out other forecasts below too!
Disclosure: I am part of Trade Nation's Influencer program and receive a monthly fee for using their TradingView charts in my analysis.

NZDJPY - The Wall of Sellers Awaits!⚔️NZDJPY is once again approaching a massive resistance zone highlighted in red, an area that has rejected price multiple times in the past, acting as a strong supply wall.
📉As the pair nears this level , I’ll be looking for potential short setups, expecting a bearish rejection that could drive price back toward the lower support zone around the previous lows.
This range has defined the market for months, and until a clear breakout occurs, playing the range remains the optimal strategy, sell high, buy low.
Will the bears defend this zone one more time? 👀
⚠️ Disclaimer: This is not financial advice. Always do your own research and manage risk properly.
📊All Strategies Are Good; If Managed Properly!
~Richard Nasr

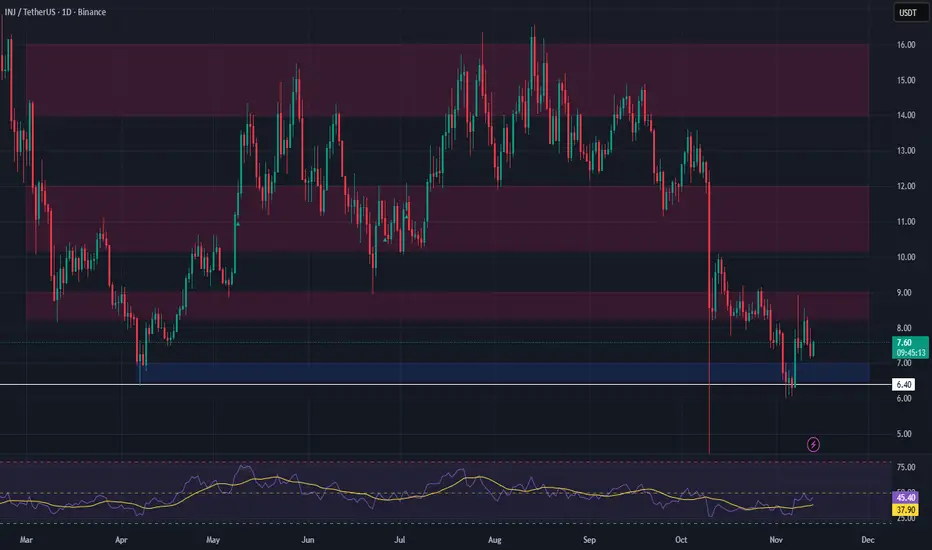
INJ Bullish Swing Setup: Higher Low Formation at Key SupportInjective (INJ) has made a strong impulsive move up, showing significant bullish strength in recent sessions. Price is now pulling back and appears to be forming a higher low, a classic swing continuation pattern in trending markets. This correction offers a potential long opportunity for traders anticipating the next leg higher.
📍 Entry Zone: $6.50 – $7.00
🎯 Take Profits:
• TP1: $8.25 – $9.00
• TP2: $10.20 – $12.00
• TP3: $14.00 – $16.00
🛡️ Stop Loss: Just below $6.40
CADCHF Technical Analysis! BUY!
My dear subscribers,
This is my opinion on the CADCHF next move:
The instrument tests an important psychological level 0.5682
Bias - Bullish
Technical Indicators: Supper Trend gives a precise Bullish signal, while Pivot Point HL predicts price changes and potential reversals in the market.
Target - 0.5706
About Used Indicators:
On the subsequent day, trading above the pivot point is thought to indicate ongoing bullish sentiment, while trading below the pivot point indicates bearish sentiment.
Disclosure: I am part of Trade Nation's Influencer program and receive a monthly fee for using their TradingView charts in my analysis.
———————————
WISH YOU ALL LUCK
