NZDUSD Will Fall! Short!
Please, check our technical outlook for NZDUSD.
Time Frame: 1h
Current Trend: Bearish
Sentiment: Overbought (based on 7-period RSI)
Forecast: Bearish
The market is trading around a solid horizontal structure 0.564.
The above observations make me that the market will inevitably achieve 0.561 level.
P.S
Overbought describes a period of time where there has been a significant and consistent upward move in price over a period of time without much pullback.
Like and subscribe and comment my ideas if you enjoy them!
Trading

GBPJPY Will Go Lower From Resistance! Sell!
Here is our detailed technical review for GBPJPY.
Time Frame: 1D
Current Trend: Bearish
Sentiment: Overbought (based on 7-period RSI)
Forecast: Bearish
The market is testing a major horizontal structure 203.050.
Taking into consideration the structure & trend analysis, I believe that the market will reach 200.345 level soon.
P.S
Please, note that an oversold/overbought condition can last for a long time, and therefore being oversold/overbought doesn't mean a price rally will come soon, or at all.
Like and subscribe and comment my ideas if you enjoy them!

GBPAUD Will Go Up From Support! Buy!
Take a look at our analysis for GBPAUD.
Time Frame: 8h
Current Trend: Bullish
Sentiment: Oversold (based on 7-period RSI)
Forecast: Bullish
The market is approaching a key horizontal level 2.016.
Considering the today's price action, probabilities will be high to see a movement to 2.041.
P.S
The term oversold refers to a condition where an asset has traded lower in price and has the potential for a price bounce.
Overbought refers to market scenarios where the instrument is traded considerably higher than its fair value. Overvaluation is caused by market sentiments when there is positive news.
Like and subscribe and comment my ideas if you enjoy them!

SILVER SENDS CLEAR BEARISH SIGNALS|SHORT
SILVER SIGNAL
Trade Direction: short
Entry Level: 4,984.0
Target Level: 4,875.1
Stop Loss: 5,056.8
RISK PROFILE
Risk level: medium
Suggested risk: 1%
Timeframe: 1h
Disclosure: I am part of Trade Nation's Influencer program and receive a monthly fee for using their TradingView charts in my analysis.
✅LIKE AND COMMENT MY IDEAS✅

GBP/USD BEARS ARE GAINING STRENGTH|SHORT
GBP/USD SIGNAL
Trade Direction: short
Entry Level: 1.315
Target Level: 1.309
Stop Loss: 1.319
RISK PROFILE
Risk level: medium
Suggested risk: 1%
Timeframe: 3h
Disclosure: I am part of Trade Nation's Influencer program and receive a monthly fee for using their TradingView charts in my analysis.
✅LIKE AND COMMENT MY IDEAS✅

EUR/USD SELLERS WILL DOMINATE THE MARKET|SHORT
Hello, Friends!
Previous week’s green candle means that for us the EUR/USD pair is in the uptrend. And the current movement leg was also up but the resistance line will be hit soon and upper BB band proximity will signal an overbought condition so we will go for a counter-trend short trade with the target being at 1.152.
Disclosure: I am part of Trade Nation's Influencer program and receive a monthly fee for using their TradingView charts in my analysis.
✅LIKE AND COMMENT MY IDEAS✅

AUD/CHF BEARISH BIAS RIGHT NOW| SHORT
Hello, Friends!
AUD/CHF is trending down which is clear from the red colour of the previous weekly candle. However, the price has locally surged into the overbought territory. Which can be told from its proximity to the BB upper band. Which presents a great trend following opportunity for a short trade from the resistance line above towards the demand level of 0.519.
Disclosure: I am part of Trade Nation's Influencer program and receive a monthly fee for using their TradingView charts in my analysis.
✅LIKE AND COMMENT MY IDEAS✅

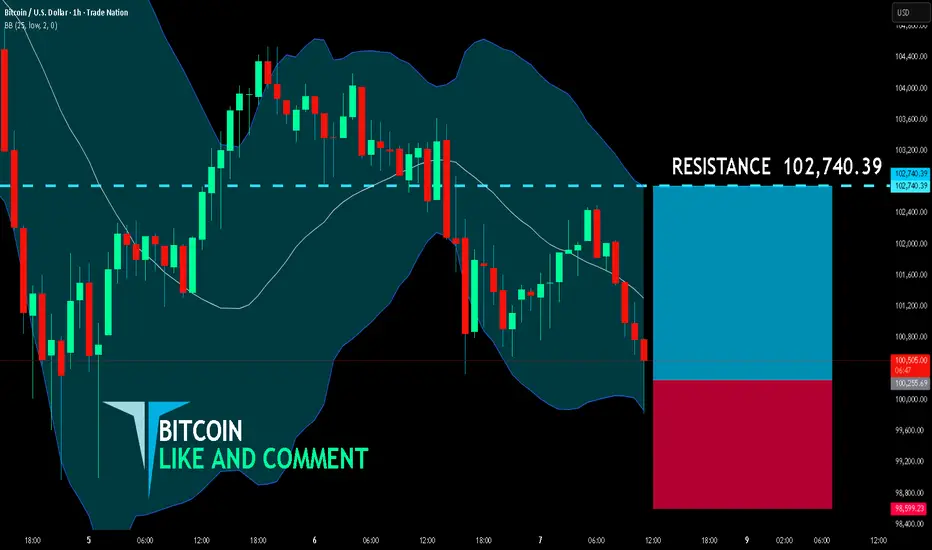
BITCOIN BULLS ARE GAINING STRENGTH|LONG
BITCOIN SIGNAL
Trade Direction: long
Entry Level: 100,255.69
Target Level: 102,740.39
Stop Loss: 98,599.23
RISK PROFILE
Risk level: medium
Suggested risk: 1%
Timeframe: 1h
Disclosure: I am part of Trade Nation's Influencer program and receive a monthly fee for using their TradingView charts in my analysis.
✅LIKE AND COMMENT MY IDEAS✅
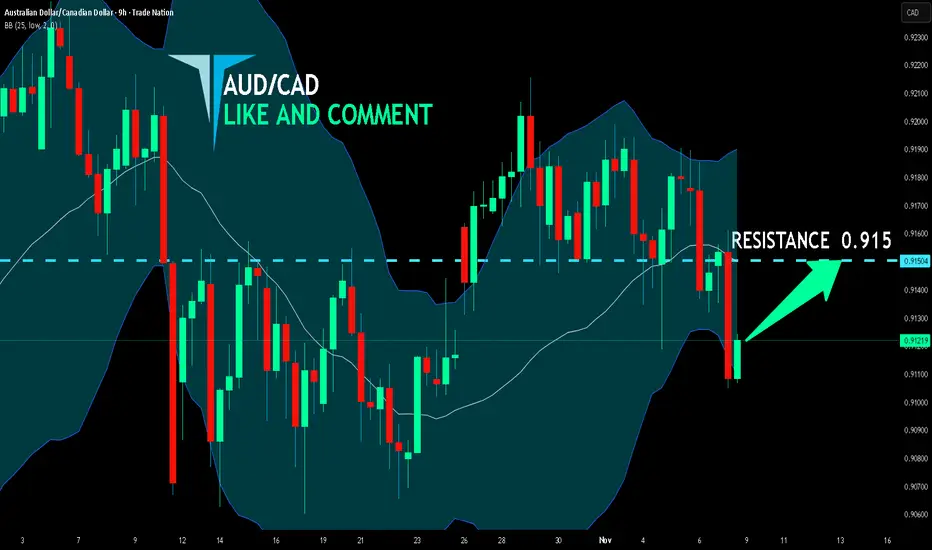
AUD/CAD SENDS CLEAR BULLISH SIGNALS|LONG
Hello, Friends!
We are targeting the 0.915 level area with our long trade on AUD/CAD which is based on the fact that the pair is oversold on the BB band scale and is also approaching a support line below thus going us a good entry option.
Disclosure: I am part of Trade Nation's Influencer program and receive a monthly fee for using their TradingView charts in my analysis.
✅LIKE AND COMMENT MY IDEAS✅
XAUUSD – Bullish structure aiming for 4,218 FVG zone 🎯 Price has completed a clean liquidity sweep above 4,087, confirming that Smart Money has cleared the short-term highs before continuing higher. The market structure has now shifted bullish, showing clear intent to reach the imbalance zone between 4,157–4,218, where an important Bearish FVG / Supply block remains unmitigated.
The 4,017–4,020 Bullish Order Block below current price is the key mitigation area I’m watching for potential re-entry. If price retraces into this zone and confirms with a BOS up, I’ll be looking for longs targeting 4,087 first, then 4,157–4,218 as the main liquidity draw.
As long as price holds above 4,017, the short-term bias stays bullish. A clean break below that would shift focus back to lower liquidity levels near 3,980, where the next accumulation could form.
Overall, this setup reflects a classic liquidity grab → structure shift → FVG draw, and I’ll stay patient to let price confirm from the OB before engaging.✨
This is my personal view based on SMC principles – not financial advice. Like & Follow for daily updates.


Bitcoin Daily Outlook: Support and Resistance in FocusHey Guys,
Looking at Bitcoin on the daily chart, the 105,000 to 98,000 levels are strong support zones. This means that as long as the price does not fall below these levels, a sharp decline in Bitcoin is unlikely.
The price touches these areas, but whales prevent it from breaking lower with strong buying, pushing it back up again.
The 113,000 – 116,000 levels are strong resistance zones.
As long as Bitcoin does not fall below 98,000, my target remains 113,000.
Currently, Bitcoin is trading at 105,887. Once my target is reached, I will provide updates.
Every single like I receive from you is my greatest motivation to share these analyses. I sincerely thank everyone who supports me with their likes.🙏

Crucial level for $BTCFor CRYPTOCAP:BTC I'm watching this $108,000-109,000 level for a reaction
Very bullish if the weekly reclaims and closes above, however we are very early in the week to talk about this scenario

GOLD A Fall Expected! SELL!
My dear subscribers,
This is my opinion on the GOLD next move:
The instrument tests an important psychological level 4078.3
Bias - Bearish
Technical Indicators: Supper Trend gives a precise Bearish signal, while Pivot Point HL predicts price changes and potential reversals in the market.
Target - 4050.7
My Stop Loss - 4094.1
About Used Indicators:
On the subsequent day, trading above the pivot point is thought to indicate ongoing bullish sentiment, while trading below the pivot point indicates bearish sentiment.
Disclosure: I am part of Trade Nation's Influencer program and receive a monthly fee for using their TradingView charts in my analysis.
———————————
WISH YOU ALL LUCK

GBPCAD Will Collapse! SELL!
My dear friends,
Please, find my technical outlook for GBPCAD below:
The price is coiling around a solid key level - 1.8524
Bias - Bearish
Technical Indicators: Pivot Points High anticipates a potential price reversal.
Super trend shows a clear sell, giving a perfect indicators' convergence.
Goal - 1.8464
About Used Indicators:
The pivot point itself is simply the average of the high, low and closing prices from the previous trading day.
Disclosure: I am part of Trade Nation's Influencer program and receive a monthly fee for using their TradingView charts in my analysis.
———————————
WISH YOU ALL LUCK

EURGBP Set To Fall! SELL!
My dear subscribers,
My technical analysis for EURGBP is below:
The price is coiling around a solid key level - 0.8812
Bias - Bearish
Technical Indicators: Pivot Points High anticipates a potential price reversal.
Super trend shows a clear sell, giving a perfect indicators' convergence.
Goal - 0.8800
My Stop Loss - 0.8819
About Used Indicators:
By the very nature of the supertrend indicator, it offers firm support and resistance levels for traders to enter and exit trades. Additionally, it also provides signals for setting stop losses
Disclosure: I am part of Trade Nation's Influencer program and receive a monthly fee for using their TradingView charts in my analysis.
———————————
WISH YOU ALL LUCK

EURUSD Buyers In Panic! SELL!
My dear subscribers,
This is my opinion on the EURUSD next move:
The instrument tests an important psychological level 1.1552
Bias - Bearish
Technical Indicators: Supper Trend gives a precise Bearish signal, while Pivot Point HL predicts price changes and potential reversals in the market.
Target - 1.1510
About Used Indicators:
On the subsequent day, trading above the pivot point is thought to indicate ongoing bullish sentiment, while trading below the pivot point indicates bearish sentiment.
Disclosure: I am part of Trade Nation's Influencer program and receive a monthly fee for using their TradingView charts in my analysis.
———————————
WISH YOU ALL LUCK

XAUUSD | Breakout Above Supply Zone – Targeting 4140–4150 NextGold has successfully broken above the supply zone (4020–4060), confirming a bullish structure shift after multiple rejections in the past week. The clean breakout now opens the path for a liquidity grab toward 4140–4150, aligning with higher timeframe inefficiencies.
Trade Plan:
Entry Zone: Retest of 4040–4060 (previous supply turned demand)
Bias: Bullish continuation
Target 1: 4129 (intra-day liquidity level)
Target 2: 4153 (major HTF resistance)
Invalidation: Below 4020

$ASTER Update📊 SEED_WANDERIN_JIMZIP900:ASTER Update
SEED_WANDERIN_JIMZIP900:ASTER is testing the red resistance zone 🔴
If it breaks out above, it could confirm a bullish setup 📈
The first target would be the green line level 🟢

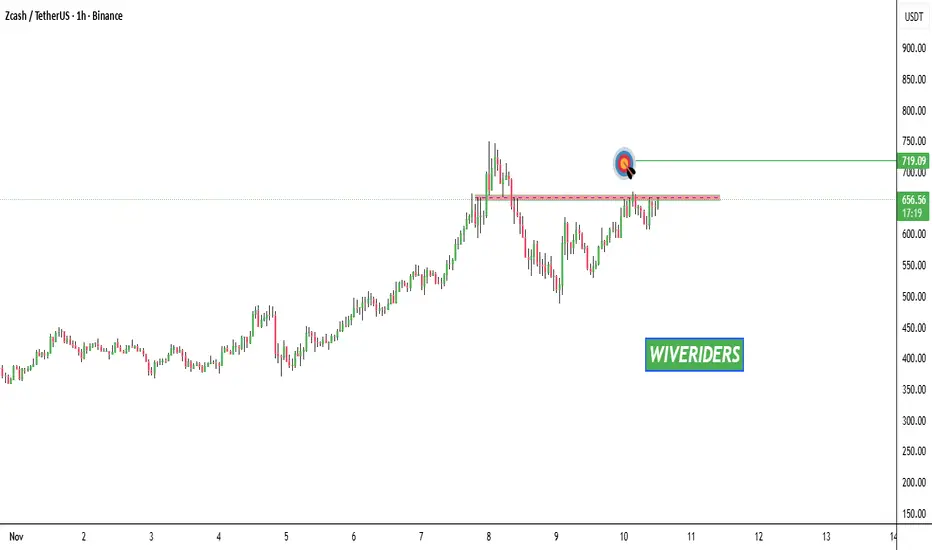
$ZEC Update📊 CRYPTOCAP:ZEC Update
CRYPTOCAP:ZEC is testing the red resistance zone 🔴
If it breaks out above, it could confirm a bullish setup 📈
The first target would be the green line level 🟢
$VIRTUAL Update📊 SPARKS:VIRTUAL Update
SPARKS:VIRTUAL is testing the red resistance zone 🔴
If it breaks out above, it could confirm a bullish setup 📈
The first target would be the green line level 🟢

EURUSD Analysis week 46🌐Fundamental Analysis
With the US government shutdown and no official jobs report, investors are turning to other data. October saw more than 150,000 job cuts – the highest in more than 20 years. This news put the USD under pressure, helping EUR/USD rise on Thursday.
On Friday, the USD recovered slightly, slowing the EUR/USD's rise. If consumer confidence falls sharply, the USD could weaken further. Conversely, if the report is positive and inflation expectations rise, the USD could recover, putting downward pressure on EUR/USD.
🕯Technical Analysis
EURUSD Bullish recovery on Friday with approach to the resistance zone 1.158. Currently the downtrend channel is still maintained if the buying force is strong enough to break the upper boundary of the resistance channel that the pair faces next week at 1.167. On the other side, 1.147 plays the role of the main support of the current downtrend of the pair. As long as the price channel remains, the SELL strategy will still be prioritized. Pay attention to the breakout boundary of 1.153 and 1.158.
📉Trading Signals
SELL EURUSD 1.167-1.169 Stoploss 1.17200
BUY EURUSD 1.147-1.14200 Stoploss 1.14200

$PUMP Update📊 NYSE:PUMP Update
NYSE:PUMP is testing the red resistance zone 🔴
If it breaks out above, it could confirm a bullish setup 📈
The first target would be the green line level 🟢
