US100 Free Signal! Buy!
Hello,Traders!
US100 Price has retraced back into a premium supply area after internal liquidity sweep. Smart money is likely to reprice lower, targeting inefficiency and equal lows beneath the recent range.
---------------------
Stop Loss: 25,256$
Take Profit: 24,951$
Entry Level: 25,133$
Time Frame: 3H
---------------------
Sell!
Comment and subscribe to help us grow!
Check out other forecasts below too!
Disclosure: I am part of Trade Nation's Influencer program and receive a monthly fee for using their TradingView charts in my analysis.
Trading

$STRK Update📊 NASDAQ:STRK Update
NASDAQ:STRK is testing the red resistance zone 🔴
If it breaks out above, it could confirm a bullish setup 📈
The first target would be the green line level 🟢

$UNI Update📊 CRYPTOCAP:UNI Update
CRYPTOCAP:UNI is testing the 🔴 resistance zone — a breakout could confirm a bullish setup 📈
If confirmed, first target is the 🟢 level —

DCR Update📊 PSX:DCR Update
PSX:DCR is testing the red resistance zone 🔴
If it breaks out above, it could confirm a bullish setup 📈
The first target would be the green line level 🟢

SPY FREE SIGNAL|SHORT|
✅SPY is currently retesting a premium supply zone after clearing buy-side liquidity. If the retest confirms rejection with displacement, a bearish continuation toward imbalance below is likely.
—————————
Entry: 670.89$
Stop Loss: 674.31$
Take Profit: 666.68$
Time Frame: 2H
—————————
SHORT🔥
✅Like and subscribe to never miss a new idea!✅

GBP-USD Will Keep Growing! Buy!
Hello,Traders!
GBPUSD smart money confirmed a bullish structure shift after sweeping sell-side liquidity. Price broke out from a demand range and is likely to retest before expansion to premium levels. Time Frame 2H.
Buy!
Comment and subscribe to help us grow!
Check out other forecasts below too!
Disclosure: I am part of Trade Nation's Influencer program and receive a monthly fee for using their TradingView charts in my analysis.

EURUSD MOVE UP AHEAD|LONG|
✅EURUSD retraced into a refined bullish order block within the discount zone, showing strong displacement after mitigation. Liquidity below equal lows has been swept, favoring a continuation toward premium imbalance. Time Frame 2H.
LONG🚀
✅Like and subscribe to never miss a new idea!✅

ETHUSD: Strong Bearish Sentiment! Short!
My dear friends,
Today we will analyse ETHUSD together☺️
The market is at an inflection zone and price has now reached an area around 3,524.1 where previous reversals or breakouts have occurred.And a price reaction that we are seeing on multiple timeframes here could signal the next move down so we can enter on confirmation, and target the next key level of 3,476.5.Stop-loss is recommended beyond the inflection zone.
❤️Sending you lots of Love and Hugs❤️

BTCUSD: Bulls Are Winning! Long!
My dear friends,
Today we will analyse BTCUSD together☺️
The price is near a wide key level
and the pair is approaching a significant decision level of 103,243.74 Therefore, a strong bullish reaction here could determine the next move up.We will watch for a confirmation candle, and then target the next key level of 103,728.28.Recommend Stop-loss is beyond the current level.
❤️Sending you lots of Love and Hugs❤️

EURUSD Trading Opportunity! SELL!
My dear subscribers,
EURUSD looks like it will make a good move, and here are the details:
The market is trading on 1.1567 pivot level.
Bias - Bearish
Technical Indicators: Both Super Trend & Pivot HL indicate a highly probable Bearish continuation.
Target - 1.1523
About Used Indicators:
The average true range (ATR) plays an important role in 'Supertrend' as the indicator uses ATR to calculate its value. The ATR indicator signals the degree of price volatility.
Disclosure: I am part of Trade Nation's Influencer program and receive a monthly fee for using their TradingView charts in my analysis.
———————————
WISH YOU ALL LUCK

NATGAS Set To Grow! BUY!
My dear friends,
Please, find my technical outlook for NATGAS below:
The price is coiling around a solid key level - 4.324
Bias - Bullish
Technical Indicators: Pivot Points Low anticipates a potential price reversal.
Super trend shows a clear buy, giving a perfect indicators' convergence.
Goal - 4.368
Safe Stop Loss - 4.295
About Used Indicators:
The pivot point itself is simply the average of the high, low and closing prices from the previous trading day.
Disclosure: I am part of Trade Nation's Influencer program and receive a monthly fee for using their TradingView charts in my analysis.
———————————
WISH YOU ALL LUCK

QQQ Will Explode! BUY!
My dear followers,
This is my opinion on the QQQ next move:
The asset is approaching an important pivot point 609.75
Bias - Bullish
Technical Indicators: Supper Trend generates a clear long signal while Pivot Point HL is currently determining the overall Bullish trend of the market.
Goal - 622.40
About Used Indicators:
For more efficient signals, super-trend is used in combination with other indicators like Pivot Points.
Disclosure: I am part of Trade Nation's Influencer program and receive a monthly fee for using their TradingView charts in my analysis.
———————————
WISH YOU ALL LUCK

APPLE The Target Is UP! BUY!
My dear friends,
My technical analysis for APPLE is below:
The market is trading on 268.53 pivot level.
Bias - Bullish
Technical Indicators: Both Super Trend & Pivot HL indicate a highly probable Bullish continuation.
Target - 271.24
Recommended Stop Loss - 266.96
About Used Indicators:
A pivot point is a technical analysis indicator, or calculations, used to determine the overall trend of the market over different time frames.
Disclosure: I am part of Trade Nation's Influencer program and receive a monthly fee for using their TradingView charts in my analysis.
———————————
WISH YOU ALL LUCK

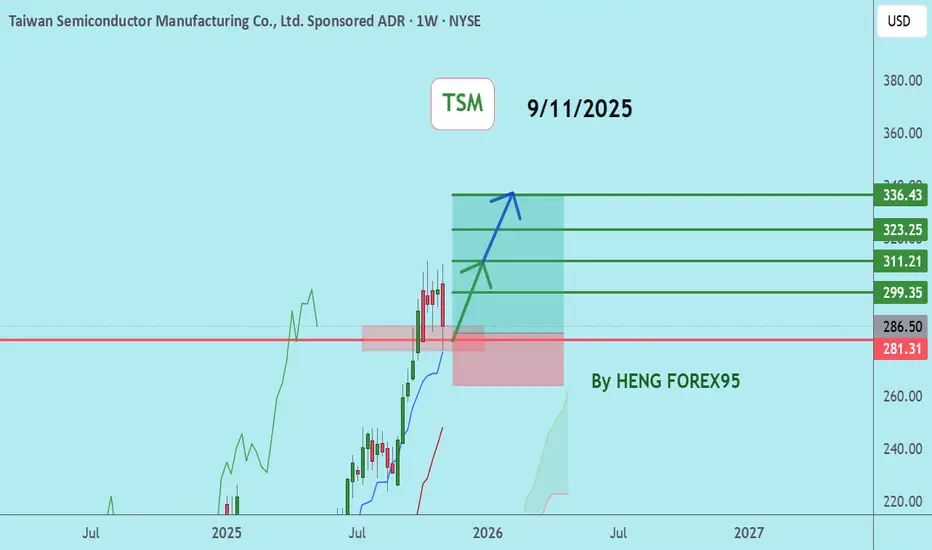
TSMTaiwan Semiconductor Manufacturing Company Limited (TSM) pioneered the pure-play foundry business model and has consistently emerged as a global leader in specialty semiconductor foundries.
The overall trend remains bullish, but the price is currently undergoing a short-term correction. The price is currently in the key support zone of 283-274. If the price can hold above 274, a rebound is likely.
🔥Trading futures, forex, CFDs and stocks carries a risk of loss.
Please consider carefully whether such trading is suitable for you.
This content is not financial advice. Always conduct your own financial due diligence.
>>GooD Luck 😊
❤️ Like and subscribe to never miss a new idea!
EUR/USD on both sides Trade Idea Breakdown:
Any break above the yellow line and a retest validates a continual uptrend, BUT CONSTRUCTIVELY THE OVERALL TREND IN THE MONTHLY IS DOWNWARDS. FOLLOWING THE RED ARROW POINTING DOWNWARD TILL THE END OF THE YEAR I RIDE IT DOWNWARD. MERRY CHRISTMAS 🎅 🎄 AND A HAPPY NEW YEAR.
• Entry Point: I am looking to enter the position around 1.15664, which is the current price.
• Target: The first target could be at 1.15920, followed by 1.16416. If the price moves strongly, the next target is the resistance at 1.17826.
• Stop Loss: A logical stop loss would be below the nearest support, perhaps around 1.15179, which offers a solid risk-to-reward ratio.
• Risk-to-Reward: The setup suggests the trader is expecting a bullish move, but risk management seems to be in place with the proposed stop-loss levels.
My General Outlook:
• The price appears to be in an uptrend with a healthy pullback toward support levels.
• The trade setup looks positive, but it is critical to watch for any reversal signals around resistance levels.
• External factors (such as economic events or data releases happening on Wednesday might be a big factor pushing higher) might affect the EUR/USD pair, so monitoring those is key.
Note :
This is not a financial advise, its important that you do your own research before taking any trade idea. This trade idea seems well thought out, assuming the uptrend continues. It’s important to keep an eye on the overall trend, support levels, and resistance zones for any signs of reversal or confirmation for further upside, ensure to do your own research for this is not a financial advise, this is only for educational purposes. Your reaction will be appreciated and comments.

DXY Will Go Lower! Short!
Please, check our technical outlook for DXY.
Time Frame: 5h
Current Trend: Bearish
Sentiment: Overbought (based on 7-period RSI)
Forecast: Bearish
The market is approaching a significant resistance area 99.554.
Due to the fact that we see a positive bearish reaction from the underlined area, I strongly believe that sellers will manage to push the price all the way down to 99.097 level.
P.S
We determine oversold/overbought condition with RSI indicator.
When it drops below 30 - the market is considered to be oversold.
When it bounces above 70 - the market is considered to be overbought.
Like and subscribe and comment my ideas if you enjoy them!

EURUSD Will Go Up! Long!
Here is our detailed technical review for EURUSD.
Time Frame: 12h
Current Trend: Bullish
Sentiment: Oversold (based on 7-period RSI)
Forecast: Bullish
The market is on a crucial zone of demand 1.156.
The oversold market condition in a combination with key structure gives us a relatively strong bullish signal with goal 1.169 level.
P.S
Overbought describes a period of time where there has been a significant and consistent upward move in price over a period of time without much pullback.
Like and subscribe and comment my ideas if you enjoy them!

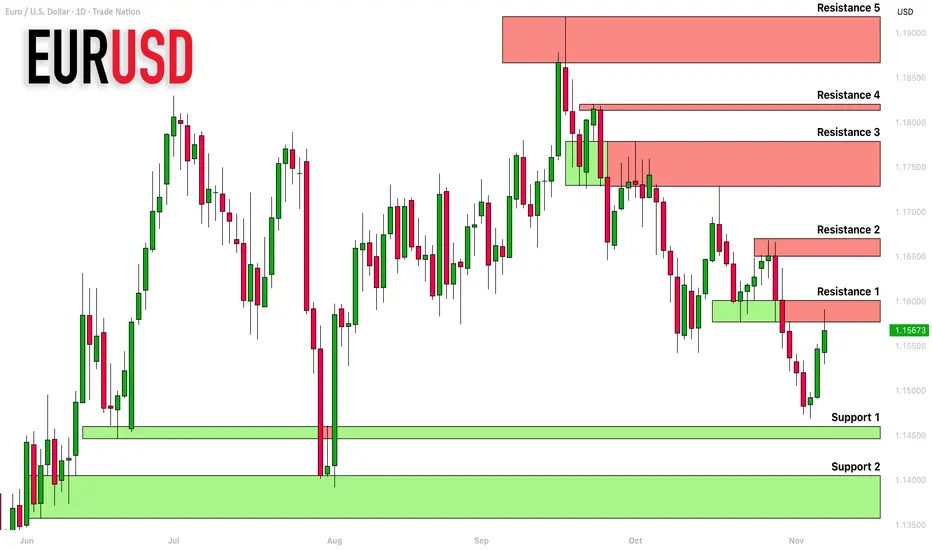
EURUSD: Support & Resistance Analysis For Next Week 🇪🇺🇺🇸
Here is my latest structure analysis and important
supports and resistances for EURUSD for next week.
Consider these structures for pullback/breakout trading.
❤️Please, support my work with like, thank you!❤️
I am part of Trade Nation's Influencer program and receive a monthly fee for using their TradingView charts in my analysis.
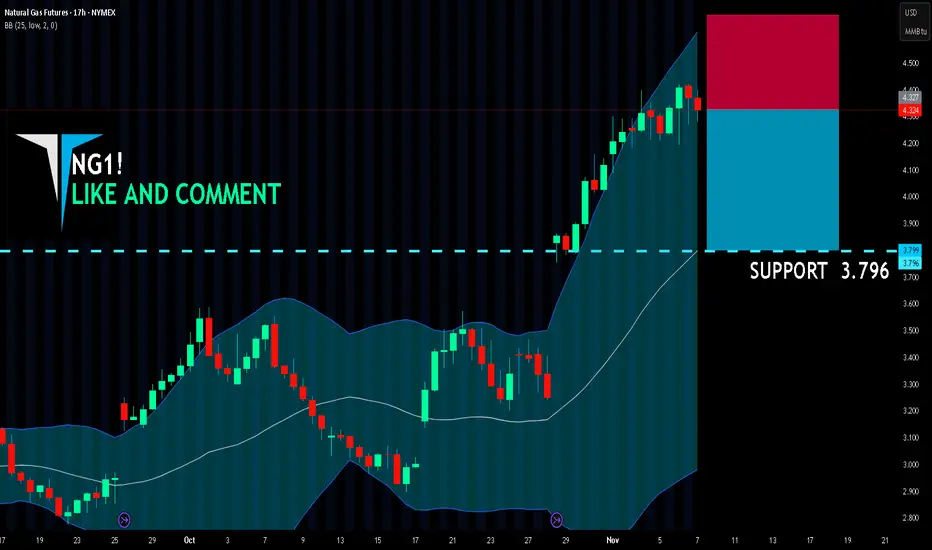
NG1! BEST PLACE TO SELL FROM|SHORT
NG1! SIGNAL
Trade Direction: short
Entry Level: 4.327
Target Level: 3.796
Stop Loss: 4.678
RISK PROFILE
Risk level: medium
Suggested risk: 1%
Timeframe: 17h
Disclosure: I am part of Trade Nation's Influencer program and receive a monthly fee for using their TradingView charts in my analysis.
✅LIKE AND COMMENT MY IDEAS✅
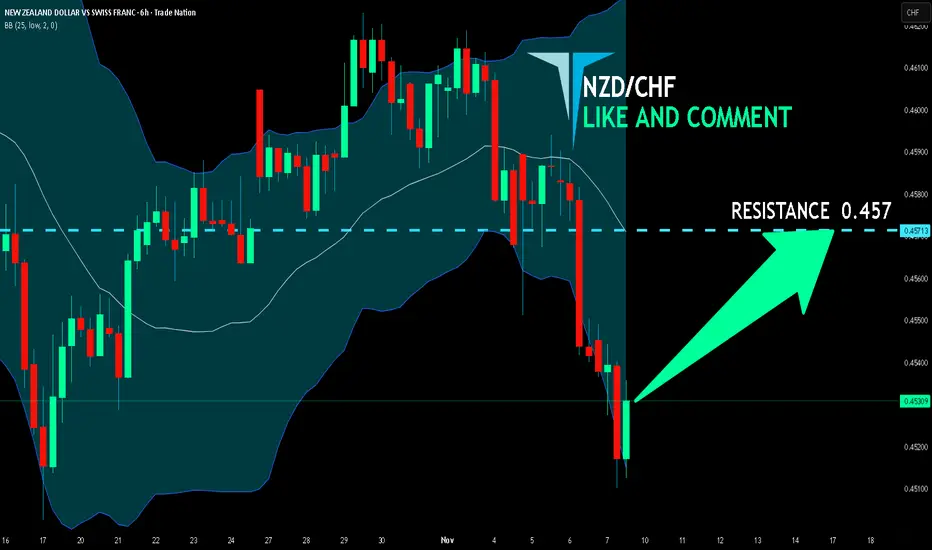
NZD/CHF BULLS ARE STRONG HERE|LONG
Hello, Friends!
NZD/CHF pair is in the uptrend because previous week’s candle is green, while the price is obviously falling on the 6H timeframe. And after the retest of the support line below I believe we will see a move up towards the target above at 0.457 because the pair is oversold due to its proximity to the lower BB band and a bullish correction is likely.
Disclosure: I am part of Trade Nation's Influencer program and receive a monthly fee for using their TradingView charts in my analysis.
✅LIKE AND COMMENT MY IDEAS✅
EUR/USD Could Drop Soon — Watch This 4H FVG Area!Hi everyone, this is my new analysis on EUR/USD.
As you can see, the price is currently in a downtrend on the 4-hour timeframe.
We have a clear Fair Value Gap (FVG) that aligns with the downtrend line. At the same time, the price is approaching the 61.8% Fibonacci retracement level, while the DXY chart is sitting at a support zone.
Based on this confluence, I expect the price to reach the 4H FVG zone soon.
Once it gets there, we need to wait for a Change of Character (CHOCH) to the downside on the 15-minute or 5-minute timeframe before entering a sell position.
I’ve also marked the daily support level on the chart. I expect the price to create a new low and test this daily support before any potential bounce.
⚠️ Important:
If we don’t see any CHOCH on the 15M or 5M timeframe once the price reaches the FVG zone, then this setup becomes invalid.
The setup is only valid if the price taps into the 4H FVG and shows a clear CHOCH to the downside — that’s our signal to go short.
This setup offers a very good risk-to-reward ratio if confirmed.

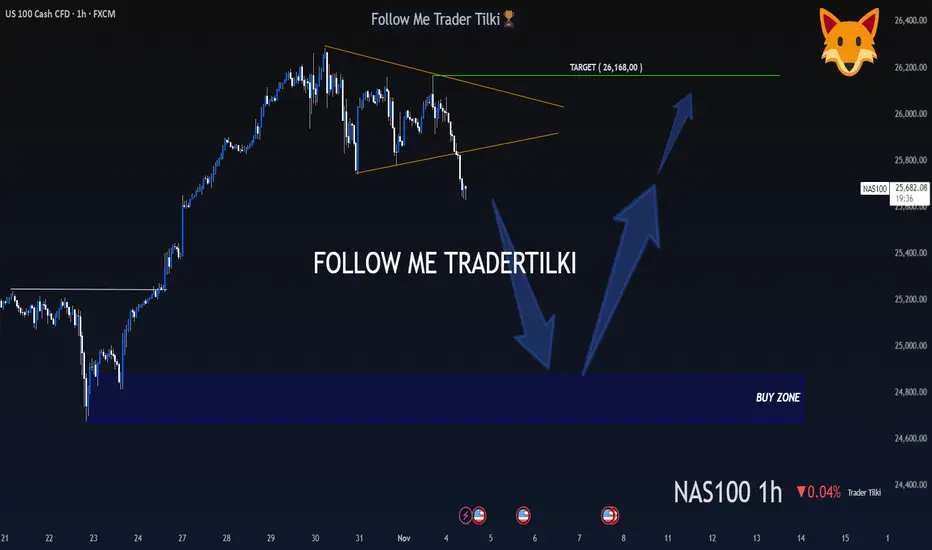
A Hunter Waits Patiently, Then Strikes Like a Lion - US100 - 1HMy dear friends, greetings,
My friends, I have set the buy levels for US100 at 24,872 and 24,677.
I will never enter a trade or put myself at unnecessary risk before these levels are reached.
My friends, in order to consistently win in this market and to become a successful trader, patience is essential.
If you act with patience and strategy, you will always be a winning trader, just like me.
I would also like you to know that my target is set at the 26,168 level.
My friends, every single like from you is my greatest motivation to share these analyses.
I sincerely thank everyone who supports me with their appreciation.
With my respect and love.
NZDUSD LOCAL SHORT|
✅NZDUSD Price retraced to a premium zone, tapping into an unmitigated supply block that aligns with prior imbalance. A short-term bearish delivery is expected toward the discounted area below. Time Frame 1H.
SHORT🔥
✅Like and subscribe to never miss a new idea!✅
