EURJPY Will Move Lower! Short!
Here is our detailed technical review for EURJPY.
Time Frame: 12h
Current Trend: Bearish
Sentiment: Overbought (based on 7-period RSI)
Forecast: Bearish
The market is on a crucial zone of supply 178.721.
The above-mentioned technicals clearly indicate the dominance of sellers on the market. I recommend shorting the instrument, aiming at 176.803 level.
P.S
Overbought describes a period of time where there has been a significant and consistent upward move in price over a period of time without much pullback.
Like and subscribe and comment my ideas if you enjoy them!
Trading

USDJPY Is Going Down! Short!
Here is our detailed technical review for USDJPY.
Time Frame: 2h
Current Trend: Bearish
Sentiment: Overbought (based on 7-period RSI)
Forecast: Bearish
The market is on a crucial zone of supply 154.213.
The above-mentioned technicals clearly indicate the dominance of sellers on the market. I recommend shorting the instrument, aiming at 153.254 level.
P.S
The term oversold refers to a condition where an asset has traded lower in price and has the potential for a price bounce.
Overbought refers to market scenarios where the instrument is traded considerably higher than its fair value. Overvaluation is caused by market sentiments when there is positive news.
Like and subscribe and comment my ideas if you enjoy them!

Gold Price Targets $4,005 Amid Uptrend SupportGold price is trading near $3,984, maintaining support above the ascending trendline. The chart suggests a potential bullish move toward the $4,005 target if the uptrend holds, with key support around $3,963.

EUR/USD Bearish Reversal SetupEUR/USD 1-hour chart shows a potential bearish move after a break of structure (BOS). Price is expected to decline from the 1.1529 resistance zone toward the 1.1510 target level.

XAUUSD – WAITING FOR CONFIRMATION OF UPTREND – TARGET 4050 💛 XAUUSD – WAITING FOR CONFIRMATION OF UPTREND – TARGET 4050 🎯
🌤 1. Overview
Hello everyone 💬
Gold today is still in a phase of hesitation – waiting for signals to confirm a new trend.
On the H2 chart, the price has broken the downtrend line and is retesting this line. The structure of “higher lows” indicates that buying power is gradually gaining the upper hand.
The previous peak around 4018 is currently the decisive point for the trend – if the price confirms a breakout above, the uptrend could extend towards the 4050 area.
Currently, the market is fluctuating within the range of 3964 – 4018, and needs to break out of this range to determine a clearer direction.
💹 2. ICT Perspective
📈 The price has broken the downtrend line and retested the structure on the H2 chart – an early signal for the potential formation of an uptrend.
🟣 The 3964–4018 area is a short-term liquidity accumulation zone before the price expands.
🔹 OB 4040–4042 coincides with significant resistance, suitable for short sell (scalp) orders if there is a strong reaction.
💫 When the price exceeds 4018, the uptrend structure will be confirmed and the expansion target could head towards 4050 – 4077.
🎯 3. Reference Trading Plan
💖 BUY Scenario (priority when confirmed)
Entry: above 4018 | SL: 4011
TP: 4025 – 4033 – 4050 – 4077
💢 Short SELL Scenario (scalping)
Entry: 4040–4042 | SL: 4046
TP: 4022 – 4015 – 3998
⚠️ 4. Important Notes
Clear confirmation is needed when breaking the 4018 area before entering a buy order.
If the price continues to fluctuate within the 3964–4018 range, trading should be limited.
Today is Friday, manage risk more strictly, prioritize accuracy in each order.
🌷 5. Conclusion & Interaction with LanaM2
Gold is showing positive signals 💛
Be patient and wait for reactions around the 4018 area – this could be the start of a new uptrend if clearly confirmed.

$SPY $SPX Scenarios — Friday, Nov 7, 2025🔮 AMEX:SPY SP:SPX Scenarios — Friday, Nov 7, 2025 🔮
🌍 Market-Moving Headlines
🚩 Jobs Day: The October Employment Report headlines Friday, with payrolls expected at -60,000 and the unemployment rate rising to 4.5% — signaling labor market cooling.
📉 Policy implications: A weak print would reinforce expectations for multiple rate cuts in early 2026, while upside surprises could stall the dovish momentum.
💬 Fed watch: Morning remarks from Williams and Jefferson set the tone before the data drop; Miran rounds out the week with a late-day speech.
⚠️ Shutdown delays: The Employment Report and related labor metrics are at risk of delay pending government data releases, adding uncertainty to Friday’s open.
📊 Sentiment & credit check: U-Mich Consumer Sentiment and Consumer Credit round out the macro picture.
📊 Key Data and Events (ET)
⏰ 3:00 AM — John Williams (NY Fed) speech
⏰ 7:00 AM — Philip Jefferson (Fed Vice Chair) speech
⏰ 🚩 8:30 AM — U.S. Employment Report (Oct) — subject to delay
• Nonfarm Payrolls: -60,000
• Unemployment Rate: 4.5%
• Hourly Wages (MoM): 0.3%
⏰ 10:00 AM — UMich Consumer Sentiment (Prelim, Nov) | 53.0 expected
⏰ 3:00 PM — Consumer Credit (Sept) | $10.0B expected
⏰ 3:00 PM — Stephen Miran (Fed Gov) speech
⚠️ Note:
The Employment Report, Unemployment Rate, and Wage Data are flagged at risk of delay due to the government shutdown. All other releases are expected on time. Market volatility will hinge on whether the data prints or is postponed.
⚠️ Disclaimer: Educational and informational only — not financial advice.
📌 #trading #stockmarket #SPY #SPX #JobsReport #NFP #Fed #Jefferson #Williams #inflation #yields #macro #shutdown

GBPCAD FREE SIGNAL|
✅GBPCAD tapped into a premium supply zone and reacted with bearish displacement, confirming distribution phase. Expect continuation toward the next internal liquidity pool below. Time Frame 4H.
SHORT🔥
✅Like and subscribe to never miss a new idea!✅

EUR-USD Move Down Ahead! Sell!
Hello,Traders!
EURUSD traded back into a premium supply zone after internal liquidity sweep, showing bearish displacement from the order block. Expect continuation lower toward the next liquidity void. Time Frame 5H.
Sell!
Comment and subscribe to help us grow!
Check out other forecasts below too!
Disclosure: I am part of Trade Nation's Influencer program and receive a monthly fee for using their TradingView charts in my analysis.

EURAUD LOCAL SHORT|
✅EURAUD Price reached a premium supply level, engineered liquidity above equal highs, and confirmed bearish displacement. Expect continuation lower as smart money targets sell-side liquidity below. Time Frame 3H.
SHORT🔥
✅Like and subscribe to never miss a new idea!✅

GBP-USD Free Signal! Sell!
Hello,Traders!
GBPUSD tapped into a premium supply zone, creating a liquidity grab above equal highs and forming bearish displacement—confirming order block mitigation.
---------------------
Stop Loss: 1.3166$
Take Profit: 1.3110$
Entry Level: 1.3144$
Time Frame: 2H
---------------------
Sell!
Comment and subscribe to help us grow!
Check out other forecasts below too!
Disclosure: I am part of Trade Nation's Influencer program and receive a monthly fee for using their TradingView charts in my analysis.

BTC to Gold Cracking Lower! CAUTION!This could end up turning into a significant crack! for BTC relative to Gold. We have a fight on our hands between Speculation (BTC) and a Safe asset (Gold)
For over 4 years, speculation has not been able to outperform safety, and it is now starting to break lower.
CAUTION! is in order!
Click boost, follow, for more authentic, no BS, raw analysis. Let's get to 5,000 followers. ))

NZDJPY Expected Growth! BUY!
My dear followers,
I analysed this chart on NZDJPY and concluded the following:
The market is trading on 86.179 pivot level.
Bias - Bullish
Technical Indicators: Both Super Trend & Pivot HL indicate a highly probable Bullish continuation.
Target - 86.570
Safe Stop Loss - 85.959
About Used Indicators:
A super-trend indicator is plotted on either above or below the closing price to signal a buy or sell. The indicator changes color, based on whether or not you should be buying. If the super-trend indicator moves below the closing price, the indicator turns green, and it signals an entry point or points to buy.
Disclosure: I am part of Trade Nation's Influencer program and receive a monthly fee for using their TradingView charts in my analysis.
———————————
WISH YOU ALL LUCK

DXY: Bulls Are Winning! Long!
My dear friends,
Today we will analyse DXY together☺️
The recent price action suggests a shift in mid-term momentum. A break above the current local range around 99.374 will confirm the new direction upwards with the target being the next key level of 99.512 and a reconvened placement of a stop-loss beyond the range.
❤️Sending you lots of Love and Hugs❤️

EURUSD: Next Move Is Down! Short!
My dear friends,
Today we will analyse EURUSD together☺️
The in-trend continuation seems likely as the current long-term trend appears to be strong, and price is holding below a key level of 1.15387 So a bearish continuation seems plausible, targeting the next low. We should enter on confirmation, and place a stop-loss beyond the recent swing level.
❤️Sending you lots of Love and Hugs❤️

GOLD: Target Is Up! Long!
My dear friends,
Today we will analyse GOLD together☺️
The market is at an inflection zone and price has now reached an area around 3,981.86 where previous reversals or breakouts have occurred.And a price reaction that we are seeing on multiple timeframes here could signal the next move up so we can enter on confirmation, and target the next key level of 3,998.52.Stop-loss is recommended beyond the inflection zone.
❤️Sending you lots of Love and Hugs❤️

SILVER: Move Down Expected! Short!
My dear friends,
Today we will analyse SILVER together☺️
The price is near a wide key level
and the pair is approaching a significant decision level of 48.04537 Therefore, a strong bearish reaction here could determine the next move down.We will watch for a confirmation candle, and then target the next key level of 47.67724.Recommend Stop-loss is beyond the current level.
❤️Sending you lots of Love and Hugs❤️

EURUSD CORRECTION AHEAD|SHORT|
✅EURUSD retraced into a premium supply level after a clear bearish displacement, mitigating an order block and collecting liquidity above short-term highs. Expect continuation toward the downside. Time Frame 3H.
SHORT🔥
✅Like and subscribe to never miss a new idea!✅

EURAUD The Target Is DOWN! SELL!
My dear friends,
My technical analysis for EURAUD is below:
The market is trading on 1.7773 pivot level.
Bias - Bearish
Technical Indicators: Both Super Trend & Pivot HL indicate a highly probable Bearish continuation.
Target - 1.7703
About Used Indicators:
A pivot point is a technical analysis indicator, or calculations, used to determine the overall trend of the market over different time frames.
Disclosure: I am part of Trade Nation's Influencer program and receive a monthly fee for using their TradingView charts in my analysis.
———————————
WISH YOU ALL LUCK

#AN026: Trump, the US as a Bitcoin Superpower
In a recent speech in Miami, Donald Trump declared a radical shift in his vision for cryptocurrencies, with a strong and clear message: the United States must become the "Bitcoin Superpower" and the cryptocurrency capital of the world. Hello, I'm Andrea Russo, an independent forex trader and prop trader with $200,000 in capital under management, and I thank you in advance for your time.
This statement comes after years of political uncertainty and critical federal regulations targeting the crypto sector. Now, under Trump's leadership, the narrative seems set to change, with an embrace of the potential of Bitcoin and other cryptocurrencies.
In his speech, Trump made a bold statement: "Crypto was under siege, but with my administration, things change." The former president emphasized that global competition, particularly from China, could threaten the United States' dominant position in the cryptocurrency world. In response, he proposed a vision in which the United States not only regains control but also establishes itself as a global leader in Bitcoin.
Trump suggested that a robust crypto infrastructure could be key to maintaining the dollar's supremacy, now considered the most important global medium of exchange. "If we don't act, China will take over," he warned, referring to the Asian nation's growing influence in the blockchain and cryptocurrency sectors.
Trump's words could mark a turning point in the relationship between government and cryptocurrencies. If these statements translate into favorable policies, the United States could further strengthen its position in the crypto industry, incentivizing the adoption of blockchain-based technologies and creating a clearer regulatory environment for cryptocurrencies.
However, as with any policy statement, uncertainty remains. Trump has not provided concrete details on how he intends to achieve these goals or what type of legislation might be introduced. For investors, this means that market expectations may fluctuate, while concrete developments may be slow in coming.
Trump's vision of America as a crypto superpower could represent a new phase in the evolution of cryptocurrencies, particularly for Bitcoin, which is often at the center of global debates. However, the path to realizing this vision is unclear and could depend on various economic and political factors. Investors and traders should remain vigilant, monitoring future policy moves, which could significantly impact cryptocurrency volatility and adoption in the United States.
In conclusion, while Trump's sentiment may be positive for the crypto market in the short term, the real challenge will be the ability to translate words into concrete actions, creating an environment that fosters innovation and expansion in the crypto sector.

SUI Approaching Major Support – Long Spot OpportunitySUI has entered a key support zone between $1.82 – $1.96, a level that has historically shown strong demand. Price is consolidating near the upper end of this zone, which could indicate potential accumulation. If this level holds, it presents a solid opportunity for a long spot entry.
🔹 Entry Zone: $1.82 – $1.96
🔹 Stop Loss: Below $1.75
🔹 Take Profit Targets:
• TP1: $2.40 – $2.80
• TP2: $3.10 – $3.55
This setup offers a favorable risk-to-reward ratio, especially if volume and market momentum align with the bounce. Watch for bullish confirmation signals—such as strong candle closes or rising volume—within the support zone before entering. Always respect the stop loss to protect capital.

HD Trade Setup – Retesting Support After 5% SurgeHome Depot NYSE:HD has bounced nearly 5% since our last post and is now retesting a major support zone between $375 – $380. This zone has consistently acted as a base, and the current price action suggests buyers may be stepping back in — potentially setting up for another bullish move.
📈 Trade Idea
Entry Zone: $375 – $380
Take Profit Targets:
TP1: $400 – $412
TP2: $423 – $435
Stop Loss: Just below $370
The setup offers a clean risk-to-reward structure with the broader market still holding a bullish bias. Watch for volume confirmation or bullish candlestick signals to strengthen the case.

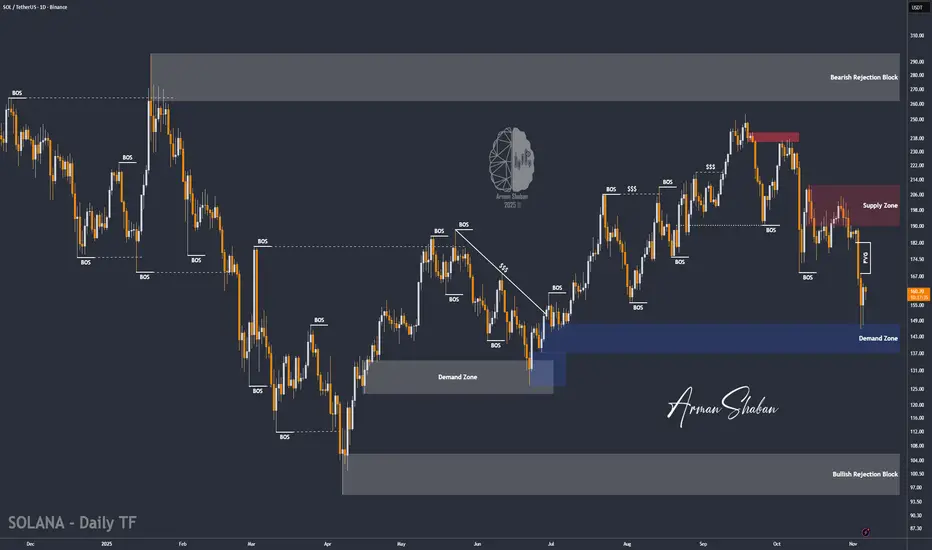
SOL/USDT | Solana Rebounds From $146 – Bulls Back in Control!By analyzing the #Solana chart on the daily timeframe, we can see that after correcting to $146, the price found strong demand and is now trading around $160.
If Solana manages to hold above the key demand zone of $137–$147, we can expect further upside movement. The medium-term targets are $168, $182, and $196. This analysis will be updated soon.
Please support me with your likes and comments to motivate me to share more analysis with you and share your opinion about the possible trend of this chart with me !
Best Regards , Arman Shaban
GOLD BEARS ARE STRONG HERE|SHORT
GOLD SIGNAL
Trade Direction: short
Entry Level: 4,007.34
Target Level: 3,924.43
Stop Loss: 4,062.61
RISK PROFILE
Risk level: medium
Suggested risk: 1%
Timeframe: 4h
Disclosure: I am part of Trade Nation's Influencer program and receive a monthly fee for using their TradingView charts in my analysis.
✅LIKE AND COMMENT MY IDEAS✅
