Forex Market AnalysisIntroduction
The foreign exchange (Forex) market is the largest and most liquid financial market globally, with an average daily turnover exceeding $8 trillion. Unlike stock markets, which are centralized, the Forex market is decentralized, operating 24 hours a day across global financial hubs, including London, New York, Tokyo, and Sydney. Forex trading involves the exchange of one currency for another, usually quoted in currency pairs such as EUR/USD, GBP/JPY, or USD/INR. The objective of Forex analysis is to understand market behavior, predict future price movements, and develop strategies for profitable trading.
Forex market analysis is broadly categorized into fundamental analysis, technical analysis, and sentiment analysis, each playing a critical role in decision-making. Understanding these approaches, combined with risk management, helps traders navigate the complexities of global currency markets.
1. Structure of the Forex Market
The Forex market consists of several participants:
Commercial Banks – The largest players, providing liquidity to the market and facilitating currency transactions for clients.
Central Banks – Influence currency values through monetary policy, interest rate decisions, and interventions.
Hedge Funds and Investment Firms – Engage in speculative trading and arbitrage opportunities.
Corporations – Manage currency risk due to international trade and investments.
Retail Traders – Individual traders accessing the market via brokers and trading platforms.
The market operates in three major sessions:
Asian Session (Tokyo, Hong Kong, Singapore) – Characterized by low volatility, often setting the initial trend for the day.
European Session (London, Frankfurt) – High liquidity and volatility, major economic data releases happen here.
North American Session (New York) – High volatility overlaps with London session, critical for trend continuation or reversal.
2. Key Drivers of Forex Market Movements
Forex prices fluctuate due to multiple factors:
2.1 Macroeconomic Indicators
Economic data from countries heavily influence currency valuation:
Gross Domestic Product (GDP) – A strong GDP indicates economic growth, increasing currency demand.
Inflation Rate – High inflation can devalue a currency unless matched by interest rate hikes.
Unemployment Rate – Lower unemployment signals economic strength, supporting currency appreciation.
Trade Balance – A trade surplus strengthens a currency, while a deficit can weaken it.
2.2 Central Bank Policies
Central banks control money supply, influencing currency strength:
Interest Rates – Higher rates attract foreign capital, boosting currency value.
Quantitative Easing (QE) – Increases money supply, often weakening the currency.
Interventions – Direct buying or selling of currencies to stabilize markets.
2.3 Geopolitical Events
Political stability and global events create volatility:
Elections, trade wars, sanctions, or conflicts can cause sharp currency swings.
Brexit in 2016 caused significant GBP volatility due to uncertainty.
2.4 Market Sentiment
Market psychology affects short-term price action:
Traders’ perception of risk vs. safety drives flows into risk-on or risk-off currencies.
Safe-haven currencies like USD, JPY, and CHF rise during global uncertainty.
3. Types of Forex Market Analysis
3.1 Fundamental Analysis
Fundamental analysis evaluates a currency’s intrinsic value by studying economic indicators, political stability, and monetary policies.
Example: If the US Federal Reserve signals a rate hike while the European Central Bank maintains low rates, the USD may strengthen against the EUR.
Long-term trends are usually driven by fundamentals.
Traders rely on economic calendars to track critical releases like NFP (Non-Farm Payrolls), CPI (Consumer Price Index), and interest rate decisions.
Advantages:
Predicts long-term trends.
Useful for carry trades (earning interest rate differentials).
Limitations:
Short-term volatility can override fundamentals.
Requires continuous monitoring of global developments.
3.2 Technical Analysis
Technical analysis studies past price movements to forecast future trends using charts and indicators.
Chart Patterns: Head and shoulders, double tops/bottoms, triangles, flags.
Trend Analysis: Identifying upward, downward, or sideways trends.
Indicators: Moving Averages, RSI (Relative Strength Index), MACD, Bollinger Bands.
Support & Resistance Levels: Key zones where prices often reverse.
Advantages:
Works for short-term and intraday trading.
Provides entry, exit, and stop-loss levels.
Limitations:
Can be misleading during extreme news events.
Requires discipline and risk management to avoid overtrading.
3.3 Sentiment Analysis
Sentiment analysis gauges trader behavior and market positioning:
Commitment of Traders (COT) Reports: Show positions of commercial and speculative traders.
Retail Sentiment: Broker platforms provide data on long vs. short positions.
Market sentiment can create contrarian trading opportunities when the majority is overly bullish or bearish.
4. Popular Forex Trading Strategies
4.1 Trend Following
Trades with the market trend (uptrend or downtrend).
Tools: Moving averages, trendlines, MACD.
Best for markets with strong directional movement.
4.2 Range Trading
Buying near support and selling near resistance in sideways markets.
Tools: RSI, Bollinger Bands, support/resistance zones.
Suitable for low volatility periods.
4.3 Breakout Trading
Trading when price breaks key support/resistance levels.
Tools: Volume indicators, volatility measures.
Can capture strong momentum but carries higher risk of false breakouts.
4.4 Carry Trade
Borrowing in low-interest currency and investing in high-interest currency.
Profitable when interest rate differentials are stable.
Sensitive to sudden volatility and geopolitical risks.
4.5 Scalping
Short-term trading aiming for small profits per trade.
Requires high liquidity, tight spreads, and fast execution.
5. Risk Management in Forex
Risk management is crucial due to high leverage (up to 1:500 in some brokers):
Position Sizing: Avoid risking more than 1–2% of capital per trade.
Stop-Loss Orders: Limit losses on adverse moves.
Take-Profit Orders: Secure gains when price reaches target.
Diversification: Avoid concentrating on a single currency pair.
Leverage Control: Use leverage responsibly to prevent margin calls.
Emotional discipline is also vital. Overtrading and revenge trading often result from poor risk management.
6. Market Trends and Recent Developments
The Forex market is influenced by evolving global conditions:
US Dollar Dominance: USD remains the reserve currency, heavily influencing global liquidity.
Emerging Market Currencies: Currencies like INR, BRL, and TRY are more volatile but offer higher returns.
Cryptocurrency Influence: Bitcoin and stablecoins are increasingly part of global liquidity dynamics.
Geopolitical Risks: Trade wars, sanctions, and conflicts continue to impact currency correlations.
Example: In 2025, tightening US monetary policy and European energy crises caused significant EUR/USD volatility. Similarly, USD/INR movements have been sensitive to RBI policy and global oil prices.
7. Tools and Resources for Forex Analysis
Traders rely on both platforms and data for analysis:
Trading Platforms: MetaTrader 4/5, cTrader, NinjaTrader for charting and execution.
Economic Calendars: Forex Factory, Investing.com, DailyFX.
News Sources: Bloomberg, Reuters, Financial Times.
Analytical Tools: Autochartist, TradingView, and AI-powered signals.
Combining tools ensures informed decision-making, blending both technical and fundamental perspectives.
8. Psychological Aspects of Forex Trading
Trading success is not only analytical but psychological:
Discipline: Stick to a trading plan without impulsive decisions.
Patience: Wait for high-probability setups.
Emotional Control: Fear and greed can cloud judgment.
Consistency: Focus on long-term profitability rather than short-term gains.
Experienced traders often maintain journals, track performance metrics, and review mistakes for continuous improvement.
9. Conclusion
Forex market analysis is a multidimensional process involving economic, technical, and psychological factors. Successful trading requires:
Understanding global macroeconomic conditions and central bank policies.
Applying technical tools to identify trends, support/resistance, and price patterns.
Analyzing market sentiment to gauge trader behavior.
Implementing disciplined risk management and emotional control.
The Forex market’s 24-hour nature, high liquidity, and global integration present both immense opportunities and risks. By combining analytical rigor with strategic discipline, traders can navigate this dynamic market and enhance profitability.
In essence, Forex analysis is an ongoing learning journey. Traders who consistently integrate market data, adopt structured strategies, and maintain disciplined risk management can achieve sustainable success in the ever-evolving foreign exchange landscape.
Tradingideas
Financial Market CoverageIntroduction
Financial markets are the backbone of modern economies, providing platforms where capital is allocated, risks are managed, and liquidity is ensured. They are complex ecosystems that bring together borrowers, lenders, investors, and intermediaries, facilitating the movement of funds across time, geography, and sectors. Covering financial markets effectively is essential for investors, policymakers, analysts, and financial institutions because it enables informed decision-making, risk assessment, and strategic planning.
Financial market coverage refers to the scope, depth, and quality of information, analysis, and reporting on various aspects of financial markets. It encompasses price movements, trading volumes, market trends, regulatory developments, macroeconomic indicators, and company-specific news. A robust financial market coverage system integrates real-time data, expert insights, historical trends, and predictive analytics to guide stakeholders in navigating financial ecosystems efficiently.
This discussion explores financial market coverage in detail, including its types, methods, participants, technological frameworks, challenges, and global implications.
1. Importance of Financial Market Coverage
Financial market coverage is critical because markets are highly dynamic, influenced by an array of global and local factors. Timely, accurate, and comprehensive coverage helps participants make decisions that affect capital allocation, portfolio performance, and risk management. Some key reasons for its importance include:
a) Decision-Making Support
Investors, fund managers, and corporate treasurers rely on detailed market coverage to make strategic decisions. For example, knowledge about equity price trends, interest rate movements, and currency fluctuations enables traders to optimize portfolios and hedge risks effectively.
b) Transparency and Market Efficiency
Comprehensive coverage promotes transparency by providing access to information that reduces information asymmetry. When market participants have access to the same data, markets function more efficiently, minimizing opportunities for unfair advantages and speculative anomalies.
c) Regulatory Compliance
Financial institutions operate under strict regulatory frameworks that require monitoring market developments, reporting trades, and managing systemic risk. Coverage ensures compliance with local and international regulations, such as those imposed by the Securities and Exchange Commission (SEC), the Financial Conduct Authority (FCA), and the Reserve Bank of India (RBI).
d) Risk Management
Understanding market dynamics allows participants to identify potential risks, including credit, market, operational, and liquidity risks. Financial market coverage equips institutions with analytical tools to predict volatility, assess asset correlations, and implement hedging strategies.
2. Types of Financial Market Coverage
Financial market coverage can be categorized based on the types of markets, instruments, and analysis it encompasses. Broadly, it includes:
a) Equity Market Coverage
Equity markets, or stock markets, represent ownership in publicly traded companies. Coverage in this domain includes:
Stock Prices: Real-time tracking of share prices, indices, and performance metrics.
Corporate Announcements: Earnings releases, dividends, mergers and acquisitions, share buybacks.
Market Trends: Sector performance, market capitalization trends, and liquidity analysis.
Technical Analysis: Charts, moving averages, support/resistance levels, and trading signals.
Equity market coverage is critical for traders, portfolio managers, and retail investors seeking growth opportunities or risk-adjusted returns.
b) Fixed Income Market Coverage
The fixed income market deals with debt instruments like government bonds, corporate bonds, and treasury bills. Coverage focuses on:
Interest Rate Movements: Central bank policies, yield curves, and macroeconomic indicators.
Credit Ratings: Bond rating changes, defaults, and market perception.
Liquidity Metrics: Trading volumes, bid-ask spreads, and market depth.
Fixed income coverage is vital for risk-averse investors, pension funds, insurance companies, and sovereign wealth funds.
c) Derivatives and Commodities Coverage
Derivatives markets, including futures, options, and swaps, allow hedging and speculation. Commodities markets cover energy, metals, and agricultural products. Coverage involves:
Price Movements: Spot, forward, and futures prices.
Volatility Indices: Implied volatility and Greeks for options.
Supply-Demand Dynamics: Inventory levels, production forecasts, geopolitical events.
Traders, hedgers, and commodity producers depend heavily on real-time, predictive coverage for risk management and trading strategies.
d) Foreign Exchange (Forex) Market Coverage
Forex markets facilitate currency conversion for trade, investment, and speculation. Coverage includes:
Exchange Rates: Spot, forward, and cross-currency rates.
Economic Indicators: Inflation, GDP growth, trade balances, interest rate differentials.
Geopolitical Events: Elections, trade wars, and central bank interventions.
Forex market coverage is critical for multinational corporations, banks, import-export businesses, and currency traders.
e) Alternative Investments Coverage
Alternative investments include private equity, venture capital, hedge funds, and real estate. Coverage focuses on:
Fund Performance: Returns, risk-adjusted metrics, and liquidity.
Market Trends: IPOs, M&A activity, and private fundraising.
Regulatory Developments: Taxation, compliance, and disclosure requirements.
Investors with high-risk tolerance or those seeking diversification beyond traditional assets rely on alternative investment coverage.
3. Channels of Financial Market Coverage
Financial market coverage is delivered through multiple channels that combine data dissemination, expert analysis, and technology:
a) Financial News Media
Traditional news outlets and specialized financial channels provide real-time news and insights. Examples include Bloomberg, CNBC, Reuters, and The Economic Times. Coverage here is typically broad, summarizing macroeconomic developments, market sentiment, and corporate news.
b) Analytical Platforms
Platforms like FactSet, Morningstar, and TradingView provide in-depth analytics, including historical data, performance ratios, and technical indicators. They allow investors to customize dashboards, run scenario analyses, and generate predictive models.
c) Brokerage and Trading Platforms
Brokerages provide market coverage integrated with trading functionalities. Real-time market data, order book depth, and price alerts allow traders to respond immediately to market movements. Many platforms also include AI-driven insights and automated trading strategies.
d) Social Media and Alternative Data Sources
Social media channels like Twitter, LinkedIn, and specialized investor communities provide sentiment analysis and early warnings about market developments. Alternative data sources include satellite imagery, web traffic data, credit card spending patterns, and ESG ratings. These data points provide unconventional insights into market trends.
e) Regulatory and Exchange Publications
Stock exchanges, central banks, and regulatory authorities provide official releases, circulars, and statistical reports. These documents are critical for compliance and understanding systemic risk. For example, the Reserve Bank of India publishes weekly forex reserves, monetary policy updates, and financial stability reports.
4. Technological Frameworks in Market Coverage
The efficiency of financial market coverage has improved drastically due to advancements in technology. Key components include:
a) Real-Time Data Processing
High-frequency trading and algorithmic strategies rely on instantaneous market data. Technologies like streaming APIs, cloud computing, and data lakes allow real-time aggregation, processing, and dissemination of market information.
b) Artificial Intelligence and Machine Learning
AI and ML algorithms analyze historical data, predict trends, and detect anomalies. Predictive models help portfolio managers forecast price movements, volatility, and macroeconomic shocks. Sentiment analysis from news and social media feeds also informs market forecasts.
c) Blockchain and Distributed Ledger Technology
Blockchain enhances transparency and reduces settlement risk in financial markets. Coverage of blockchain-based assets, cryptocurrencies, and tokenized securities requires specialized analytical tools capable of monitoring decentralized networks and smart contracts.
d) Data Visualization and Analytics
Advanced visualization tools transform raw data into actionable insights. Interactive charts, heat maps, and dashboards enable investors to grasp complex market patterns quickly. These tools are increasingly integrated into trading platforms and investment research applications.
5. Participants in Financial Market Coverage
Effective coverage involves a wide array of participants, each contributing to data collection, analysis, and dissemination:
a) Market Analysts and Research Firms
Analysts produce reports on market conditions, company performance, and economic indicators. Investment banks, consultancy firms, and independent research houses provide detailed insights for institutional and retail clients.
b) Financial Journalists
Journalists track news, interview industry experts, and report market-moving events. Their role is critical in shaping investor perception and ensuring timely dissemination of relevant information.
c) Data Providers and Aggregators
Companies like Bloomberg, Refinitiv, and S&P Global aggregate and verify massive amounts of financial data. Their coverage ensures accuracy, timeliness, and accessibility.
d) Regulators and Exchanges
Exchanges provide trading data, while regulators ensure that disclosures and reporting adhere to compliance standards. This dual role maintains market integrity and reduces systemic risk.
e) Retail and Institutional Investors
Investors themselves contribute to coverage by providing market sentiment through trading activities, surveys, and feedback. Platforms increasingly incorporate user behavior into predictive analytics.
6. Challenges in Financial Market Coverage
Despite technological advancements, financial market coverage faces several challenges:
a) Information Overload
The sheer volume of data generated daily can overwhelm analysts and investors. Distinguishing between signal and noise is critical for effective decision-making.
b) Data Accuracy and Reliability
Inaccurate or delayed data can lead to poor investment decisions. Ensuring data integrity through verification and cross-checking is essential.
c) Market Volatility
Sudden macroeconomic shocks, geopolitical events, or corporate scandals can render predictive models ineffective. Coverage must adapt rapidly to changing conditions.
d) Regulatory Complexities
Global markets operate under diverse regulations. Coverage must consider cross-border compliance, taxation policies, and disclosure requirements to avoid misinterpretation.
e) Cybersecurity and Data Privacy
As market coverage relies heavily on digital platforms, protecting sensitive financial data from cyber threats is paramount.
7. Global Perspectives and Integration
Financial markets are increasingly interconnected, requiring integrated coverage across geographies. Global investors monitor multiple exchanges, currencies, and commodities simultaneously. For example:
Cross-Market Correlations: Movements in the U.S. stock market can influence emerging markets, necessitating synchronized coverage.
Currency and Commodity Linkages: Oil price fluctuations can impact forex rates and equities, highlighting the need for integrated coverage systems.
Global Macroeconomic Events: Trade agreements, sanctions, and geopolitical crises require real-time, multi-market analysis.
Integrated coverage allows institutions to optimize asset allocation, hedge risks, and exploit arbitrage opportunities globally.
8. Future Trends in Financial Market Coverage
Financial market coverage is evolving rapidly due to technological, regulatory, and market-driven factors:
a) AI-Driven Predictive Analytics
AI will increasingly predict market trends, risk exposures, and sentiment-driven price movements with high accuracy.
b) Integration of ESG Data
Environmental, Social, and Governance (ESG) factors are becoming central to investment decisions. Coverage will include sustainability metrics and ESG ratings.
c) Expansion of Alternative Data
Non-traditional data sources such as social media sentiment, satellite imagery, and IoT device metrics will enhance market intelligence.
d) Personalized Coverage
AI-driven personalization will allow investors to receive coverage tailored to their portfolio preferences, risk appetite, and investment horizon.
e) Blockchain Transparency
Blockchain integration will provide immutable, real-time transaction data, enhancing trust and reducing settlement risk.
Conclusion
Financial market coverage is a cornerstone of modern finance. It encompasses the collection, analysis, and dissemination of data across multiple asset classes, markets, and geographies. Effective coverage supports decision-making, ensures transparency, facilitates risk management, and enables compliance with regulatory standards. With technological innovations like AI, blockchain, and big data analytics, market coverage is becoming faster, more accurate, and more comprehensive than ever before.
As financial markets continue to grow in complexity and global interconnection, the need for precise, timely, and insightful market coverage will only increase. Investors, institutions, and policymakers who harness high-quality coverage gain a critical edge in navigating the uncertainties of financial markets while optimizing opportunities for growth, diversification, and risk mitigation.
How Sustainable is Finance?1. The Current Financial System and Sustainability
The traditional financial system has largely been designed around profit maximization and short-term returns. Banks, investment funds, insurance companies, and capital markets operate primarily on the principles of risk and reward. While these principles have driven remarkable economic growth over the past century, they often overlook long-term environmental and social costs. Examples include:
High carbon investments: Fossil fuel companies continue to receive substantial financing despite their contribution to climate change.
Resource-intensive industries: Mining, agriculture, and industrial manufacturing often rely on practices that degrade ecosystems and deplete natural resources.
Short-termism: Many investors prioritize quarterly earnings or immediate stock performance over long-term value creation and sustainability.
This short-term focus creates systemic risks. For instance, climate-related disasters, resource shortages, and social unrest can destabilize markets, affect asset values, and create financial crises. Sustainable finance seeks to internalize these externalities into the investment and lending decision-making process.
2. Environmental, Social, and Governance (ESG) Integration
ESG integration is central to sustainable finance. ESG refers to three key criteria that guide responsible investment decisions:
Environmental (E): Companies are assessed on their impact on the environment, including carbon emissions, energy consumption, water use, and waste management. Financial institutions increasingly track these metrics to identify climate-related risks and opportunities.
Social (S): Social factors include labor rights, human capital development, diversity, community engagement, and supply chain management. Companies that neglect social responsibility face reputational damage, legal challenges, and declining customer loyalty.
Governance (G): Governance encompasses transparency, ethical leadership, board diversity, shareholder rights, and anti-corruption measures. Strong governance reduces operational risks and fosters sustainable corporate performance.
The rise of ESG-focused funds, green bonds, and impact investing demonstrates the growing recognition that sustainability is not merely a moral obligation but a financial imperative. For instance, firms with high ESG ratings often experience lower cost of capital, reduced volatility, and better long-term financial performance.
3. Green Finance and Sustainable Investment Vehicles
Green finance has emerged as a powerful mechanism to drive sustainability. It channels funds toward projects that have positive environmental or social outcomes. Key instruments include:
Green bonds: Debt instruments issued to fund projects with environmental benefits, such as renewable energy, waste management, or climate-resilient infrastructure.
Sustainability-linked loans: Loans with interest rates tied to the borrower’s achievement of sustainability targets.
Impact investing: Investments explicitly intended to generate measurable social or environmental benefits alongside financial returns.
Carbon trading and offsets: Financial mechanisms that allow companies to offset emissions by funding projects that reduce carbon elsewhere.
The adoption of these tools indicates a shift in market norms. Global green bond issuance, for example, grew exponentially from under $11 billion in 2013 to over $600 billion by 2022. This reflects both regulatory pressure and investor demand for climate-aligned investments.
4. Regulatory and Policy Drivers of Sustainable Finance
Governments and international bodies play a crucial role in ensuring financial sustainability. Policies and regulations are increasingly designed to align financial flows with sustainable development objectives. Key initiatives include:
European Union Sustainable Finance Disclosure Regulation (SFDR): Requires asset managers to disclose ESG risks and impacts in investment products.
Task Force on Climate-related Financial Disclosures (TCFD): Encourages companies and investors to report climate-related financial risks and strategies.
Central bank policies: Some central banks integrate climate risk into stress tests and lending criteria to safeguard financial stability.
Such measures help internalize environmental and social risks into the financial system. They also reduce greenwashing—the practice of misrepresenting the sustainability of financial products—and ensure that capital allocation aligns with long-term societal goals.
5. Challenges to Sustainability in Finance
Despite progress, several challenges hinder the full integration of sustainability in finance:
Measurement and reporting gaps: ESG data can be inconsistent, opaque, or difficult to compare across companies and regions.
Short-term incentives: Many financial institutions still operate under performance metrics that reward immediate returns rather than long-term resilience.
Market fragmentation: Lack of standardization in ESG ratings, green bonds, and impact metrics creates confusion for investors.
Trade-offs: Some projects may offer environmental benefits but create social or governance risks, requiring careful balancing.
Greenwashing: Companies and funds may exaggerate sustainability claims to attract capital, undermining credibility.
Addressing these challenges requires stronger regulation, improved data standards, education, and cultural shifts within financial institutions.
6. Financial Technology (FinTech) and Sustainability
FinTech is reshaping the sustainability landscape. Digital platforms, AI, blockchain, and big data allow for better risk assessment, monitoring, and reporting of ESG metrics. Examples include:
Blockchain for transparency: Tracking carbon credits or sustainable supply chains to prevent fraud.
AI-powered ESG analysis: Algorithms that analyze sustainability reports, news, and social media to provide real-time ESG scores.
Crowdfunding for sustainable projects: Enabling small investors to fund renewable energy, circular economy, and social impact initiatives.
FinTech innovations democratize access to sustainable finance and accelerate the adoption of ESG principles across the global financial system.
7. The Role of Investors and Society
Sustainability in finance is not only a matter of regulation or technology—it also depends on investor behavior. Institutional and retail investors increasingly demand responsible investing options. Key trends include:
Millennial and Gen Z investors: Younger generations prioritize sustainability and ethical investment, influencing asset allocation decisions.
Active stewardship: Investors engage with companies to improve ESG performance, voting on shareholder resolutions and participating in governance.
Divestment movements: Divesting from fossil fuels or unethical industries sends market signals that influence corporate behavior.
Ultimately, the collective actions of investors can incentivize companies to adopt sustainable practices, thereby enhancing financial system resilience.
8. The Interconnection Between Financial Stability and Sustainability
Sustainable finance is intertwined with broader economic stability. Climate change, social inequality, and environmental degradation are not just ethical issues—they are financial risks. Extreme weather events, resource scarcity, and social unrest can trigger market volatility, supply chain disruptions, and capital flight. By integrating sustainability, finance can:
Mitigate systemic risks: Reducing exposure to climate and social shocks.
Enhance resilience: Companies with strong ESG practices tend to recover faster from crises.
Promote long-term value creation: Sustainable investments align economic growth with environmental and social goals.
This perspective reframes sustainability from a “cost” to a strategic advantage, emphasizing its role in ensuring a stable and robust financial system.
9. Case Studies and Global Examples
Norway’s Sovereign Wealth Fund: Actively divests from companies with poor ESG practices, illustrating responsible national-level investment.
UN Principles for Responsible Investment (PRI): Over 4,000 signatories manage over $120 trillion in assets, committing to integrate ESG into investment decisions.
China’s Green Finance Initiative: Rapid growth in green bonds and sustainable lending to support carbon neutrality targets by 2060.
These examples highlight how policy, investor behavior, and institutional strategies can collectively drive financial sustainability.
10. Conclusion
Finance today stands at a critical juncture. Traditional profit-centric models are increasingly inadequate in addressing global environmental and social challenges. Sustainable finance is not merely a trend—it is an essential evolution to align economic growth with planetary and societal limits. While challenges remain—such as standardization, reporting, and greenwashing—the rise of ESG integration, green bonds, impact investing, and regulatory frameworks demonstrates that the financial system can become more sustainable.
Sustainability in finance ultimately depends on collaboration among policymakers, investors, financial institutions, and society at large. By internalizing environmental and social risks, promoting long-term thinking, and leveraging technological innovation, finance can evolve into a system that not only generates wealth but also safeguards the world for future generations. In essence, sustainable finance is no longer optional—it is a prerequisite for the resilience, stability, and ethical legitimacy of the global financial system.

Foreign Institutional Investors and Their Impact on Investment1. Overview of FIIs
FIIs have gained prominence in the last few decades due to globalization, liberalization of capital markets, and the increasing integration of global financial markets. They are different from Foreign Direct Investment (FDI) because FIIs primarily invest in portfolio instruments such as stocks, bonds, and derivatives, rather than acquiring a controlling stake in companies.
FIIs invest in countries seeking higher returns and portfolio diversification. Emerging economies often attract FIIs because of their high growth potential and relatively higher interest rates compared to developed markets. India, since the 1990s, has witnessed a substantial inflow of FII capital following economic liberalization policies.
2. Channels of FII Investment
FIIs invest through multiple channels:
Equity markets: Purchasing stocks of listed companies.
Debt markets: Buying government bonds, corporate bonds, and other fixed-income instruments.
Derivatives markets: Engaging in futures, options, and swaps to hedge or speculate.
Real estate and infrastructure funds: Though less common, some FIIs participate in structured investment vehicles.
In India, FIIs require registration with the Securities and Exchange Board of India (SEBI) and operate under specific investment caps to ensure market stability.
3. Positive Impacts of FIIs on Investment
3.1. Capital Formation
FIIs bring a significant amount of capital into domestic markets. Their investments contribute to liquidity, improve market depth, and facilitate capital formation. This influx of funds allows companies to access more resources for expansion, research and development, and operational efficiency.
For example, in the Indian equity market, periods of high FII inflows often coincide with rising stock market indices, signaling strong investor confidence and abundant capital availability.
3.2. Market Efficiency and Liquidity
FIIs bring in sophisticated investment strategies and advanced risk management practices. Their presence enhances market efficiency by improving price discovery—the process by which asset prices reflect all available information.
Additionally, FIIs increase market liquidity. High liquidity reduces transaction costs, narrows bid-ask spreads, and allows both domestic and international investors to trade large volumes without significantly impacting market prices. This is particularly beneficial for emerging markets where domestic investor participation may be limited.
3.3. Encouragement of Best Practices
FIIs often demand transparency, corporate governance, and accountability. Their investment criteria encourage domestic firms to adopt international best practices in financial reporting, risk management, and corporate governance.
For instance, companies seeking to attract FII investments may improve their disclosure norms, adhere to strict accounting standards, and implement robust board oversight. This has long-term positive effects on the investment climate.
3.4. Diversification for Domestic Markets
FIIs bring global perspectives to domestic markets. Their investment strategies, based on diversified global portfolios, encourage the domestic financial system to mature. This international participation mitigates market segmentation and reduces reliance on local investors alone.
3.5. Encouragement of Derivatives and Sophisticated Financial Products
FIIs often engage in complex investment products such as derivatives, structured products, and debt instruments. Their participation accelerates the development of sophisticated financial markets. India’s derivatives market, including index futures, options, and currency derivatives, has grown largely due to active FII participation.
4. Potential Negative Impacts of FIIs on Investment
Despite their benefits, FIIs can also have destabilizing effects on domestic markets.
4.1. Market Volatility
FIIs are often driven by global economic conditions, interest rate differentials, and risk appetite rather than local fundamentals. Rapid inflows during bullish phases can inflate asset prices, leading to bubbles. Conversely, sudden outflows during global crises or geopolitical tensions can trigger sharp market corrections.
For example, during the global financial crisis of 2008, many emerging markets, including India, faced abrupt FII withdrawals, causing stock market crashes and currency depreciation.
4.2. Exchange Rate Fluctuations
FII inflows increase demand for domestic currency, often causing appreciation, while sudden outflows lead to depreciation. Such volatility can impact exporters and importers, create inflationary pressures, and destabilize macroeconomic management.
4.3. Short-term Investment Focus
FIIs may prioritize short-term gains over long-term investments. This can lead to speculative trading, herd behavior, and excessive market fluctuations. Domestic investors may face challenges as FII actions amplify market swings, making long-term planning difficult.
4.4. Systemic Risk
High dependence on FIIs can make a country vulnerable to external shocks. Since FII decisions are influenced by global financial markets, policy changes in the US, Europe, or China can have an outsized impact on local markets. Emerging economies must maintain robust regulatory frameworks to mitigate such risks.
5. Regulatory Framework and Controls
Governments and regulators recognize both the advantages and risks of FII participation. India, for instance, has a robust regulatory framework managed by SEBI and the Reserve Bank of India (RBI).
Key regulatory measures include:
Registration requirements: FIIs must be registered with SEBI before investing.
Investment limits: Caps are imposed on FII investment in individual companies and sectors to prevent market dominance.
Disclosure norms: FIIs are required to disclose holdings and trading activity periodically.
Derivative restrictions: Limits are imposed on derivative trading to control speculative behavior.
Such measures aim to encourage long-term investment, stabilize markets, and maintain financial integrity.
6. Case Studies: FIIs in India
6.1. 1990s Liberalization
After India liberalized its economy in 1991, FIIs were allowed to invest in the stock markets. The inflow of foreign capital helped stabilize the Indian economy, provided liquidity to the equity market, and facilitated industrial expansion.
6.2. 2007–2008 Bull Run and Global Crisis
Between 2005 and 2007, India witnessed massive FII inflows, leading to a stock market boom. However, the 2008 global financial crisis triggered rapid FII withdrawals, causing a sharp market crash. This highlighted both the opportunities and risks associated with foreign institutional participation.
6.3. Post-2014 Reforms
After 2014, policy reforms, including the introduction of the Goods and Services Tax (GST), ease of doing business improvements, and liberalized FDI policies, attracted renewed FII interest. This stabilized markets, increased capital availability, and improved investor confidence.
7. Impact on Different Asset Classes
7.1. Equity Markets
FII inflows often drive stock prices in emerging markets. A surge in FII investment can boost market indices, while massive outflows can depress stock prices.
7.2. Bond Markets
FII participation in government and corporate bonds influences yields. Heavy FII purchases reduce yields, while sudden sales increase yields and borrowing costs for the government and corporations.
7.3. Derivatives and Commodities
FIIs engage in hedging and speculative strategies, impacting derivatives prices and volumes. Their presence enhances market depth but also introduces potential volatility in highly leveraged instruments.
8. Macroeconomic Implications
8.1. GDP Growth
FII inflows indirectly boost economic growth by increasing capital availability, encouraging investment, and promoting financial sector development.
8.2. Inflation and Interest Rates
Sudden inflows can appreciate the local currency, reduce import costs, and moderate inflation. Conversely, outflows may depreciate the currency, raising import costs and inflationary pressure.
8.3. Policy Challenges
Central banks must carefully manage liquidity and exchange rates to balance FII influence with domestic economic stability. This requires interventions in forex markets and prudent monetary policy.
9. Strategies to Optimize FII Impact
Governments and regulators can enhance the positive impact of FIIs while mitigating risks:
Encourage long-term investment through differentiated tax policies.
Monitor and manage liquidity to reduce sudden shocks.
Maintain transparency and improve market infrastructure to attract stable, quality investments.
Promote domestic institutional investors to reduce overdependence on FIIs.
10. Conclusion
FIIs play a pivotal role in shaping domestic financial markets. Their inflows bring liquidity, promote efficient markets, encourage global best practices, and contribute to economic growth. However, their short-term focus and susceptibility to global shocks can lead to volatility and systemic risk.
A balanced approach, combining regulatory oversight, robust domestic institutions, and market infrastructure, is crucial to ensure that FII participation benefits domestic markets sustainably. Emerging economies like India continue to benefit from FIIs, but maintaining equilibrium between foreign investment and domestic market stability remains a continuous challenge.
Exchange Rate Dynamics and Fluctuations1. Introduction to Exchange Rates
An exchange rate is the price of one nation’s currency expressed in terms of another currency. For instance, if the USD/INR exchange rate is 83, it implies that 1 US dollar can be exchanged for 83 Indian rupees. Exchange rates facilitate international trade by providing a mechanism for converting the domestic currency into foreign currency and vice versa.
1.1 Importance of Exchange Rates
Exchange rates affect nearly every economic transaction across borders. Their significance can be highlighted in three main areas:
Trade Competitiveness: A country’s exports become cheaper or more expensive depending on the strength of its currency, impacting trade balances.
Investment Decisions: Foreign investors analyze exchange rate trends before investing in assets, as currency fluctuations can impact returns.
Macroeconomic Stability: Exchange rates influence inflation, interest rates, and overall economic growth. Sudden volatility can destabilize economies.
2. Types of Exchange Rates
Exchange rates can be categorized into fixed, floating, and managed (or hybrid) systems, each with distinct dynamics and implications.
2.1 Fixed Exchange Rate
A fixed exchange rate is pegged to another major currency (like the USD) or a basket of currencies. Governments or central banks maintain this rate by buying or selling their own currency in foreign exchange markets.
Advantages: Stability in trade and investment, reduced currency risk.
Disadvantages: Requires large foreign reserves, less flexibility to respond to economic shocks.
2.2 Floating Exchange Rate
In a floating system, market forces of supply and demand determine the currency’s value. Most major currencies, including USD, EUR, and JPY, operate under this system.
Advantages: Automatic adjustment to economic shocks, independent monetary policy.
Disadvantages: Higher volatility, uncertainty for businesses and investors.
2.3 Managed or Hybrid System
A managed float, or a “dirty float,” combines elements of both fixed and floating systems. Central banks intervene occasionally to stabilize the currency but allow it to fluctuate within a target range.
Example: The Indian Rupee follows a managed float system.
3. Determinants of Exchange Rate Dynamics
Exchange rate movements are influenced by multiple factors. These can be broadly categorized into economic fundamentals, market sentiments, and external shocks.
3.1 Economic Fundamentals
Interest Rate Differentials:
Higher domestic interest rates attract foreign capital, increasing demand for the local currency and appreciating it. Conversely, lower rates may weaken a currency.
Inflation Rates:
Countries with lower inflation tend to see their currency appreciate because purchasing power is maintained relative to higher-inflation economies.
Balance of Payments:
A surplus in trade (exports > imports) strengthens a currency as foreign buyers demand the domestic currency. A deficit has the opposite effect.
Economic Growth and Productivity:
Stronger economic performance attracts foreign investment, increasing demand for the local currency.
3.2 Market Sentiments and Speculation
Financial markets play a significant role in short-term currency fluctuations. Speculators anticipate central bank actions, political events, or economic data releases, buying or selling currencies accordingly. This can create rapid and sometimes unpredictable movements.
3.3 Political Stability and Geopolitical Risks
Political uncertainty, elections, policy changes, or conflicts can drastically affect investor confidence and currency value. Countries perceived as stable are likely to see currency appreciation, while instability leads to depreciation.
3.4 External Shocks
Commodity Prices:
For commodity-exporting countries, currency values often move with commodity prices. For example, oil-exporting nations’ currencies strengthen when oil prices rise.
Global Financial Crises:
During crises, investors flock to “safe-haven” currencies like the USD, EUR, or JPY, causing other currencies to depreciate.
Natural Disasters:
Severe events can disrupt trade, reduce investor confidence, and lead to depreciation of the affected country’s currency.
4. Exchange Rate Fluctuation Mechanisms
The dynamics of exchange rate fluctuations can be understood through short-term market mechanisms and long-term economic adjustments.
4.1 Short-Term Fluctuations
Short-term movements are often driven by:
Speculative Trading: High-frequency traders and hedge funds can cause rapid swings in currency values.
News Announcements: Data on inflation, unemployment, GDP growth, or political events trigger immediate market responses.
Liquidity Factors: Large inflows or outflows in capital markets can temporarily shift exchange rates.
4.2 Long-Term Adjustments
Over the long term, currencies tend to align with economic fundamentals through mechanisms such as:
Purchasing Power Parity (PPP):
This theory states that exchange rates adjust so that identical goods cost the same across countries. Inflation differentials play a key role.
Interest Rate Parity (IRP):
This theory links spot and forward exchange rates, ensuring no arbitrage opportunity exists due to interest rate differences.
Balance of Payments Adjustments:
Persistent trade deficits or surpluses gradually impact currency supply and demand, leading to long-term appreciation or depreciation.
5. Types of Exchange Rate Fluctuations
Fluctuations can be categorized by their magnitude and frequency:
Volatility:
Measured as the standard deviation of exchange rate changes over time. High volatility signals higher risk for trade and investment.
Trend Movements:
Long-term appreciation or depreciation driven by fundamental factors like economic growth or inflation differentials.
Cyclical Movements:
Associated with global business cycles, often synchronized with commodity prices, interest rates, or capital flows.
Random or Speculative Movements:
Short-term noise caused by investor psychology, rumors, or sudden policy interventions.
6. Exchange Rate Models
Several models help explain and predict currency dynamics:
6.1 Monetary Model
Focuses on money supply, inflation, and interest rates. It assumes that exchange rates adjust to equilibrate relative money demand and supply across countries.
6.2 Portfolio Balance Model
Emphasizes asset allocation. Investors balance portfolios between domestic and foreign assets. Changes in preferences for assets can cause currency fluctuations.
6.3 Behavioral Equilibrium Exchange Rate (BEER)
Incorporates fundamentals like productivity, terms of trade, and net foreign assets to determine equilibrium exchange rates.
6.4 Dornbusch’s Overshooting Model
Explains why exchange rates can overreact to monetary policy changes in the short term and then gradually adjust to a long-term equilibrium.
7. Implications of Exchange Rate Fluctuations
Currency fluctuations have wide-ranging implications for economies, businesses, and financial markets:
7.1 For Trade
Exports: Appreciation makes exports costlier and less competitive abroad.
Imports: Depreciation increases the cost of imported goods, contributing to inflation.
7.2 For Investment
Foreign Investment: Currency depreciation reduces returns for foreign investors, possibly leading to capital outflows.
Domestic Firms: Multinational firms face risks in repatriating profits due to fluctuating exchange rates.
7.3 For Inflation and Monetary Policy
Central banks monitor currency fluctuations as they impact inflation. A weak currency can increase import costs, leading to higher inflation and influencing interest rate decisions.
7.4 For Economic Growth
Persistent volatility can discourage international trade and investment, slowing economic growth. Stable exchange rates, on the other hand, promote confidence and long-term planning.
8. Managing Exchange Rate Risk
Businesses and investors adopt strategies to hedge against currency risk:
Forward Contracts: Lock in exchange rates for future transactions.
Currency Options: Provide the right, but not the obligation, to exchange currencies at a specified rate.
Natural Hedging: Aligning revenues and expenses in the same currency to reduce exposure.
Diversification: Spreading investments across multiple currencies.
9. Case Studies of Exchange Rate Fluctuations
9.1 Indian Rupee (INR) Volatility
The INR has experienced fluctuations due to oil price shocks, foreign capital inflows/outflows, and monetary policy changes. A combination of managed float and reserve interventions helps stabilize it.
9.2 Euro (EUR) Challenges
The Eurozone’s diverse economies create tensions. Currency strength is affected by German economic performance, Greek debt crises, and ECB policy.
9.3 USD as a Safe Haven
During global crises like 2008 and 2020, USD demand surged, appreciating the currency against most others due to its safe-haven status.
10. Conclusion
Exchange rates are a dynamic and complex aspect of the global economy. Their fluctuations arise from a mixture of economic fundamentals, market sentiments, political developments, and external shocks. Understanding these dynamics is crucial for governments to manage monetary and fiscal policies, for businesses to mitigate currency risk, and for investors to protect returns.
While short-term volatility may appear unpredictable, long-term movements often reflect economic realities. Countries with stable political environments, sound monetary policies, and strong fundamentals are better equipped to manage exchange rate fluctuations. In the increasingly interconnected global economy, exchange rate dynamics are not just a financial indicator—they are a reflection of a country’s economic health and global integration.
Rare Sell Opportunity on Bitcoin , target 114KBitcoin is currently approaching the 124,000 – 124,500 zone, which represents its all-time high and the strongest resistance level the market has ever seen.
From a technical perspective, this zone provides a golden and rare opportunity to enter a short trade, based on the following:
Price reaching an unprecedented all-time high.
Clear overbought signals on momentum indicators (RSI – MACD).
High probability of a significant profit-taking move from these levels.
🎯 Trading Plan:
Short entry: 124,000 – 124,500
Main target: 114,000
Stop-loss: Above 125,000
⚠️ This is not financial advice, but rather a personal technical analysis based on current market conditions.

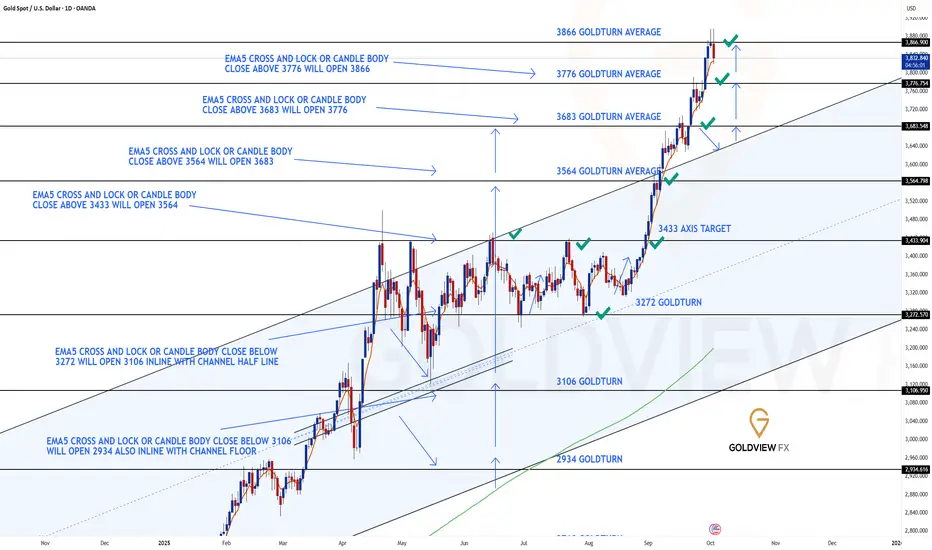
DAILY CHART UPDATEHey Everyone,
Another great day on the charts with all our chart ideas now complete. Please see update on our Daily chart idea, which is now respecting the final target.
✅ 3776 & 3866 Targets Achieved!
Our chart ideas played out perfectly — 3683 → 3776 → 3866 final daily target completed.
Now the focus is on what’s next:
Breakout Scenario: A clear close above 3866 = continuation higher.
Rejection Scenario: Failure to close above = rejection, which we’re already starting to see now. Resistance is holding, and we may get the first leg of a correction.
Let’s see if momentum picks up enough to test the lower Goldturns for support and bounce.
Key Levels
📉 Support: 3776 / 3683
📈 Resistance: Above 3866 (on confirmed breakout)
Stay tuned for the next update as this plays out.
Mr Gold
GoldViewFX
Global Financial Markets and Their Structure1. Overview of Global Financial Markets
Financial markets can be broadly defined as platforms where financial instruments are traded between buyers and sellers. They can be categorized based on:
Type of instruments traded – equities, bonds, currencies, derivatives, commodities, and digital assets.
Maturity of instruments – money markets (short-term) and capital markets (long-term).
Trading mechanism – exchange-traded markets and over-the-counter (OTC) markets.
Geographical scope – domestic markets and international markets.
Globally, financial markets operate continuously, interconnected through electronic trading platforms and international financial institutions. The growth of globalization, financial liberalization, and technological innovation has significantly expanded the depth, liquidity, and efficiency of these markets.
2. Types of Global Financial Markets
2.1 Capital Markets
Capital markets are platforms for long-term funding where securities with maturities of more than one year are traded. They include:
Equity Markets: Where shares of publicly listed companies are issued and traded. Examples include the New York Stock Exchange (NYSE), London Stock Exchange (LSE), and Tokyo Stock Exchange (TSE). Equity markets facilitate capital raising for companies and provide investors an opportunity to participate in corporate growth.
Debt Markets (Bond Markets): Where government, corporate, and municipal bonds are issued and traded. Bond markets are crucial for governments to finance infrastructure projects and for corporations to raise long-term funds. Major debt markets include the U.S. Treasury market, Eurobond market, and corporate bond markets in Europe and Asia.
2.2 Money Markets
Money markets deal in short-term debt instruments, usually with maturities of less than one year. They provide liquidity and fund management solutions for governments, financial institutions, and corporations. Instruments include:
Treasury bills
Commercial paper
Certificates of deposit
Repurchase agreements
The money market is critical for maintaining liquidity and controlling short-term interest rates in the global economy.
2.3 Foreign Exchange (Forex) Markets
Forex markets are the largest financial markets globally, with an average daily turnover exceeding $7 trillion. They enable the trading of currencies for international trade, investment, speculation, and hedging. Forex markets operate 24 hours due to time zone differences across London, New York, Tokyo, and Sydney.
Major participants include central banks, commercial banks, hedge funds, multinational corporations, and retail traders. The forex market significantly influences global trade balances, monetary policy, and capital flows.
2.4 Derivatives Markets
Derivatives markets facilitate trading of contracts whose value is derived from an underlying asset. Common derivatives include:
Futures
Options
Swaps
Forwards
Derivatives are used for hedging, speculation, and arbitrage. Key markets include the Chicago Mercantile Exchange (CME), Eurex in Europe, and the Dubai Mercantile Exchange. Derivatives markets play a crucial role in risk management but also introduce systemic risks if leveraged excessively.
2.5 Commodity Markets
Commodity markets deal with the trading of raw materials like oil, gold, metals, agricultural products, and energy resources. They are classified as:
Physical Markets: For actual delivery of commodities.
Futures Markets: For trading standardized contracts with future delivery dates.
Major commodity exchanges include the London Metal Exchange (LME), Chicago Board of Trade (CBOT), and Multi Commodity Exchange of India (MCX). Commodity markets are vital for price discovery, risk management, and hedging against inflation.
2.6 Digital and Crypto-Asset Markets
The rise of blockchain technology has given birth to digital asset markets, including cryptocurrencies, stablecoins, and central bank digital currencies (CBDCs). These markets offer decentralized financial solutions, new investment opportunities, and cross-border payment efficiencies. Exchanges like Coinbase, Binance, and Kraken operate globally, while central banks experiment with digital currencies to improve payment systems and monetary policy implementation.
3. Key Participants in Global Financial Markets
3.1 Institutional Investors
Institutional investors include mutual funds, hedge funds, insurance companies, pension funds, and sovereign wealth funds. They are major drivers of capital flows and market liquidity. Their strategies often involve asset allocation, risk management, and long-term investment horizon.
3.2 Retail Investors
Retail investors are individual participants who invest in stocks, bonds, mutual funds, and other securities. They represent a significant portion of market activity, especially in developed economies with well-established broker networks and electronic trading platforms.
3.3 Corporations
Corporations participate as issuers of equity and debt instruments, seeking funding for expansion, research, and capital projects. They also engage in currency hedging, commodity contracts, and derivative trading to manage operational and financial risks.
3.4 Governments and Central Banks
Governments issue sovereign bonds to fund fiscal deficits and infrastructure projects. Central banks control monetary policy, manage interest rates, stabilize currency values, and intervene in foreign exchange markets to influence capital flows and inflation.
3.5 Intermediaries
Banks, brokers, dealers, and market makers facilitate transactions, provide liquidity, and offer advisory services. Investment banks play a critical role in underwriting, mergers and acquisitions, and structuring complex financial instruments.
4. Structure of Global Financial Markets
The structure of global financial markets can be examined through market segmentation, interconnectedness, and regulatory frameworks.
4.1 Primary and Secondary Markets
Primary Market: Where new securities are issued for the first time, such as IPOs and bond issuances. Capital raised in primary markets finances business expansion and government projects.
Secondary Market: Where existing securities are traded between investors. Secondary markets provide liquidity, facilitate price discovery, and help determine the cost of capital.
4.2 Exchange-Traded vs Over-the-Counter Markets
Exchange-Traded Markets: Transactions occur on regulated exchanges with standardized contracts and transparency (e.g., NYSE, CME).
OTC Markets: Trades are bilateral agreements between parties, often customized and less transparent (e.g., forex forwards, swaps).
4.3 Segmentation by Geography and Time Zone
Global financial markets are interconnected across regions:
Asia-Pacific Markets: Tokyo, Shanghai, Hong Kong, Singapore, and Sydney.
European Markets: London, Frankfurt, Paris, and Zurich.
Americas Markets: New York, Toronto, and Chicago.
Time zone differences create continuous trading opportunities, but also pose risks of volatility spillovers and information asymmetry.
4.4 Market Integration
Integration occurs through capital mobility, cross-border investment, and harmonized regulations. Fully integrated markets enable diversification, lower cost of capital, and efficient resource allocation. Partial integration often results in fragmented liquidity and regional discrepancies in pricing.
5. Instruments Traded in Global Financial Markets
5.1 Equity Instruments
Equities provide ownership in companies and the right to dividends. They are traded on stock exchanges or OTC platforms. Variants include:
Common stock
Preferred stock
Depository receipts (e.g., ADRs, GDRs)
5.2 Debt Instruments
Debt instruments provide fixed or floating returns to investors. They include:
Government securities (treasuries, gilts)
Corporate bonds
Municipal bonds
Floating rate notes
5.3 Derivatives Instruments
Derivatives derive value from underlying assets and are used for hedging or speculation. Types include:
Futures contracts
Options contracts
Swaps (interest rate, currency, credit)
Forwards
5.4 Hybrid Instruments
Hybrid instruments combine features of debt and equity, such as convertible bonds, preferred shares, and structured notes. They offer flexibility in risk and return profiles for investors.
5.5 Alternative Instruments
Alternative instruments include commodities, real estate investment trusts (REITs), private equity, venture capital, and digital assets. These instruments enhance portfolio diversification and risk management.
6. Functions of Global Financial Markets
Financial markets perform several critical functions:
Capital Allocation: Efficiently channel funds from savers to borrowers for productive investment.
Price Discovery: Determine fair prices of financial instruments through supply and demand dynamics.
Liquidity Provision: Allow participants to buy or sell assets quickly without significantly impacting prices.
Risk Management: Provide tools like derivatives to hedge against market, credit, and currency risks.
Information Dissemination: Reflect economic, corporate, and geopolitical information in prices.
Economic Growth Support: Facilitate investment in infrastructure, innovation, and industry expansion.
7. Regulation of Global Financial Markets
Regulation ensures stability, transparency, and investor protection. Key regulatory frameworks include:
United States: Securities and Exchange Commission (SEC), Commodity Futures Trading Commission (CFTC), Federal Reserve.
Europe: European Securities and Markets Authority (ESMA), national regulators like FCA (UK), BaFin (Germany).
Asia-Pacific: Securities and Exchange Board of India (SEBI), China Securities Regulatory Commission (CSRC), Monetary Authority of Singapore (MAS).
Regulation covers market conduct, disclosure requirements, capital adequacy, trading limits, anti-money laundering, and risk management. Cross-border coordination is vital due to globalization of financial markets.
8. Trends and Innovations
8.1 Technological Advancements
Algorithmic and High-Frequency Trading (HFT): Use of automated systems to execute trades at microsecond speeds.
Blockchain and Distributed Ledger Technology: Facilitate transparent, secure, and decentralized transactions.
Robo-Advisors: Automated investment advisory platforms improving accessibility for retail investors.
8.2 Globalization and Integration
Capital flows across borders, with emerging markets increasingly participating in global investment. Financial integration allows diversification but increases vulnerability to external shocks.
8.3 Sustainable and ESG Investing
Environmental, Social, and Governance (ESG) factors are increasingly incorporated in investment strategies, impacting capital allocation and corporate behavior.
8.4 Digital Currencies
CBDCs and cryptocurrencies are transforming cross-border payments, monetary policy transmission, and investment opportunities.
9. Challenges in Global Financial Markets
Volatility and Systemic Risk: Interconnectedness can transmit shocks rapidly across borders.
Regulatory Arbitrage: Firms may exploit differences in national regulations.
Cybersecurity Threats: Digitalization exposes markets to hacking and fraud.
Liquidity Mismatches: Especially in emerging markets or during crises.
Currency and Interest Rate Risks: Global flows are affected by exchange rate fluctuations and monetary policy divergence.
10. Importance for Investors, Traders, and Policymakers
10.1 Investors
Understanding market structure helps in portfolio diversification, risk management, and strategic allocation of capital across geographies and asset classes.
10.2 Traders
Market structure knowledge is critical for developing trading strategies, exploiting arbitrage opportunities, and managing intraday and long-term market risks.
10.3 Policymakers
Insights into market behavior, liquidity conditions, and capital flows assist in macroeconomic policy, regulation, and crisis management.
Conclusion
Global financial markets are the lifeblood of the modern economy. Their structure is vast and multi-layered, encompassing diverse instruments, participants, and functions. Efficient, transparent, and integrated markets enhance economic growth, facilitate investment, and support risk management. At the same time, challenges such as systemic risk, regulatory complexity, and technological disruption demand vigilance from all participants.
For investors, traders, and policymakers, understanding the structure and functioning of these markets is essential to navigate global capital flows, identify opportunities, and mitigate risks. As markets evolve with technology, sustainability concerns, and financial innovation, continuous learning and adaptation are key to thriving in this dynamic global financial ecosystem.
News Trading Without Noise1. The Nature of News in Financial Markets
1.1 Types of News
News in financial markets can broadly be classified into several categories:
Economic News: Data releases like GDP, unemployment rates, CPI inflation, interest rate decisions, PMI indices, and trade balances. These shape market sentiment on macroeconomic health.
Corporate News: Earnings reports, M&A announcements, stock buybacks, dividend declarations, leadership changes, and guidance reports. These primarily affect the company’s stock and sector performance.
Geopolitical News: Events such as wars, treaties, sanctions, elections, or natural disasters. These can affect broader asset classes like commodities, currencies, and indices.
Market Sentiment and Analyst News: Rating upgrades/downgrades, analyst opinions, and speculative reports. These often act as catalysts for market movements.
1.2 Noise vs. Signal
In trading, noise refers to irrelevant or misleading information that may temporarily affect price but does not reflect the underlying fundamentals. Signal is the actionable news that has a real potential to move the market in a measurable way.
Example of noise: A rumor on social media about a company’s potential product release without verification.
Example of signal: Official central bank rate decisions, verified earnings announcements, or geopolitical treaties.
News trading without noise focuses solely on extracting signals, avoiding overreaction to rumors, speculative chatter, or minor reports.
2. Why News Trading Matters
News trading matters because financial markets are fundamentally information-driven. Prices adjust rapidly when new information enters the system. This adjustment can be:
Immediate: Within seconds to minutes, as seen in forex and stock futures markets.
Short-term: Over hours or days, especially for earnings announcements or economic data.
Long-term: Over months or years, for structural shifts like policy changes or geopolitical realignments.
By correctly interpreting news, traders can:
Capture rapid price movements.
Position ahead of institutional investors who may take longer to digest data.
Hedge risks or profit from volatility spikes.
3. The Concept of “Without Noise”
3.1 Problem with Traditional News Trading
Traditional news trading often fails due to:
Overreacting to minor news: Traders act on every announcement, causing whipsaw losses.
Misinterpreting data: Focusing on headline numbers rather than context (e.g., focusing only on inflation numbers without considering interest rate expectations).
Chasing rumors: Social media-driven information can be misleading.
High transaction costs: Frequent trading on minor news can eat into profits.
3.2 News Trading Without Noise
This approach emphasizes:
Filtering News: Identifying high-impact, verified information.
Contextual Analysis: Understanding the economic or corporate environment surrounding the news.
Timing: Acting when the market is likely to respond predictably rather than reactively.
Risk Management: Controlling exposure to prevent losses from false signals.
Essentially, it’s a strategic, disciplined, and selective approach to news-driven trading.
4. Identifying Actionable News
Not all news is tradeable. Traders must classify and filter news based on impact, reliability, and market sensitivity.
4.1 High-Impact News
Central bank announcements: Interest rate decisions, QE programs.
Employment and inflation data: CPI, PPI, unemployment rates.
Corporate earnings surprises: Results that deviate significantly from analyst expectations.
Geopolitical events: Wars, peace treaties, sanctions.
4.2 Medium-Impact News
Minor economic indicators: Retail sales, manufacturing indices.
Corporate guidance updates: Forecast revisions by companies.
4.3 Low-Impact News
Social media rumors.
Minor regulatory announcements with limited market scope.
5. Techniques for News Trading Without Noise
5.1 Pre-Event Analysis
Before news releases:
Understand expectations: Compare market consensus vs. historical trends.
Anticipate volatility: Certain news events historically cause larger price swings.
Identify tradable instruments: Decide whether to trade spot markets, futures, or options.
5.2 Post-Event Analysis
After news release:
Confirm authenticity: Use verified sources like government websites, official press releases, or trusted financial news agencies.
Measure market reaction: Analyze initial price reaction for overreaction or underreaction.
Execute with strategy: Enter positions if the news aligns with your model or trading rules.
5.3 Using Economic Calendars
Economic calendars highlight upcoming news events along with expected impact. Trading without noise requires:
Focusing only on high-impact events.
Ignoring low-impact or speculative events.
Preparing in advance for known market-moving data.
5.4 Quantitative and Algorithmic Approaches
Sentiment analysis tools: Filter verified news and detect actionable patterns.
Algorithmic trading: Use models to execute trades instantly on verified news while ignoring irrelevant chatter.
Historical backtesting: Analyze past news events and their impact to refine trading rules.
6. Risk Management in News Trading Without Noise
News trading is inherently volatile. Risk management ensures survival:
Position Sizing: Avoid oversized positions on volatile news events.
Stop-Loss Orders: Pre-set limits to protect against unexpected market reactions.
Diversification: Spread exposure across multiple assets to reduce idiosyncratic risk.
Avoiding Overtrading: Resist the temptation to trade on every news item.
Scenario Analysis: Prepare for best, worst, and base case outcomes for each news release.
7. Common Pitfalls and How to Avoid Them
Chasing Headlines: Avoid impulsive trades based on sensationalized news.
Ignoring Context: Analyze the broader economic and market situation.
Overreacting to Short-Term Volatility: Understand that initial spikes may be corrected quickly.
Neglecting Liquidity: Thinly traded instruments can exaggerate price reactions.
Emotional Trading: Stick to pre-defined strategies rather than reacting to fear or greed.
8. Examples of News Trading Without Noise
8.1 Central Bank Rate Decisions
Scenario: Federal Reserve announces an unexpected 25 basis point hike.
Noise-Free Approach: Ignore speculative market chatter before the release. Trade based on actual decision and expected impact on interest-rate sensitive assets like bonds, USD, and stock indices.
8.2 Corporate Earnings
Scenario: Company reports earnings 20% above analyst expectations.
Noise-Free Approach: Trade after verifying the earnings report. Focus on volume, price momentum, and sector performance rather than pre-earnings rumors.
8.3 Geopolitical Events
Scenario: Sudden sanctions on a major oil-producing country.
Noise-Free Approach: Analyze real impact on oil supply, market sentiment, and correlated sectors. Avoid trading solely on headlines or speculative social media news.
9. Tools and Resources for Noise-Free News Trading
Economic Calendars: Bloomberg, Investing.com, Forex Factory.
News Aggregators: Reuters, Dow Jones, MarketWatch.
Financial Terminals: Bloomberg Terminal, Refinitiv Eikon for real-time verified news.
Social Media Filters: Use verified accounts and cross-check with official sources.
Algorithmic Tools: Python-based APIs, sentiment analysis engines, and AI-based trading models.
10. Integrating Technical Analysis
Even in news trading, technical analysis helps:
Identify key support/resistance levels to enter or exit positions.
Spot overbought or oversold conditions to prevent entering at extremes.
Confirm trend continuation or reversal post-news release.
Combining news signals with technical validation significantly reduces noise-driven errors.
11. Psychology of Noise-Free News Trading
Discipline is crucial:
Accept that not all news is tradeable.
Avoid impulsive decisions from fear of missing out (FOMO).
Stick to rules-based strategies.
Embrace patience—waiting for the right news with proper context yields higher probability trades.
12. Advantages of News Trading Without Noise
Reduced False Signals: Focus on actionable information only.
Higher Probability Trades: Only trading on verified market-moving events.
Lower Stress: Avoid constant monitoring of minor headlines.
Better Risk-Reward Ratio: Fewer trades but higher-quality setups.
Systematic Approach: Rules-based trading reduces emotional errors.
13. Limitations and Challenges
Lag in Information: Even verified news may reach some market participants faster.
Market Reaction Uncertainty: Sometimes markets overreact or underreact to news.
Liquidity Risk: Sudden news spikes can cause slippage.
Complex Analysis Required: Filtering noise and interpreting context requires skill and experience.
14. Best Practices
Focus on high-impact, verified news.
Use pre-event preparation to anticipate possible outcomes.
Apply strict risk management rules.
Combine fundamental news analysis with technical tools.
Avoid trading purely on social media speculation.
Maintain journal and review system to learn from past trades.
15. Future of Noise-Free News Trading
With AI, NLP, and machine learning, the ability to filter noise and extract actionable news will improve. Algorithmic strategies can parse millions of data points in seconds, allowing retail traders to approach institutional efficiency in news trading. However, human judgment remains critical in interpreting context and applying discretion.
Conclusion
News trading without noise is a disciplined, strategic, and selective approach to capitalizing on market-moving information. It emphasizes filtering irrelevant data, analyzing context, and acting decisively while managing risk. By focusing on signal over noise, traders can improve their probability of success, reduce emotional stress, and achieve sustainable profitability.
In today’s hyper-connected world, where information is abundant but attention is limited, mastering news trading without noise is not just an edge—it is a necessity for serious market participants.
Investors, Traders, and PolicymakersImportance of Global Trading for Investors, Traders, and Policymakers
1. Introduction to Global Trading
Global trading operates on multiple levels: goods and services, equity and debt markets, derivatives, currencies, and commodities. It is driven by comparative advantages, technological innovation, financial liberalization, and geopolitical developments.
Key characteristics include:
Interconnected Markets: Global financial markets are highly interlinked, making regional events impactful worldwide.
Liquidity and Accessibility: Investors and traders can access international assets, currencies, and derivatives from virtually anywhere.
Information Flow: Technological advances ensure faster dissemination of economic data, corporate news, and trading signals across borders.
The significance of global trading is profound, as it influences economic growth, investment strategies, and policy decisions.
2. Importance for Investors
Investors are individuals or institutions aiming to grow wealth over time. Global trading provides them with several advantages:
2.1 Portfolio Diversification
Investing in multiple international markets reduces risk exposure to any single economy or asset class. For example, equities in emerging markets may perform differently from those in developed markets, providing a hedge against domestic volatility.
Benefits:
Reduces portfolio risk through geographical diversification.
Exposure to a variety of asset classes (equities, bonds, ETFs, commodities).
Potential for higher long-term returns in rapidly growing economies.
2.2 Access to Growth Opportunities
Certain regions offer growth potential not available domestically. For instance, emerging markets often exhibit higher GDP growth, expanding consumer bases, and rapidly developing industries.
Example: Global investors buying shares in tech companies in Southeast Asia or Latin America can capture high growth rates absent in mature markets.
2.3 Currency Hedging and Returns
International investments introduce currency risk. While this can be a risk, it also offers opportunities for gains through currency appreciation.
Strategies: Investors can use derivatives, forward contracts, and ETFs to hedge currency risk or capitalize on favorable exchange rate movements.
2.4 Inflation Protection
Global trading allows investment in countries with stronger monetary policies or lower inflation rates, providing protection against domestic inflation erosion.
2.5 Participation in Global Innovation
Global markets allow investors to access innovations, technology companies, and sectors not present locally. This ensures exposure to cutting-edge industries like AI, biotech, renewable energy, and digital assets.
3. Importance for Traders
Traders, unlike long-term investors, focus on short- to medium-term price movements to profit from market volatility. Global trading affects traders in several dimensions:
3.1 Exploiting Market Inefficiencies
Global trading creates opportunities from price differentials, arbitrage, and time zone gaps. For instance:
Time Zone Arbitrage: Traders exploit differences between Asian and European or U.S. markets.
Cross-Exchange Arbitrage: Identifying discrepancies between futures, options, and underlying spot prices across regions.
3.2 Increased Liquidity
Global trading increases market participation, enhancing liquidity, reducing transaction costs, and improving the execution of trades. Traders can enter and exit positions more efficiently in liquid markets.
3.3 Access to Diverse Instruments
Global markets offer access to a wide variety of trading instruments:
Futures, options, CFDs, ETFs, and forex.
Commodities like oil, gold, and agricultural products.
Digital assets and cryptocurrencies.
3.4 Risk Management Strategies
Global trading provides tools to hedge risks:
Cross-Market Hedging: Hedging stock exposure with global index derivatives.
Currency Hedging: Protecting against adverse currency movements.
Sectoral Hedging: Using international commodities or equities to offset domestic sectoral risks.
3.5 Exploiting News and Macroeconomic Events
Traders leverage macroeconomic releases, central bank policies, and geopolitical developments worldwide to generate profits. Fast, algorithmic trading systems and HFT (High-Frequency Trading) strategies often capitalize on global news in milliseconds.
4. Importance for Policymakers
Policymakers, including government authorities, central banks, and regulatory bodies, rely on global trading for strategic economic planning and stability. Its importance is multidimensional:
4.1 Economic Growth and Development
Global trade allows countries to specialize in sectors where they have a comparative advantage, enhancing productivity, job creation, and GDP growth.
Trade Surpluses and Investment: Exports generate foreign exchange, which supports domestic investment and infrastructure development.
4.2 Policy Formulation and Regulation
Policymakers use insights from global markets to craft informed regulations:
Exchange rate policies, interest rate adjustments, and capital controls.
Financial market regulations to prevent systemic risk.
Taxation and investment incentives for foreign capital.
4.3 Financial Stability and Crisis Management
Global trading links domestic economies to international financial systems. Policymakers must monitor cross-border capital flows, manage currency volatility, and mitigate risks from global shocks.
Example: The 2008 financial crisis demonstrated how interconnected markets can transmit shocks worldwide. Policymakers need coordination with international bodies (IMF, World Bank) to stabilize economies.
4.4 Promoting Investment and Capital Inflows
Open financial markets attract foreign direct investment (FDI) and portfolio inflows, stimulating growth and innovation. Policymakers can leverage global trading to:
Encourage technology transfer.
Enhance employment opportunities.
Strengthen financial infrastructure.
4.5 Global Competitiveness
Policymakers can benchmark domestic performance against international markets, ensuring competitiveness in sectors like technology, finance, and manufacturing.
5. Interconnected Impact on All Stakeholders
The importance of global trading lies not only in isolated benefits but also in its systemic impact:
5.1 Feedback Loops
Investors’ foreign portfolio allocations affect currency stability.
Traders’ activity influences volatility and liquidity.
Policymakers’ decisions impact market sentiment globally.
5.2 Information Flow and Transparency
Global trading promotes transparency, standardization, and reporting practices. Access to international data helps all stakeholders make informed decisions.
5.3 Technological Advancement
Advances in fintech, electronic trading, blockchain, and AI analytics are driven by global demand. Investors and traders gain new tools, while policymakers regulate emerging technologies to prevent systemic risk.
6. Challenges and Considerations
Despite the opportunities, global trading poses challenges that stakeholders must address:
6.1 Market Volatility
Global markets are susceptible to rapid swings due to geopolitical events, economic crises, or policy changes.
6.2 Currency and Interest Rate Risks
Exchange rate fluctuations and cross-border monetary policies can affect returns for investors and traders.
6.3 Regulatory Disparities
Different regulatory frameworks can complicate trading, requiring compliance expertise and coordination.
6.4 Political and Geopolitical Risks
Trade wars, sanctions, and diplomatic tensions can disrupt global markets.
6.5 Technological and Cyber Risks
The interconnectedness of markets increases vulnerability to cyberattacks, algorithmic errors, and system failures.
7. Strategies for Leveraging Global Trading
For Investors:
Diversify portfolios globally across regions and asset classes.
Hedge currency and political risks.
Monitor macroeconomic indicators across major economies.
For Traders:
Exploit time zone and cross-market price differentials.
Use algorithmic and high-frequency trading to capitalize on global events.
Manage risk through derivatives and hedging.
For Policymakers:
Foster policies encouraging foreign investment.
Maintain financial stability through prudent regulations.
Engage in international cooperation to manage crises.
8. Conclusion
Global trading is an indispensable component of modern financial systems. For investors, it provides diversification, growth opportunities, and access to innovation. For traders, it offers liquidity, arbitrage opportunities, and risk management tools. For policymakers, it is a strategic lever for economic growth, stability, and competitiveness.
The interconnected nature of global markets requires all stakeholders to adopt informed, proactive, and adaptive strategies. While the benefits are substantial, the associated risks—from volatility and currency exposure to regulatory and geopolitical challenges—cannot be ignored. Mastering global trading dynamics is essential for maximizing opportunities while safeguarding against systemic threats, making it a critical element of contemporary financial and economic strategy.

Role of High-Frequency Trading in Exploiting Time Zone Gaps1. Introduction
High-Frequency Trading (HFT) is a sophisticated form of algorithmic trading that leverages ultra-fast execution speeds, advanced algorithms, and low-latency market data to capitalize on tiny price movements in financial markets. In today’s globally interconnected financial markets, time zone differences across major exchanges create temporary pricing inefficiencies. These gaps between the closing of one market and the opening of another—or the delayed reactions to economic news—present opportunities for HFT firms to exploit discrepancies for profit.
HFT is often viewed with a combination of awe and skepticism because it operates at speeds inaccessible to human traders and can influence market liquidity, volatility, and price discovery. Time zone arbitrage is a natural extension of HFT strategies, enabling firms to capitalize on price gaps that exist due to temporal dislocations between geographically separated markets.
This paper explores the mechanics, strategies, technological infrastructure, advantages, risks, and regulatory considerations associated with using HFT to exploit time zone gaps.
2. Understanding Time Zone Gaps in Global Markets
2.1 Definition of Time Zone Gaps
Time zone gaps arise when markets in different regions operate during non-overlapping hours. For instance:
The New York Stock Exchange (NYSE) closes at 4:00 PM EST.
The Tokyo Stock Exchange (TSE) opens at 9:00 AM JST, which is 8:00 PM EST.
During this gap, price movements in the U.S. may not yet be reflected in the Asian market, creating temporary mispricings. Similarly, European markets often open hours after the U.S. closes, leaving overnight news and macroeconomic developments unpriced until the next session.
2.2 Causes of Time Zone Gaps
Asynchronous Market Hours: Major financial centers—New York, London, Tokyo, Hong Kong, Sydney—operate in different time zones, leading to intervals when some markets are closed while others are active.
Delayed Reaction to News: Corporate earnings, geopolitical events, and macroeconomic announcements in one region may take hours to influence other markets.
Market Fragmentation: Different exchanges and liquidity pools may respond differently to the same event, creating temporary arbitrage opportunities.
2.3 Implications for Trading
Price gaps often emerge at the opening of a market relative to the previous session’s close in another region.
HFT firms aim to predict or quickly react to these gaps, capturing profits before the broader market adjusts.
These gaps can exist in equities, derivatives, ETFs, FX, and commodities.
3. High-Frequency Trading: An Overview
3.1 Definition and Key Characteristics
HFT is a type of algorithmic trading that uses powerful computers and complex algorithms to execute large numbers of trades at extremely high speeds. Key characteristics include:
Ultra-Low Latency: Milliseconds or microseconds matter; every fraction of a second can mean a competitive edge.
Algorithmic Decision-Making: Strategies are pre-programmed and self-executing.
High Trade Volume: Small profits per trade multiplied over thousands of trades can be highly lucrative.
Co-location: Servers are located physically close to exchange servers to minimize transmission delays.
3.2 Common HFT Strategies
Market Making: Posting buy and sell orders to capture bid-ask spreads.
Statistical Arbitrage: Exploiting statistical relationships between correlated assets.
Event-Driven Trading: Reacting instantly to news releases, earnings announcements, or economic data.
Latency Arbitrage: Exploiting time delays between the dissemination of market data across venues.
Time zone gaps are particularly suited for latency arbitrage and event-driven trading, where HFT firms act on information before the rest of the market fully absorbs it.
4. Exploiting Time Zone Gaps through HFT
4.1 Mechanics of Time Zone Arbitrage
Time zone arbitrage involves taking advantage of price differences that exist between markets due to temporal misalignment. HFT firms often employ:
Cross-Market Monitoring: Continuous tracking of markets in different time zones.
Predictive Modeling: Algorithms forecast opening prices based on prior session trends and news events.
Rapid Execution: Once a gap is identified, HFT algorithms execute trades in milliseconds to profit from temporary mispricings.
For example:
If the S&P 500 closes sharply higher, HFT systems may anticipate a correlated gap up in European indices before European markets open.
By placing orders just before the market opens, HFT firms can capture profits before human traders react.
4.2 Example Scenarios
Equities: U.S. market closes at 4 PM EST; Asian markets open with a lag. HFT algorithms analyze closing trends, overnight news, and macroeconomic releases to forecast opening moves in Asian indices.
FX Market: Currency markets operate 24/5 but exhibit varying liquidity across regions. HFT can exploit overnight USD/JPY gaps based on U.S. economic releases.
ETFs and ADRs: American Depository Receipts (ADRs) often trade at prices misaligned with their home market shares during time zone gaps. HFT can exploit these mismatches.
4.3 Technology Enablers
Low-Latency Networks: Microwave and fiber-optic links connect exchanges across continents for near-instantaneous data transfer.
High-Speed Data Analytics: Algorithms parse financial news, social media, and economic indicators in real-time.
Co-location Services: Hosting servers close to exchange servers reduces latency by milliseconds.
AI & Machine Learning: Models identify complex patterns and correlations that humans cannot discern.
5. Advantages of HFT in Time Zone Arbitrage
5.1 Speed and Precision
HFT executes trades faster than human traders, allowing firms to capture opportunities that exist for milliseconds to seconds.
5.2 Market Liquidity
HFT often adds liquidity, narrowing bid-ask spreads and improving market efficiency. By trading across multiple time zones, HFT can stabilize prices in otherwise thinly traded sessions.
5.3 Risk Management
Advanced algorithms allow for dynamic risk assessment and hedging in real-time, minimizing exposure in volatile periods.
5.4 Arbitrage Profits
Time zone gaps create predictable inefficiencies. HFT leverages these inefficiencies for consistent, albeit small, profits per trade that scale with volume.
6. Risks and Challenges
6.1 Market Volatility
Rapid HFT trading can amplify price swings during opening sessions, particularly when reacting to gaps or unexpected news.
6.2 Latency Competition
The race for the fastest execution is intense; even microsecond differences can determine profitability. Firms invest heavily in technology to maintain an edge.
6.3 Regulatory Scrutiny
HFT practices are closely monitored by regulators to prevent market manipulation or unfair advantages.
Practices like “spoofing” or excessive order cancellations in exploiting time gaps are illegal.
6.4 Systemic Risk
Heavy reliance on automated strategies across global markets introduces systemic risks; a failure in one algorithm could cascade through multiple time zones.
7. Regulatory and Ethical Considerations
7.1 Market Fairness
Regulators aim to ensure that HFT does not undermine market integrity or disadvantage retail investors. Time zone arbitrage must not cross into manipulative territory.
7.2 Reporting and Transparency
Exchanges often require HFT firms to report high volumes of activity and adhere to risk management standards.
Some jurisdictions impose minimum resting times for orders to reduce predatory trading in illiquid periods.
7.3 Cross-Border Implications
Time zone arbitrage often involves trading in multiple regulatory jurisdictions, creating legal complexities and compliance burdens.
8. Case Studies and Real-World Examples
U.S.–Europe Equity Arbitrage: HFT firms monitor closing prices in the S&P 500 and trade on correlated European indices at opening.
ADR Arbitrage: Discrepancies between ADRs and underlying foreign stocks allow HFT to capture instant profits.
Currency Arbitrage: Overnight U.S. economic announcements influence Asia-Pacific FX markets; HFT reacts faster than traditional market participants.
These cases illustrate how HFT transforms time zone gaps from dormant inefficiencies into profit-generating opportunities.
9. Future Trends
9.1 AI-Enhanced HFT
Artificial intelligence will increasingly enable predictive trading across time zones, anticipating market moves before they occur.
9.2 Global Market Synchronization
With increased connectivity, HFT may reduce the duration and magnitude of time zone gaps, forcing firms to innovate new strategies.
9.3 Regulatory Evolution
As HFT continues to exploit cross-border gaps, regulators are likely to implement stricter oversight, especially on latency arbitrage and cross-market manipulation.
9.4 Quantum Computing
Emerging technologies like quantum computing may redefine the speed and complexity of HFT, further reducing time lag inefficiencies globally.
10. Conclusion
High-Frequency Trading has fundamentally altered the landscape of global financial markets. Time zone gaps—once simply natural delays between regional market operations—are now actively exploited by HFT strategies to capture profits in milliseconds. By leveraging technology, algorithms, and advanced analytics, HFT firms capitalize on these inefficiencies, improving liquidity, accelerating price discovery, and enhancing market efficiency.
However, these advantages come with challenges: heightened competition, regulatory scrutiny, systemic risks, and ethical considerations. As markets continue to globalize and technology evolves, the interplay between HFT and time zone gaps will remain a critical area of study for traders, regulators, and policymakers alike.
Exploiting Closing vs Opening Price Gaps Across Regions1. Introduction
In global financial markets, one of the most intriguing phenomena observed by traders is the price gap between the previous day’s closing price in one region and the opening price in another. These gaps present opportunities for informed traders to anticipate price movements, hedge positions, and exploit short-term volatility. Understanding the mechanics of these gaps, their underlying causes, and the strategies to trade them is essential for both institutional and retail investors aiming to optimize returns in a highly interconnected market.
Price gaps occur due to various factors: geopolitical events, overnight news, earnings announcements, macroeconomic data, and liquidity mismatches. By analyzing historical data and employing structured trading strategies, traders can turn these gaps into actionable insights.
This article delves into the nature of closing vs opening price gaps, the drivers behind them, the strategies used to exploit them across different regions, and practical considerations for risk management.
2. Understanding Closing vs Opening Price Gaps
2.1 Definition of Price Gaps
A price gap occurs when an asset’s opening price significantly differs from the previous day’s closing price. These gaps can be either:
Up Gap: Opening price is higher than the previous close.
Down Gap: Opening price is lower than the previous close.
2.2 Types of Gaps
Common Gaps:
Often occur in quiet markets without major news. Typically filled quickly within the same trading session.
Breakaway Gaps:
Form when the market breaks a significant support/resistance level. Often precede sustained trends.
Runaway (Continuation) Gaps:
Appear during strong trending moves, confirming the momentum.
Exhaustion Gaps:
Occur near the end of a trend, signaling potential reversals.
2.3 Relevance Across Global Markets
Due to time zone differences, markets in Asia, Europe, and North America open and close at different times. For example:
Asian markets: Tokyo, Hong Kong, and Singapore operate roughly between 9:00–16:00 local time.
European markets: London and Frankfurt operate roughly 8:00–16:30 GMT.
US markets: NYSE and NASDAQ operate 9:30–16:00 EST.
Price gaps often reflect overnight developments in one region that impact the opening of another. This inter-market influence creates exploitable arbitrage opportunities.
3. Causes of Closing vs Opening Price Gaps
3.1 Overnight News and Events
Economic data releases, geopolitical developments, and corporate news can significantly shift investor sentiment between market closes. For example:
An unexpected US Federal Reserve interest rate change can trigger large opening gaps in Asian and European indices.
Earnings announcements released after US market close can affect European stocks the following day.
3.2 Currency Movements
In a globalized market, currency fluctuations often precede stock price adjustments across regions. For instance:
A sharp USD appreciation overnight can depress commodity-related stocks in Europe and Asia.
Emerging market equities denominated in local currencies are impacted by overnight forex volatility.
3.3 Liquidity and Market Participation
Different regions have varying levels of liquidity at different times:
Asian markets may close with low trading volumes in certain assets, leading to larger overnight gaps when European or US markets open.
Thin liquidity amplifies price swings, creating exploitable gaps.
3.4 Market Sentiment and Technical Levels
Price gaps are often exacerbated by technical triggers, such as:
Breakout above key resistance levels in one market.
Oversold or overbought conditions causing momentum-driven gaps at market open.
4. Strategies to Exploit Price Gaps Across Regions
4.1 Gap-Fill Strategy
Concept: Many gaps tend to "fill," meaning the price moves back to the previous close over the next few hours or days.
Steps:
Identify significant overnight gaps using pre-market data.
Evaluate news and sentiment to determine the likelihood of gap fill.
Enter a trade in the direction opposite to the gap.
Example:
If S&P 500 futures show a 1% down gap overnight due to weak Asian data, but no major US fundamentals changed, a trader may anticipate a partial recovery after the US market opens.
4.2 Momentum Gap Trading
Concept: Some gaps indicate strong momentum, and trading in the gap’s direction can be profitable.
Steps:
Confirm gap accompanied by high pre-market volume or strong news catalyst.
Trade in the direction of the gap after the market opens.
Set tight stop-losses to protect against reversals.
Example:
A positive earnings report from a major tech company may cause a European market to open significantly higher. Traders may ride the momentum early in the session.
4.3 Arbitrage Across Regions
Concept: Price differences between regional markets for the same asset or index create arbitrage opportunities.
Steps:
Track closing prices in one region and opening prices in another.
Identify statistically significant gaps exceeding normal volatility.
Take offsetting positions in correlated assets or derivatives.
Example:
If the Nikkei closes sharply down but US futures are up, a trader can exploit the relative price mismatch using ETFs or futures contracts.
4.4 Pre-Market and Post-Market Futures Trading
Futures markets often remain open when cash markets are closed, providing a predictive view of opening gaps.
Steps:
Analyze overnight futures data.
Compare futures with previous day’s close.
Anticipate opening gaps and place orders accordingly.
Advantages:
Provides a leading indicator for the cash market.
Reduces reaction time to overnight news.
Conclusion
Exploiting closing vs opening price gaps across regions is a sophisticated strategy requiring an understanding of global market interconnectivity, macroeconomic factors, and technical analysis. Traders can leverage these gaps through gap-fill strategies, momentum trading, cross-region arbitrage, and futures-based pre-market positioning.
Successful exploitation demands:
Strong analytical skills
Risk management discipline
Awareness of market hours, liquidity, and regional nuances
Access to high-quality, real-time data
By combining quantitative analysis with practical insights, traders can turn global price gaps into profitable opportunities while navigating the inherent volatility of interconnected financial markets.
Introduction to Time Zone Arbitrage in Global Markets1. Understanding Arbitrage in Financial Markets
At its core, arbitrage is the practice of exploiting price discrepancies of the same asset across different markets or forms to earn risk-free profit. This fundamental concept underpins much of modern financial trading. In theory, if a stock, currency, commodity, or derivative is priced differently in two markets, a trader can simultaneously buy low in one market and sell high in another, pocketing the difference.
Traditional arbitrage opportunities are rare and fleeting, especially in highly liquid and technologically advanced markets. With the advent of electronic trading, algorithmic strategies, and high-frequency trading, the speed at which these discrepancies are corrected has accelerated dramatically.
Time zone arbitrage emerges as a special form of arbitrage, where the temporal differences between markets become the primary source of exploitable inefficiencies. The financial world is never closed: while one market sleeps, another operates, creating windows for traders to capitalize on lagging price reactions.
2. Global Markets and Time Zones
Financial markets operate within strict local hours. For example:
New York Stock Exchange (NYSE): 9:30 AM – 4:00 PM EST
London Stock Exchange (LSE): 8:00 AM – 4:30 PM GMT
Tokyo Stock Exchange (TSE): 9:00 AM – 3:00 PM JST
These schedules create overlapping periods—for instance, NYSE and LSE overlap between 8:00 AM and 11:30 AM EST—where liquidity and volatility peak. However, outside these overlaps, markets function independently, and information from one market may not immediately influence another due to operational hours.
Time zone arbitrage exploits these gaps. For instance, significant economic data released in the U.S. after the Asian markets close can create arbitrage opportunities for traders when Asian markets reopen the next day. Essentially, traders are leveraging information delays caused by non-synchronous trading hours.
3. Mechanisms of Time Zone Arbitrage
Time zone arbitrage typically involves three major mechanisms:
Price Discrepancy Exploitation:
When an asset trades in multiple markets, its price may diverge temporarily due to the staggered opening hours. For example, a stock listed on both NYSE and LSE might react to corporate news at different times. A trader can buy in the lagging market and sell in the one where the news impact has already been reflected.
Currency Movements:
Forex markets operate 24/5, but liquidity and volatility vary by time zone. Economic announcements from one country may cause currency pairs to move in one region before others react. Traders who monitor these shifts can execute trades across regions to capture price differences.
Futures and Derivatives Arbitrage:
Futures and derivatives tied to underlying assets in different time zones can experience lagged reactions. For example, S&P 500 futures traded in Singapore may temporarily misprice relative to the U.S. cash market during Asian hours. Arbitrageurs can exploit these short-term inefficiencies.
4. Drivers of Time Zone Arbitrage Opportunities
Several factors contribute to the emergence of time zone arbitrage opportunities:
Information Asymmetry:
Not all markets receive or process information simultaneously. Corporate earnings announcements, economic data releases, or geopolitical events may affect markets differently depending on their opening hours.
Liquidity Gaps:
Markets in non-overlapping time zones may have lower trading volumes, causing temporary price inefficiencies. These liquidity gaps are prime targets for arbitrage strategies.
Currency and Macro-Economic Events:
Global macroeconomic releases—like U.S. Non-Farm Payrolls or European Central Bank announcements—impact multiple markets. Since these announcements occur during specific time zones, traders in other regions may act ahead of local market participants.
Technological Differences:
Not all markets are equally automated. While developed markets adjust quickly due to algorithmic trading, emerging markets may show delayed price reactions, enhancing arbitrage potential.
5. Examples of Time Zone Arbitrage
5.1 Forex Market
A classic example is the USD/JPY pair. Suppose a major U.S. economic report releases at 8:30 AM EST. Tokyo traders may not react until the TSE opens at 9:00 AM JST, creating a brief window where the currency pair’s price is misaligned with the news. Arbitrageurs can profit by executing trades between London, Tokyo, and New York markets.
5.2 Stock Market Cross-Listings
Many multinational companies list their shares in multiple exchanges. For example, HSBC trades in London, Hong Kong, and New York. If news affects the Hong Kong market during its daytime, traders can exploit the lag in New York’s reaction to the same news due to time differences.
5.3 Commodities Futures
Consider crude oil futures, which trade in both the CME in the U.S. and the Intercontinental Exchange (ICE) in London. A geopolitical event affecting oil supply may influence ICE prices during European hours, but CME futures may take time to adjust until New York opens, offering arbitrage potential.
6. Tools and Techniques
Modern time zone arbitrage relies heavily on technology. Key tools include:
Algorithmic Trading Systems:
These monitor multiple markets simultaneously, identify mispricings, and execute trades in milliseconds.
High-Frequency Trading (HFT):
Leveraging microsecond speed, HFT firms can capitalize on arbitrage opportunities across time zones before others detect them.
Data Feeds and News Analytics:
Real-time economic and corporate news feeds, combined with AI-powered sentiment analysis, allow traders to anticipate cross-market price movements.
Cross-Market Surveillance:
Continuous monitoring of correlated instruments across regions ensures timely identification of exploitable discrepancies.
7. Risks and Constraints
While time zone arbitrage is theoretically low-risk, several practical challenges exist:
Execution Risk:
Delays in order execution can turn profitable trades into losses.
Transaction Costs:
Spreads, commissions, and fees may erode arbitrage profits, especially in lower-liquidity markets.
Market Volatility:
Unexpected price swings due to global events may render arbitrage positions unprofitable.
Regulatory Barriers:
Some jurisdictions impose restrictions on cross-border trading, capital flows, or short-selling, limiting arbitrage potential.
Technological Risks:
Reliance on connectivity, data feeds, and trading algorithms exposes traders to system failures or cyber risks.
8. Strategies for Time Zone Arbitrage
Successful traders use a mix of strategies:
Cross-Exchange Arbitrage: Exploiting price differences for the same security on multiple exchanges.
Statistical Arbitrage: Using historical correlations and statistical models to predict and trade mispricings.
Latency Arbitrage: Capitalizing on delays in data transmission between markets.
Macro-Event Arbitrage: Reacting to economic, political, or corporate events affecting global markets asynchronously.
9. Market Participants
Time zone arbitrage is primarily the domain of:
Institutional Traders: Hedge funds and proprietary trading desks dominate this space due to the scale and technology required.
High-Frequency Traders: Specialize in exploiting microsecond-level price discrepancies.
Global Asset Managers: Engage in cross-market hedging and arbitrage as part of portfolio optimization.
Retail Traders: Increasingly accessing time zone arbitrage opportunities through online platforms and ETFs, though on a smaller scale.
10. Broader Implications for Global Markets
Time zone arbitrage plays a vital role in market efficiency:
Price Discovery: Arbitrage helps synchronize prices across markets, improving transparency.
Liquidity Distribution: Facilitates smoother capital flows between regions.
Integration of Emerging Markets: Encourages alignment with global market trends.
Technological Advancements: Drives innovation in trading systems, data analytics, and risk management.
However, it can also introduce systemic risks. Over-reliance on algorithms or HFT in multiple time zones may amplify volatility during unexpected events, as seen in global “flash crashes.”
11. The Future of Time Zone Arbitrage
The evolution of global markets suggests that time zone arbitrage will continue to grow in complexity:
24/7 Markets: Cryptocurrency and digital asset markets operate round-the-clock, reducing traditional time gaps but creating new cross-exchange arbitrage opportunities.
AI and Machine Learning: Predictive models can detect emerging arbitrage opportunities faster than human traders.
Global Market Integration: As emerging markets align with major exchanges, arbitrage windows may shrink, but sophisticated strategies will continue to exploit subtler inefficiencies.
Regulatory Evolution: Harmonization of cross-border trading rules may reduce some arbitrage opportunities but also create standardized pathways for institutional strategies.
12. Conclusion
Time zone arbitrage is a sophisticated yet fundamental aspect of modern financial markets. By leveraging temporal gaps between global markets, traders can exploit price inefficiencies for profit. Its successful execution requires advanced technology, rapid decision-making, deep market knowledge, and careful risk management.
While it enhances market efficiency and integration, it also introduces challenges related to volatility, regulation, and technological dependency. As markets evolve—especially with the rise of 24/7 digital trading—time zone arbitrage will remain a critical area for institutional traders, high-frequency operations, and innovative investment strategies.
Ultimately, time zone arbitrage highlights the interconnectedness of global finance, demonstrating that even a world divided by hours can be united by the continuous pursuit of opportunity.
Currency Convertibility Issues in Global Markets1. Introduction to Currency Convertibility
Currency convertibility is critical for the functioning of international markets. A convertible currency allows:
Trade Facilitation: Businesses can pay and receive foreign currencies without restrictions.
Investment Flexibility: Investors can freely move capital across borders.
Economic Integration: Countries with convertible currencies can participate fully in the global economy.
Key terms:
Fully Convertible Currency: Freely exchangeable for any other currency without restrictions (e.g., US Dollar, Euro).
Partially Convertible Currency: Exchange is allowed for some transactions (like trade), but restricted for others (like capital account transactions).
Non-Convertible Currency: Cannot be freely exchanged; transactions require government approval or are prohibited (e.g., North Korean Won, Cuban Peso).
2. Historical Background
Historically, currency convertibility has evolved with global trade and economic integration:
Bretton Woods Era (1944-1971): Fixed exchange rates linked major currencies to the US Dollar, which was convertible to gold. Developing countries often had non-convertible currencies to protect domestic economies.
Post-Bretton Woods (1970s onwards): Shift to floating exchange rates increased currency convertibility, but capital controls remained in many emerging markets.
Modern Era: Globalization has pushed most developed nations toward full convertibility, while many emerging and frontier economies maintain partial restrictions to manage volatility and capital flight.
3. Types of Currency Convertibility Issues
Currency convertibility issues arise when restrictions impede the free exchange of a currency. They can be classified as follows:
3.1. Trade Convertibility Issues
Restrictions on import/export payments.
Limits on foreign exchange availability for international trade.
Common in countries with balance-of-payments crises.
Example: In India during the 1970s, foreign exchange allocation for imports was tightly controlled to manage reserves.
3.2. Capital Account Convertibility Issues
Restrictions on investment flows: foreign direct investment (FDI), portfolio investment, and lending.
Countries impose these to prevent sudden capital flight and speculative attacks.
Impact: While protective, it limits access to global finance.
Example: China maintains controlled capital account convertibility despite having a largely trade-convertible currency.
3.3. Dual Exchange Rate Systems
Countries maintain official vs. market exchange rates.
Official rate often underestimates currency value, creating incentives for black markets.
These systems arise due to currency overvaluation or limited reserves.
Example: Venezuela’s dual exchange rates in the 2010s caused widespread distortions in trade and imports.
3.4. Black Market and Parallel Market Issues
When official convertibility is restricted, a parallel market emerges.
Leads to currency speculation, inflation, and reduced confidence in the domestic currency.
Example: Zimbabwe’s hyperinflation in the 2000s led to a thriving black market for US Dollars.
4. Causes of Currency Convertibility Issues
Several factors can restrict currency convertibility:
4.1. Economic Instability
High inflation or fiscal deficits reduce investor confidence.
Governments may restrict convertibility to protect reserves.
4.2. Limited Foreign Exchange Reserves
Countries with small reserves cannot risk free capital outflows.
Convertibility restrictions are a tool to preserve reserves.
4.3. Speculative Attacks and Capital Flight
Free convertibility can trigger rapid outflows during crises.
Example: Asian Financial Crisis (1997) saw several currencies collapse due to speculative attacks.
4.4. Policy and Strategic Objectives
Some nations deliberately restrict convertibility to:
Protect infant industries.
Maintain control over foreign debt.
Shield the domestic economy from global shocks.
5. Implications of Currency Convertibility Issues
Currency convertibility issues have wide-ranging economic, financial, and social effects:
5.1. On International Trade
Restrictive policies increase transaction costs and delays.
Firms face uncertainty in pricing, payments, and hedging.
5.2. On Foreign Investment
Limited convertibility reduces investor confidence.
FDI inflows may decline, limiting economic growth.
5.3. On Domestic Economy
Encourages a shadow economy for foreign exchange.
Can lead to inflation and currency depreciation.
5.4. On Financial Markets
Currency volatility rises when markets anticipate policy shifts.
Hedging instruments are limited or costly.
6. Case Studies
6.1. India Pre-1991
India had strict foreign exchange controls and limited convertibility.
Imports and FDI required government approval.
The 1991 balance-of-payments crisis forced liberalization, leading to gradual convertibility.
6.2. China
China has a partially convertible Renminbi (RMB).
Trade account is largely convertible; capital account is tightly controlled.
This strategy stabilizes domestic financial markets while encouraging trade growth.
6.3. Venezuela
Overvalued Bolivar and dual exchange rates led to black markets.
Currency controls exacerbated inflation and scarcity of goods.
6.4. Eurozone
Euro is fully convertible across participating nations.
This has facilitated trade, investment, and capital mobility, highlighting the benefits of full convertibility.
7. Strategies to Address Convertibility Issues
Countries can adopt various measures to mitigate currency convertibility problems:
7.1. Gradual Liberalization
Phased approach from trade convertibility → capital convertibility.
Reduces risk of sudden outflows.
7.2. Strengthening Reserves
Adequate foreign exchange reserves improve confidence.
Enables smoother convertibility.
7.3. Exchange Rate Policy Adjustments
Managed float or crawling peg can balance stability with convertibility.
Avoids shocks from volatile global markets.
7.4. Capital Controls
Temporary measures during crises to prevent speculative attacks.
Should be transparent and predictable.
7.5. Encouraging Foreign Investment
FDI inflows bring foreign currency, supporting convertibility.
Incentives for long-term, stable investment help reduce risk.
8. Global Implications
Currency convertibility affects global finance in multiple ways:
Trade Expansion: Fully convertible currencies facilitate seamless trade and lower transaction costs.
Capital Flow Efficiency: Investors prefer economies with predictable currency exchange rules.
Financial Market Development: Convertibility encourages hedging instruments, derivatives, and risk management strategies.
Crisis Containment: Countries with restricted convertibility can insulate themselves temporarily from global shocks, but may also lose investor confidence.
9. Future Outlook
With globalization and digital finance, currency convertibility issues are evolving:
Digital Currencies and CBDCs: Central bank digital currencies may improve cross-border payments and reduce convertibility barriers.
Regional Currency Blocks: Initiatives like the African Continental Free Trade Area (AfCFTA) and the ASEAN Economic Community may enhance regional convertibility.
Emerging Market Reforms: Many emerging economies are gradually liberalizing currency accounts while balancing macroeconomic stability.
10. Conclusion
Currency convertibility is a vital aspect of economic integration and global financial stability. While fully convertible currencies offer benefits in trade, investment, and market efficiency, partial or non-convertible currencies provide temporary protection against volatility, capital flight, and external shocks. Understanding the nuances of convertibility issues helps policymakers, investors, and businesses navigate the complex global financial landscape. Future trends, including digital currencies and regional financial cooperation, are likely to shape how convertibility evolves in the next decades.
GOLD WEEKLY CHART MID/LONG TERM ROUTE MAP UPDATEWeekly Chart Update – Follow Up
3732 Hit & Closed Above, 3806 Gap Opens – Now Completed
Previously we highlighted 3732 as the breakout target after confirming strength above 3659. That level was successfully achieved, and now we’ve gone a step further: 3806 has officially been HIT, completing this weekly chart idea.
This also means all of our multi-timeframe chart ideas have now completed, a full sequence cycle from setup to fulfilment.
Interim Outlook
We’ll share some interim analysis tomorrow to guide through the remainder of this week. On Sunday, a brand-new multi-timeframe analysis will be prepared and shared, laying the foundation for the weeks and months ahead.
In the meantime, if we see any corrections back into the existing chart idea range, the outlined levels remain valid for structure and range management.
Current Outlook
🔹 3806 Range Gap Completed
The final upside expansion objective has now been fulfilled, completing the cycle.
🔹 Correctional Supports – 3659 & 3576
Any detachment below raises correctional risk. 3659 and 3576 (Goldturn) remain critical support zones, with the channel top confluence offering a potential bounce zone.
Updated Levels to Watch
📉 Supports – 3659 & 3576 (correctional zones), deeper floor at 3482
📈 Resistance – 3806 (completed), awaiting new upside mapping in upcoming analysis
Plan
The bullish structure has completed its full range cycle into 3806. From here, corrections into support zones would be healthy resets, while we prepare to track fresh setups in the next multi-timeframe framework.
Flexibility with structure and levels remains key as we transition into the next phase.
Mr Gold
GoldViewFX

GOLD 4H CHART ROUTE MAP UPDATEHey Everyone,
Another PIPTASTIC day on the charts with our 4H chart also playing out as analysed.
Yesterday we completed our 1H chart idea and today we complete our 4H chart idea. After completing 3778 target, we had ema5 cross and lock gaps open above at 3811 and 3845 - Both of these gaps are now hit complecting this chart idea.
BULLISH TARGET
3696 - DONE
EMA5 CROSS AND LOCK ABOVE 3696 WILL OPEN THE FOLLOWING BULLISH TARGETS
3738 - DONE
EMA5 CROSS AND LOCK ABOVE 3738 WILL OPEN THE FOLLOWING BULLISH TARGET
3778 - DONE
EMA5 CROSS AND LOCK ABOVE 3778 WILL OPEN THE FOLLOWING BULLISH TARGET
3811 - - DONE
EMA5 CROSS AND LOCK ABOVE 3811 WILL OPEN THE FOLLOWING BULLISH TARGET
3845 - DONE
As always, we will keep you all updated with regular updates throughout the week and how we manage the active ideas and setups. Thank you all for your likes, comments and follows, we really appreciate it!
Mr Gold
GoldViewFX

ETH : Accumulation Before Next Big Rally??Ethereum continues to show strength on the weekly timeframe.
Weekly structure remains firmly bullish, IMO. Pullbacks are natural, but the weekly structure favors continuation.
Weekly closing about 4.2-4.3K could trigger massive rally on weekly TF.
Chart is self explanatory. This is purely my interpretation of the chart and it could go wrong.
Note: This post reflects my personal views for educational purposes. It is not financial advice. Always DYOR before making any and every decision.

Traditional Investment Options as Inflation Hedges1. Equities as an Inflation Hedge
1.1 Mechanism
Equities, or shares of publicly listed companies, represent ownership in businesses whose revenues and profits can rise with inflation. Companies producing essential goods, services, or commodities often have pricing power that allows them to pass on cost increases to consumers, preserving profit margins. Over long investment horizons, equities tend to offer nominal returns that outpace inflation, thereby enhancing real wealth.
1.2 Historical Evidence
Historically, stock markets have shown resilience during moderate inflationary periods. For example, research from the U.S. stock market during the 1970s—a period of significant inflation—demonstrated that equities provided superior real returns compared to fixed-income securities. Even in emerging markets, well-managed companies in sectors like consumer goods and energy have maintained profitability despite rising costs.
1.3 Sectoral Considerations
Not all equities respond equally to inflation. Sectors with pricing power—such as energy, utilities, consumer staples, and healthcare—often perform better. Conversely, sectors with high input costs and limited ability to raise prices, such as technology hardware or discretionary goods, may lag.
1.4 Advantages
Long-term growth potential
Dividend income can partially offset inflation
Liquidity and marketability
1.5 Risks and Limitations
Equity returns can be volatile in the short term
Inflation spikes may coincide with economic slowdowns, affecting corporate earnings
Sector-specific vulnerabilities
2. Bonds and Fixed Income Securities
2.1 Conventional Bonds
Traditional fixed-rate bonds are typically poor hedges against inflation. Their fixed coupon payments lose real value as prices rise, reducing purchasing power. Long-term bonds are particularly vulnerable, as inflation erodes the value of future interest payments.
2.2 Inflation-Linked Bonds
To counter this, many countries issue inflation-protected securities, such as Treasury Inflation-Protected Securities (TIPS) in the U.S. or Inflation-Indexed Bonds elsewhere. These bonds adjust principal and interest payments in line with inflation indices, providing a direct hedge against rising prices.
2.3 Advantages
Guaranteed principal and interest adjustments (in case of inflation-linked bonds)
Lower risk compared to equities
Useful for conservative investors seeking stable income
2.4 Limitations
Real returns may be modest compared to equities
Inflation-indexed bonds are subject to interest rate risk and liquidity concerns
Tax treatment of inflation-adjusted interest can affect net returns
3. Real Estate Investments
3.1 Mechanism
Real estate—whether residential, commercial, or industrial—represents tangible assets whose value often rises with inflation. Property rents and valuations typically track inflation over time, preserving real wealth. Real estate also offers diversification benefits, reducing correlation with financial markets.
3.2 Historical Performance
During periods of high inflation, property prices in urban and high-demand areas have historically appreciated in nominal terms. For instance, real estate in major U.S. cities during the 1970s outpaced inflation, while rental income also increased, providing an ongoing income stream.
3.3 Advantages
Tangible asset with intrinsic value
Potential for rental income
Portfolio diversification
3.4 Risks and Limitations
Illiquidity: Real estate transactions take time and incur significant costs
Maintenance, property taxes, and regulatory changes can affect returns
Location-specific risks and cyclical downturns
4. Commodities and Precious Metals
4.1 Gold
Gold is traditionally viewed as a safe-haven asset and an effective inflation hedge. Its value is not tied to currency and generally rises during periods of monetary instability or high inflation.
4.2 Oil and Energy Commodities
Energy commodities, including crude oil and natural gas, respond directly to economic and inflationary pressures. Companies and investors often use commodities to diversify portfolios against inflation risk.
4.3 Agricultural Commodities
Food and agricultural commodities tend to rise in price during inflationary periods, providing real returns. However, they can be volatile due to weather, supply chain disruptions, and global demand fluctuations.
4.4 Advantages
Hedge against currency depreciation and inflation
Portfolio diversification
Tangible value
4.5 Risks and Limitations
Price volatility and speculation
Storage and transaction costs for physical commodities
Correlation with global economic cycles
5. Cash Equivalents and Short-Term Instruments
5.1 Money Market Instruments
Short-term instruments like Treasury bills, commercial paper, and certificates of deposit provide liquidity and capital preservation but are typically weak inflation hedges due to low interest rates relative to inflation.
5.2 Strategies to Enhance Returns
Investors often ladder short-term instruments or invest in floating-rate instruments that adjust with market interest rates, partially mitigating inflation erosion.
5.3 Advantages
Low risk and high liquidity
Stability for capital preservation
5.4 Limitations
Real returns often negative during high inflation
Limited growth potential
6. Diversification Across Traditional Assets
6.1 Multi-Asset Portfolios
A balanced portfolio combining equities, inflation-linked bonds, real estate, and commodities offers a more robust hedge against inflation. Diversification reduces the risk of overexposure to any single asset class and ensures smoother real returns.
6.2 Portfolio Allocation Strategies
Equity-heavy portfolios: Suitable for long-term growth with moderate risk tolerance
Bond-heavy portfolios: For conservative investors seeking inflation-linked income
Real estate and commodities: For tangible assets and diversification
6.3 Historical Evidence
Multi-asset portfolios consistently outperform single-asset strategies during inflationary periods, particularly when asset allocations are periodically rebalanced to reflect changing economic conditions.
7. Practical Considerations for Investors
7.1 Risk Tolerance
Investors must assess their ability to absorb short-term volatility in pursuit of long-term inflation protection.
7.2 Investment Horizon
Longer horizons allow equities and real estate to outperform inflation, while shorter horizons may require more stable, inflation-linked bonds.
7.3 Cost and Liquidity
Transaction costs, management fees, and liquidity constraints influence the real return of inflation-hedging investments.
7.4 Tax Implications
Capital gains, dividends, and interest may be taxed differently, affecting net inflation-adjusted returns.
Conclusion
Traditional investment options—equities, bonds, real estate, and commodities—offer diverse avenues for hedging against inflation. Equities provide long-term growth potential, particularly in sectors with pricing power. Inflation-linked bonds offer stability and guaranteed inflation protection. Real estate provides tangible assets and rental income, while commodities, especially gold, serve as a hedge against currency depreciation and macroeconomic uncertainty.
Effective inflation hedging requires a well-diversified portfolio, tailored to the investor’s risk tolerance, horizon, and financial goals. While no investment is entirely immune to inflation, a judicious combination of traditional assets, periodic rebalancing, and strategic allocation can preserve real wealth and ensure financial stability across economic cycles.
Investors who integrate these principles into their financial planning are better equipped to safeguard purchasing power, manage risk, and achieve long-term wealth accumulation—even in the face of persistent inflationary pressures.
Market Volatility: Introduction and Types1. Introduction to Market Volatility
1.1 Definition of Market Volatility
Market volatility refers to the rate and magnitude of price fluctuations in a financial market over a given period. It is a measure of the risk or uncertainty associated with the changes in the value of assets, securities, or an index. High volatility indicates rapid and large price swings, while low volatility suggests relatively stable prices.
In simple terms, volatility shows how “wild” or “calm” a market is. It is an essential concept for traders, investors, and policymakers because it influences investment decisions, risk management, and market stability.
1.2 Importance of Understanding Market Volatility
Market volatility is not inherently negative; it has both risks and opportunities:
For Investors: Helps in portfolio diversification and managing risk.
For Traders: Offers opportunities for profit from price swings.
For Policymakers: Signals economic uncertainty, financial stress, or speculative bubbles.
For Risk Managers: Enables designing hedging strategies to minimize losses.
Volatility often increases during economic crises, geopolitical tensions, or major policy changes, making its monitoring critical.
1.3 Measuring Market Volatility
Volatility can be measured statistically or derived from market instruments:
Statistical Measures: Standard deviation, variance, beta coefficient.
Implied Volatility: Derived from options pricing models (e.g., Black-Scholes).
Volatility Indices: Like VIX, which reflects the market’s expected future volatility.
Understanding measurement techniques is crucial because they allow investors to quantify uncertainty and price risk more effectively.
2. Types of Market Volatility
Market volatility can be classified into various types based on time horizon, causes, and nature. Understanding these types helps investors and traders adapt strategies to market conditions.
2.1 Historical Volatility
Historical volatility measures past price movements over a specific period.
Calculation: Standard deviation of returns from historical price data.
Use Case: Helps predict future risk based on past trends.
Limitation: Past performance may not always indicate future volatility.
Example: The standard deviation of daily returns of the S&P 500 over the last 30 days.
2.2 Implied Volatility
Implied volatility (IV) is forward-looking, derived from options prices.
Definition: The market’s expectation of the asset’s future volatility.
Calculation: Using options pricing models like Black-Scholes.
Significance: High IV indicates markets expect large price swings, low IV indicates stability.
Example: A sharp increase in VIX reflects high implied volatility for the S&P 500.
2.3 Historical vs. Implied Volatility
Feature Historical Volatility Implied Volatility
Basis Past price data Options prices (future expectation)
Nature Backward-looking Forward-looking
Use in Trading Risk measurement Pricing and hedging
Limitation May not reflect sudden shocks Dependent on market perception
2.4 Market Volatility Based on Frequency
Volatility can also be classified by how often price swings occur:
Short-term Volatility:
Daily or intraday price fluctuations.
Important for day traders and scalpers.
Medium-term Volatility:
Weekly or monthly swings.
Crucial for swing traders and short-term investors.
Long-term Volatility:
Yearly or multi-year fluctuations.
Significant for long-term investors and fund managers.
2.5 Structural Volatility vs. Event-Driven Volatility
Structural Volatility:
Caused by long-term economic, policy, or market structure changes.
Example: Deregulation, introduction of new financial instruments.
Event-Driven Volatility:
Triggered by specific events, usually sudden and short-lived.
Example: Earnings announcements, geopolitical conflicts, central bank rate decisions.
2.6 Sector-Specific vs. Market-Wide Volatility
Sector-Specific Volatility:
Affects specific industries or sectors.
Example: Oil price shocks affecting energy stocks.
Market-Wide Volatility:
Affects the entire market or economy.
Example: Global financial crisis, pandemic-induced market crashes.
2.7 Volatility Based on Price Direction
Symmetric Volatility:
Price swings equally likely upwards or downwards.
Example: Stable markets with balanced buying and selling pressure.
Asymmetric Volatility:
Price swings more pronounced in one direction.
Example: Markets react more sharply to negative news than positive news (leverage effect in stocks).
2.8 Measured vs. Perceived Volatility
Measured Volatility:
Quantitative, calculated using historical price data or standard deviations.
Perceived Volatility:
Psychological perception of risk by investors.
Influenced by media, rumors, and sentiment.
2.9 Other Specialized Types of Volatility
Exchange Rate Volatility:
Fluctuations in currency markets, impacting global trade and investment.
Commodity Price Volatility:
Price swings in commodities like oil, gold, or wheat, often due to supply-demand imbalances.
Interest Rate Volatility:
Fluctuations in bond yields or central bank rates affecting bond markets, equities, and currencies.
Equity Market Volatility:
Swings in stock prices or indices, influenced by earnings, macroeconomics, or speculation.
3. Factors Influencing Market Volatility
Macroeconomic Indicators: GDP growth, inflation, unemployment rates.
Monetary Policies: Central bank interest rate changes, liquidity injections.
Political Events: Elections, geopolitical tensions, trade wars.
Global Shocks: Pandemics, natural disasters, oil crises.
Market Structure: Liquidity, trading volume, leverage, and derivatives use.
Investor Behavior: Herd mentality, fear, greed, and speculative activity.
4. Volatility in Financial Markets
4.1 Equity Markets
Equities often show high volatility due to earnings reports, news, and macroeconomic conditions.
4.2 Bond Markets
Bonds are generally less volatile but sensitive to interest rate changes and credit risk.
4.3 Forex Markets
Currency markets are highly volatile due to global trade, interest rate differentials, and political risk.
4.4 Commodity Markets
Commodity prices fluctuate due to supply-demand imbalances, geopolitical tensions, and speculative trading.
5. Implications of Market Volatility
For Traders: Opportunity for profit through short-term trading strategies.
For Investors: Risk management through diversification and hedging.
For Policymakers: Indicator of financial stability and economic stress.
For Economists: Understanding cycles of boom, bust, and correction.
6. Conclusion
Market volatility is an intrinsic characteristic of financial markets, reflecting the dynamic interplay of economic, political, and behavioral factors. Recognizing its types, measurement methods, and underlying causes enables participants to navigate markets more effectively, optimize risk-adjusted returns, and anticipate potential disruptions.
Volatility, when understood and managed correctly, transforms from a source of fear to a tool for opportunity, making it central to modern finance.
Freight Power and Economic Growth1. The Concept of Freight Power
Freight power can be conceptualized through multiple dimensions:
Transport Infrastructure Capacity: The total capacity of road, rail, air, and port networks to move goods. High-capacity networks enable faster and larger volume movement.
Logistics Efficiency: Includes time taken to move goods, reliability of delivery, customs efficiency, and the technology used for inventory and transport management.
Modal Diversity: The ability to move goods via multiple transport modes (road, rail, waterways, air) improves resilience and reduces bottlenecks.
Regulatory and Policy Environment: Policies that ease transport, reduce tariffs, and promote trade corridors enhance freight power.
Integration with Global Supply Chains: Freight power grows exponentially when a nation’s logistics system is connected to international trade networks.
Essentially, freight power reflects both the quantity and quality of freight movement and its ability to sustain continuous economic activity.
2. Freight Power as a Driver of Economic Growth
Freight power and economic growth are interdependent. Several mechanisms explain this relationship:
2.1 Reducing Transaction Costs
Efficient freight systems lower the cost of moving goods. This reduction in transaction costs allows businesses to expand markets, improve profitability, and attract investment. Lower transportation costs also reduce the final price of goods, increasing consumer purchasing power.
2.2 Enabling Industrial Expansion
Industrial growth depends on the timely movement of raw materials to factories and finished products to markets. Countries with strong freight power can support large-scale industrial hubs and complex manufacturing supply chains. For instance, China’s industrial growth is closely linked to its investment in railways, ports, and highways.
2.3 Promoting Trade Competitiveness
Freight power enhances a country’s ability to participate in international trade. Efficient ports and shipping corridors allow exporters to access global markets rapidly, reducing lead times and enhancing competitiveness. Economies with poor logistics infrastructure often suffer from delayed shipments, higher costs, and reduced trade volumes.
2.4 Stimulating Employment and Regional Development
Freight and logistics systems create direct employment in transport, warehousing, and infrastructure sectors. They also stimulate regional development by connecting remote areas to urban markets. Industrial zones near ports, rail hubs, or highways tend to grow faster due to easier access to inputs and markets.
2.5 Supporting Agricultural Growth
For agrarian economies, freight power is critical for moving perishable goods efficiently. Refrigerated transport, efficient rural roads, and cold storage systems reduce post-harvest losses and enhance farmers’ incomes.
3. Freight Power and Macroeconomic Indicators
The impact of freight power on economic growth can be traced through several macroeconomic indicators:
3.1 Gross Domestic Product (GDP)
Transport and logistics are part of the services sector, contributing directly to GDP. More importantly, freight efficiency indirectly boosts GDP by facilitating industrial output and trade expansion.
3.2 Trade Balance
Improved freight systems lower export costs and enhance the competitiveness of domestic products abroad. Efficient freight corridors can transform landlocked economies by providing faster access to ports, improving their trade balance.
3.3 Inflation and Price Stability
Efficient freight reduces distribution costs, which can dampen inflationary pressures. Conversely, logistics bottlenecks increase the cost of goods, contributing to price volatility.
3.4 Foreign Direct Investment (FDI)
Investors prefer locations with robust logistics infrastructure. Countries with strong freight power attract FDI in manufacturing, warehousing, and trade sectors, stimulating employment and technology transfer.
4. Modes of Freight and Their Economic Impact
Freight power depends on the efficient integration of multiple modes of transport:
4.1 Road Freight
Road networks provide door-to-door connectivity, critical for domestic trade. Well-maintained highways reduce travel time, fuel consumption, and vehicle maintenance costs, supporting small and medium enterprises (SMEs) and regional markets.
4.2 Rail Freight
Railways are ideal for bulk cargo like coal, minerals, and grains. Rail freight is more cost-efficient over long distances and supports industrial clusters. Countries like India and China have leveraged rail freight to boost heavy industries.
4.3 Maritime Freight
Seaports are the backbone of international trade. Containerization and port efficiency directly influence export-import volumes. Countries with strategic ports can become trade hubs, boosting employment and foreign exchange earnings.
4.4 Air Freight
Air freight is crucial for high-value, perishable, or time-sensitive goods. Though costly, it facilitates global integration for sectors like electronics, pharmaceuticals, and fashion.
4.5 Intermodal Freight
The combination of road, rail, and sea freight enhances efficiency and flexibility. Logistics parks, container depots, and technology-driven freight management systems increase economic output.
5. Case Studies: Freight Power and Economic Growth
5.1 China
China’s Belt and Road Initiative and domestic investment in high-speed rail, highways, and ports have dramatically increased freight power. This infrastructure surge has enabled China to dominate global manufacturing and exports, leading to sustained GDP growth over decades.
5.2 India
India’s freight corridors, like the Dedicated Freight Corridor (DFC), aim to decongest road networks and enhance rail freight efficiency. Improved freight power can stimulate industrial clusters, reduce logistics costs (currently among the highest globally), and promote regional development.
5.3 European Union
The EU’s integrated transport networks, including cross-border highways, rail corridors, and ports, support intra-European trade. Freight power facilitates the free movement of goods, enhancing GDP and employment across member states.
6. Challenges in Freight Power Development
Despite its importance, many economies face challenges in enhancing freight power:
Infrastructure Bottlenecks: Aging ports, congested highways, and limited rail networks constrain growth.
High Logistics Costs: Developing countries often incur 10–20% of GDP in logistics costs compared to 5–10% in developed nations.
Regulatory Hurdles: Complex customs procedures, inefficient permits, and cross-border restrictions impede freight movement.
Technological Gaps: Lack of digital tracking, automated warehouses, and intelligent transport systems reduce efficiency.
Environmental Concerns: Freight transport contributes significantly to carbon emissions. Sustainable solutions are essential for long-term economic and environmental balance.
7. Policy Recommendations
To maximize the contribution of freight power to economic growth, governments and private actors should consider:
Infrastructure Investment: Expand highways, railways, ports, and logistics parks. Public-private partnerships can accelerate this.
Technology Integration: Implement smart logistics systems, GPS tracking, automated warehouses, and AI-based transport management.
Regulatory Reforms: Simplify customs procedures, reduce bottlenecks, and harmonize cross-border regulations.
Sustainability Focus: Promote green transport, electric vehicles, and carbon-efficient shipping practices.
Skill Development: Train personnel in modern logistics management to increase efficiency.
Regional Integration: Develop freight corridors that connect industrial zones, ports, and urban centers.
8. Future Trends
The future of freight power and economic growth is shaped by:
Digital Freight Platforms: AI-driven platforms will optimize routes, reduce fuel consumption, and increase reliability.
Autonomous Transport: Self-driving trucks, drones, and automated port operations will reduce human dependency and improve speed.
Green Logistics: Pressure to decarbonize will drive innovations in alternative fuels and eco-friendly supply chains.
Global Supply Chain Integration: Countries that integrate freight networks with global supply chains will attract more trade and investment.
Conclusion
Freight power is a cornerstone of economic growth. Efficient, diversified, and technologically advanced freight systems reduce costs, enhance trade competitiveness, stimulate industrial and agricultural output, and foster regional development. Countries that strategically invest in freight infrastructure, integrate logistics with global markets, and adopt sustainable practices can achieve faster, more inclusive, and resilient economic growth.
The link between freight power and economic growth is not linear—it is dynamic and multifaceted. While infrastructure alone is insufficient, its combination with policy support, technology, and global integration determines the true economic potential of freight power.
Corporate Bond Market Structure1. Evolution of the Corporate Bond Market
Early Development
The concept of debt securities goes back centuries. Governments were the first major issuers of bonds, using them to finance wars and infrastructure. Corporate bonds emerged later, particularly during the industrial revolution of the 19th century, when companies needed huge sums for railroads, mining, and manufacturing expansion.
Growth in the 20th Century
The rise of large corporations, combined with global trade and financial globalization, fueled bond issuance. By the late 20th century, corporate bonds had become a standard tool for raising debt capital, especially in developed economies like the United States, Europe, and Japan.
Modern Era
Today, the corporate bond market is massive. In the U.S. alone, the size of the outstanding corporate bond market exceeds $10 trillion. Globally, it is well over $30 trillion, making it one of the largest segments of capital markets. Corporate bonds now exist in many forms, from high-grade investment bonds to speculative “junk bonds,” convertible bonds, and structured products.
2. Key Functions of the Corporate Bond Market
Capital Raising for Companies
Provides long-term financing without diluting equity.
Used for business expansion, acquisitions, refinancing, and working capital.
Investment Opportunities
Offers investors predictable cash flows through interest payments.
Provides diversification relative to equities.
Economic Growth Enabler
Funds infrastructure, innovation, and job creation.
Financial Market Stability
Serves as a safe asset class for institutions like pension funds and insurance companies.
3. Participants in the Corporate Bond Market
The structure of the market is defined by the interaction of its key participants:
a) Issuers
Corporations issue bonds to raise funds. Issuers range from multinational giants like Apple, Microsoft, and Toyota to mid-sized and smaller firms. Bonds are often issued by:
Blue-chip corporations (investment grade).
Speculative-grade firms (high-yield or junk bonds).
Financial institutions (banks, insurance firms).
b) Investors
Demand for corporate bonds is driven by:
Institutional investors: Pension funds, insurance companies, mutual funds, hedge funds, and sovereign wealth funds.
Retail investors: Individuals investing directly or through bond funds.
Foreign investors: Global appetite for U.S. dollar or Euro-denominated bonds is strong due to liquidity and stability.
c) Intermediaries
Underwriters (investment banks): Manage issuance, set prices, and distribute bonds.
Dealers and brokers: Trade bonds in secondary markets.
Market makers: Provide liquidity by quoting buy and sell prices.
d) Credit Rating Agencies
Agencies like Moody’s, S&P, and Fitch assess credit risk. Ratings influence demand, pricing, and regulatory capital requirements.
e) Regulators
U.S. Securities and Exchange Commission (SEC) oversees bond markets in the U.S.
Financial Conduct Authority (FCA) in the U.K.
European Securities and Markets Authority (ESMA) in Europe.
Regulations ensure disclosure, investor protection, and systemic stability.
4. Primary Market Structure (Issuance of Bonds)
The primary market is where bonds are first created and sold. The process involves several steps:
Decision to Issue Bonds
Company evaluates financing needs vs. equity or bank loans.
Mandating Underwriters
Investment banks act as underwriters, structuring the bond, preparing documentation, and marketing it to investors.
Credit Rating
Bonds are rated to guide investor expectations.
Pricing & Marketing
Roadshows and investor meetings build demand.
Coupon rates and yields are set based on market conditions.
Issuance
Bonds are sold through public offerings (widely distributed) or private placements (targeted investors).
Settlement
Investors receive bonds, issuers receive funds.
5. Secondary Market Structure (Trading of Bonds)
Once bonds are issued, they trade in the secondary market. Unlike stocks, corporate bonds rarely trade on centralized exchanges. Instead:
Over-the-Counter (OTC) Market
Bonds are traded through dealer networks.
Price discovery is less transparent than equities.
Electronic Trading Platforms
Recent advances have increased transparency with platforms like MarketAxess, Tradeweb, and Bloomberg.
Liquidity
Investment-grade bonds trade more actively than high-yield.
Older issues (off-the-run bonds) often become illiquid.
6. Types of Corporate Bonds
The structure of the market is also defined by the types of instruments it offers:
Investment-Grade Bonds
Rated BBB- or higher.
Lower yields, lower default risk.
High-Yield (Junk) Bonds
Rated below BBB-.
Higher yields, higher risk.
Convertible Bonds
Can be converted into company stock.
Callable & Puttable Bonds
Callable: Issuer can redeem before maturity.
Puttable: Investor can sell back before maturity.
Floating Rate Notes (FRNs)
Coupons tied to benchmarks like LIBOR/SOFR.
Green & Sustainable Bonds
Funds earmarked for environmental or social projects.
7. Market Infrastructure
Clearing & Settlement Systems: Operated by entities like DTCC (U.S.) or Euroclear (Europe).
Custodians: Hold securities for investors.
Trade Reporting Systems: FINRA’s TRACE system in the U.S. provides post-trade transparency.
8. Pricing & Valuation of Corporate Bonds
Pricing depends on multiple factors:
Credit Spread: Difference between corporate bond yields and government bond yields.
Duration & Interest Rate Risk: Longer duration means higher sensitivity to interest rate changes.
Liquidity Premium: Less liquid bonds trade at a discount.
Market Sentiment: Economic outlook, inflation, central bank policy.
9. Risks in Corporate Bond Markets
Credit Risk: Default by issuer.
Interest Rate Risk: Rising rates reduce bond values.
Liquidity Risk: Difficulty in selling bonds quickly.
Market Risk: Economic downturns can hurt valuations.
Event Risk: Mergers, acquisitions, regulatory changes, or scandals.
10. Regulation of Corporate Bond Markets
Regulators aim to ensure fair practices, transparency, and investor protection:
Disclosure Requirements: Prospectuses, financial statements, and risk factors.
Post-Trade Transparency: Mandatory reporting of trades in systems like TRACE.
Capital Adequacy Rules: Institutions holding corporate bonds must maintain sufficient capital buffers.
Market Conduct Rules: Prevent manipulation, insider trading, and mis-selling.
11. Global Corporate Bond Markets
United States: Largest, deepest, and most liquid corporate bond market.
Europe: Large, but more fragmented due to multiple jurisdictions.
Asia: Rapidly growing markets in China, Japan, and India.
Emerging Markets: Provide higher yields but carry political and currency risks.
12. Role of Technology and Innovation
Electronic Trading Platforms: Increasing liquidity and transparency.
Blockchain & Tokenization: Experiments in issuing digital bonds.
AI & Big Data: Credit risk modeling and predictive analytics.
ESG Integration: Technology tracks use of proceeds for green bonds.
13. The Corporate Bond Market and Financial Crises
2008 Global Financial Crisis: Corporate bond spreads widened sharply; high-yield bonds suffered.
COVID-19 Pandemic (2020): Liquidity dried up until central banks intervened with bond purchase programs.
Lessons: The market is sensitive to liquidity shocks but resilient with policy support.
14. Importance of Liquidity in Market Structure
Liquidity is the lifeblood of the corporate bond market. Key factors:
Large institutional trading drives volume.
Newer issues are more liquid than older ones.
Central bank intervention (e.g., QE programs) improves liquidity.
15. Future Trends in Corporate Bond Markets
Sustainable Finance Growth: Surge in green, social, and sustainability-linked bonds.
Digital Bonds: Blockchain adoption could streamline issuance and settlement.
Greater Transparency: Regulators pushing for real-time trade reporting.
Emerging Market Integration: More global capital flow into developing economies.
AI-Driven Trading: Algorithmic bond trading on the rise.
Conclusion
The corporate bond market is a sophisticated, multi-layered ecosystem that connects corporations with investors worldwide. Its structure is shaped by issuers, intermediaries, investors, credit agencies, and regulators. While the market is less transparent than equities, it is critical to the functioning of the global financial system, providing trillions of dollars in financing for companies and stable income for investors.
As the world transitions toward sustainable finance and embraces technology, the corporate bond market’s structure will continue to evolve—becoming more transparent, efficient, and globalized.
Carbon Credits in Global Trade1. Introduction
Climate change has become one of the most pressing challenges of the 21st century. Rising global temperatures, melting glaciers, erratic rainfall patterns, and extreme weather events are disrupting ecosystems, economies, and communities. Addressing this global threat requires not only local action but also coordinated international strategies. One of the key instruments developed to mitigate greenhouse gas (GHG) emissions and encourage sustainable practices is the concept of carbon credits.
Carbon credits represent a market-based solution designed to incentivize organizations, governments, and individuals to reduce emissions. By turning the reduction of greenhouse gases into tradable financial instruments, carbon credits link the environment with the global economy. As globalization intensifies and international trade continues to expand, carbon credits have gained prominence in global trade negotiations, corporate sustainability strategies, and national climate policies.
This essay provides a detailed 3000-word introduction to carbon credits in the context of global trade. It explains the fundamentals of carbon credits, explores their historical development, examines global frameworks, analyzes the role of carbon credits in international trade, and evaluates their challenges and future potential.
2. Understanding Carbon Credits
2.1 Definition of Carbon Credits
A carbon credit is a permit or certificate representing the right to emit one metric ton of carbon dioxide (CO₂) or its equivalent in other greenhouse gases. These credits function as part of a broader system known as cap-and-trade or carbon offsetting, which seeks to control total emissions while providing flexibility to polluters.
2.2 How Carbon Credits Work
Governments or regulatory bodies set an overall emissions cap.
Companies or entities are allocated emission allowances.
If a company emits less than its allowance, it can sell surplus credits.
If it emits more, it must purchase credits from others or invest in offset projects.
This creates a financial incentive to reduce emissions and promotes the growth of green projects like renewable energy, afforestation, or energy efficiency programs.
2.3 Types of Carbon Credits
Compliance Credits – Issued under mandatory schemes such as the EU Emissions Trading System (EU ETS).
Voluntary Credits – Created outside compliance markets for companies or individuals wanting to offset emissions voluntarily.
3. Historical Evolution of Carbon Credits
3.1 The Kyoto Protocol (1997)
The Kyoto Protocol introduced the first binding emission reduction targets for industrialized nations. It established three mechanisms:
International Emissions Trading (IET)
Clean Development Mechanism (CDM)
Joint Implementation (JI)
These mechanisms allowed nations to trade carbon credits internationally, laying the foundation for global carbon markets.
3.2 The Paris Agreement (2015)
The Paris Agreement broadened participation, requiring all signatory countries to submit Nationally Determined Contributions (NDCs). Article 6 of the agreement explicitly recognizes carbon trading as a tool for international cooperation, thereby reinforcing the role of carbon credits in global trade.
3.3 Growth of Voluntary Markets
Alongside compliance mechanisms, voluntary carbon markets emerged, enabling corporations and individuals to purchase credits for sustainability branding, corporate responsibility, or climate-neutral certification.
4. The Mechanics of Carbon Credit Markets
4.1 Cap-and-Trade Systems
Cap-and-trade programs set a maximum level of pollution and distribute or auction allowances. The tradability of credits ensures emissions reductions occur at the lowest possible cost.
4.2 Carbon Offsetting Projects
Credits can also be generated through projects that reduce or absorb emissions, including:
Renewable energy projects (solar, wind, hydro).
Forestry projects (reforestation, avoided deforestation).
Methane capture from landfills or agriculture.
Energy efficiency initiatives.
4.3 Pricing Mechanisms
The price of carbon credits is determined by supply and demand dynamics, policy frameworks, and the credibility of emission reduction projects. Prices vary significantly across markets, from a few dollars in voluntary markets to over €90 per ton in the EU ETS (as of recent years).
5. Carbon Credits in Global Trade
5.1 Linking Environment and Economy
Carbon credits transform emission reductions into economic assets, making climate mitigation a tradable commodity. This integration aligns environmental sustainability with the economic incentives of global trade.
5.2 International Trade in Carbon Credits
Countries and companies can trade carbon credits across borders. For example:
A developed country can invest in renewable energy projects in a developing country and earn credits.
Multinational corporations can buy credits globally to offset emissions from operations across supply chains.
5.3 Carbon Credits as Trade Instruments
Carbon credits are increasingly treated as:
Export goods (countries with large renewable potential sell credits).
Import substitutes (countries with limited capacity buy credits instead of domestic reductions).
Compliance tools (meeting international climate obligations).
This effectively integrates carbon credits into the architecture of global trade flows.
6. Regional and Global Frameworks
6.1 European Union Emissions Trading System (EU ETS)
The EU ETS is the largest carbon market, covering over 11,000 installations and airlines. It has become a model for other systems worldwide.
6.2 North America
California Cap-and-Trade Program
Regional Greenhouse Gas Initiative (RGGI) in the northeastern U.S.
6.3 Asia-Pacific
China launched the world’s largest carbon market in 2021.
South Korea and New Zealand have established trading systems.
6.4 Africa and Latin America
Several nations are exploring carbon credit exports through forestry and renewable projects, providing new avenues for green trade.
7. Benefits of Carbon Credits in Global Trade
7.1 Environmental Benefits
Encourages emission reductions.
Promotes renewable energy adoption.
Supports reforestation and conservation.
7.2 Economic Benefits
Creates new markets and investment opportunities.
Generates revenue for developing countries through credit exports.
Enhances competitiveness of eco-friendly firms.
7.3 Social Benefits
Provides local communities with jobs in renewable energy or forestry.
Improves public health by reducing pollution.
Supports sustainable rural development.
8. Challenges and Criticisms
8.1 Market Volatility
Carbon credit prices are often unstable, making long-term investments risky.
8.2 Double Counting
In some cases, emission reductions are claimed by both the host and investing country, undermining credibility.
8.3 Quality of Offsets
Not all offset projects deliver genuine, long-lasting reductions. “Greenwashing” remains a concern.
8.4 Equity Issues
Developing nations may become overly reliant on credit exports rather than focusing on domestic sustainability.
8.5 Regulatory Complexity
Different standards and fragmented markets hinder efficiency.
9. Future of Carbon Credits in Global Trade
9.1 Toward Harmonized Standards
Global efforts are underway to create standardized rules under Article 6 of the Paris Agreement, which could unify fragmented markets.
9.2 Integration with Supply Chains
Multinational corporations are embedding carbon credits into global supply chain management, ensuring sustainability from raw materials to final products.
9.3 Digital Transformation
Blockchain and AI are being used to track carbon credits, prevent fraud, and enhance transparency.
9.4 Expansion of Voluntary Markets
As ESG (Environmental, Social, and Governance) investing grows, voluntary markets are projected to expand rapidly.
9.5 A Tool for Green Trade Policies
Carbon credits may become central to carbon border adjustment mechanisms (CBAMs), where imported goods are taxed based on embedded carbon emissions.
10. Case Studies
10.1 EU–China Collaboration
European companies investing in renewable projects in China have created significant trade in credits, though concerns about project quality remain.
10.2 REDD+ Projects in Brazil
Brazil’s forests generate carbon credits by preventing deforestation, linking conservation with global carbon markets.
10.3 India’s Renewable Energy Projects
India has emerged as a major exporter of credits through solar and wind projects, showcasing how developing nations can benefit economically.
11. Policy Recommendations
Strengthen verification and monitoring systems.
Harmonize international standards to avoid double counting.
Ensure equitable participation of developing countries.
Integrate carbon credit trade into WTO frameworks.
Promote innovation in green technologies through credit revenues.
12. Conclusion
Carbon credits represent a transformative tool in aligning environmental protection with economic globalization. By monetizing the reduction of greenhouse gas emissions, they create financial incentives that encourage sustainable development and facilitate climate cooperation across borders. However, challenges such as market volatility, credibility concerns, and regulatory complexity must be addressed for the system to function effectively.
As climate change continues to shape global agendas, carbon credits will play a pivotal role in international trade, influencing how countries and corporations operate in a carbon-constrained world. Their future lies in harmonization, transparency, and integration into broader sustainability frameworks, making them not just instruments of compliance but essential building blocks of a greener global economy.

Differences Between Forwards and Futures Trading Introduction
In the vast landscape of financial markets, risk management and speculation are two of the most important forces driving investment strategies. Businesses, investors, and institutions constantly seek instruments that help them manage uncertainty while simultaneously creating opportunities to generate returns. Among the most prominent tools that serve this purpose are derivative contracts.
Derivatives are financial instruments whose value is derived from an underlying asset, such as stocks, bonds, commodities, currencies, or indices. Among the many types of derivatives—options, swaps, forwards, and futures—the last two hold a particularly important place in global finance.
At first glance, forwards and futures contracts appear to be similar: both are agreements to buy or sell an asset at a predetermined price at a specific date in the future. However, the structural and functional differences between the two are significant, and these distinctions make them suitable for different participants, use cases, and risk preferences.
This discussion will dive deep into the key differences between forwards and futures, exploring their characteristics, market structure, risk implications, advantages, disadvantages, and practical applications. By the end, you’ll have a clear understanding not only of the technical differences but also of the strategic role each plays in the global financial ecosystem.
What Are Forwards?
A forward contract is a customized, over-the-counter (OTC) agreement between two parties to buy or sell an asset at a specified price on a future date.
Key features:
Customization: Forwards are tailor-made. Parties can set their own contract size, settlement date, price, and terms.
OTC nature: They are not traded on an exchange. Instead, they are private agreements negotiated directly between buyer and seller.
No daily settlement: Payment occurs only at maturity, not daily.
Credit risk exposure: Since forwards are private deals, there is a chance that one party may default.
Use case: Businesses often use forwards to hedge against price fluctuations in commodities, foreign exchange, or interest rates.
Example:
A wheat farmer in India expects to harvest 100 tons of wheat in six months. To protect against price drops, he enters into a forward contract with a flour mill, agreeing to sell the wheat at ₹20,000 per ton six months later. Regardless of the market price at that time, both parties are bound to honor this deal.
What Are Futures?
A futures contract is a standardized agreement traded on an organized exchange to buy or sell an asset at a specific price on a future date.
Key features:
Standardization: Futures contracts have fixed sizes, maturity dates, and specifications set by the exchange.
Exchange-traded: They are traded on regulated exchanges (e.g., CME, NSE, BSE, ICE).
Daily settlement (mark-to-market): Gains and losses are settled daily. This reduces the risk of large defaults.
Margin requirements: Both buyer and seller must deposit an initial margin with the exchange and maintain variation margin based on daily fluctuations.
Liquidity and transparency: Since they are exchange-traded, futures are more liquid and transparent compared to forwards.
Example:
A trader buys a crude oil futures contract on the NYMEX at $80 per barrel for delivery in three months. If oil prices rise to $90, the trader profits; if prices fall to $70, the trader incurs losses. Daily mark-to-market ensures gains/losses are credited or debited every trading day.
Key Differences Between Forwards and Futures
Let’s break down the main differences across multiple dimensions:
1. Market Structure
Forwards: OTC contracts; negotiated privately.
Futures: Exchange-traded; standardized terms.
Implication: Futures benefit from regulatory oversight and liquidity, while forwards offer customization.
2. Contract Customization
Forwards: Fully customizable (quantity, price, asset quality, settlement date).
Futures: Standardized by exchange (fixed contract sizes, expiry dates, asset quality).
Implication: Corporates prefer forwards for precise hedging; traders prefer futures for liquidity.
3. Settlement Mechanism
Forwards: Settled at maturity (physical delivery or cash).
Futures: Daily mark-to-market settlement.
Implication: Futures reduce credit exposure through daily margining; forwards concentrate risk until maturity.
4. Counterparty Risk
Forwards: Exposed to counterparty default.
Futures: Exchange clearinghouse guarantees contracts.
Implication: Futures are safer for retail and institutional traders, while forwards may expose businesses to greater risk.
5. Liquidity
Forwards: Lower liquidity; contracts are unique.
Futures: High liquidity due to standardized contracts and active trading.
Implication: Futures are better for short-term speculation; forwards suit long-term hedging.
6. Regulation
Forwards: Lightly regulated; depends on private agreements.
Futures: Heavily regulated by exchanges and regulators (e.g., SEBI in India, CFTC in the U.S.).
7. Pricing Transparency
Forwards: Pricing is opaque; available only to contract parties.
Futures: Prices are publicly available in real time.
8. Settlement Type
Forwards: Usually physical settlement.
Futures: Can be cash-settled or physically delivered.
9. Participants
Forwards: Mostly corporates, banks, and institutions.
Futures: Retail traders, speculators, hedgers, and arbitrageurs.
10. Maturity
Forwards: Any date, based on parties’ agreement.
Futures: Fixed maturity dates (monthly, quarterly).
11. Default Risk Mitigation
Forwards: No default protection; depends on trust.
Futures: Clearinghouse acts as counterparty to all trades, ensuring default protection.
12. Cost Structure
Forwards: No upfront margin; but risk exposure exists.
Futures: Require margin deposits and daily variation margins.
13. Flexibility vs. Accessibility
Forwards: High flexibility, low accessibility for retail traders.
Futures: Lower flexibility, higher accessibility due to exchanges.
14. Speculative vs. Hedging Use
Forwards: Primarily hedging.
Futures: Both hedging and speculation.
Practical Examples
Commodity Hedging
Airline companies use forwards to lock in jet fuel prices with suppliers.
Traders use crude oil futures to speculate on price movements.
Currency Hedging
Exporters sign forward contracts with banks to lock in foreign exchange rates.
Speculators trade currency futures on exchanges like CME or NSE.
Interest Rate Management
Corporates use interest rate forwards with banks.
Traders hedge with interest rate futures on treasury bonds.
Advantages and Disadvantages
Forwards
Advantages:
Tailored contracts.
Useful for corporate risk management.
Disadvantages:
Illiquid.
High counterparty risk.
Lack of transparency.
Futures
Advantages:
Standardized and liquid.
Regulated and transparent.
Reduced counterparty risk via clearinghouses.
Disadvantages:
Less customization.
Margin requirements can be costly.
Mark-to-market can cause cash flow volatility.
Applications in Trading and Risk Management
Corporates: Use forwards for precise hedging.
Retail Traders: Use futures for speculation and short-term trades.
Institutions: Use futures for portfolio hedging, arbitrage, and diversification.
Regulatory Aspects
Forwards: Governed by contract law, not heavily regulated.
Futures: Regulated by government authorities and exchanges to ensure fair trading and reduce systemic risk.
Impact on Market Participants
Hedgers: Prefer forwards for customization; futures for liquidity.
Speculators: Prefer futures for leverage and ease of entry.
Arbitrageurs: Futures allow arbitrage between spot and derivatives markets.
Conclusion
Though forwards and futures may seem like two sides of the same coin, their structural differences shape how they are used in practice. Forwards provide flexibility and tailored solutions, making them valuable for corporates with specific hedging needs. Futures, on the other hand, offer standardization, transparency, and reduced risk, making them ideal for traders, institutions, and investors seeking liquidity and safety.
In essence, forwards are personal contracts, while futures are public contracts. Each has its place in the financial ecosystem, and the choice between the two depends on the needs, risk appetite, and market participation style of the user.