Has Bitcoin already priced in its next move ? | Day 56☃️ Welcome to the cryptos winter , I hope you’ve started your day well.
⏰ We’re analyzing BTC on the 1-Day timeframe .
👀 Bitcoin on the daily timeframe. After the flash crash it experienced, Bitcoin is almost building a box with a top at $114,559 and a bottom at $106,431, which by breaking these areas, it can get out of this trading range and give us a position.
The noteworthy point in the recent days is the Monday meeting between Trump and the President of China, which can determine the destiny of the market and give it a good direction.
🧮 The RSI oscillator, two key zones have formed for us in the areas of 54.5 and 36, and by the fluctuation limit crossing these areas, the next move of Bitcoin can begin.
🕯 Bitcoin’s volume on the daily timeframe has increased sharply after recording a new all-time high, and this has been a tendency toward increasing selling pressure. In the image, it is completely clear that you can see exactly what happened to the market after the flash crash it experienced.
📈 To take a position with this structural style that we currently have, you can refer to the multi-timeframe analysis of Bitcoin and extract the long and short position triggers, and if Bitcoin gives you an entry, enter the position around the anticipated top or bottom with low risk so that later you can add more volume to your position at higher or lower levels.
❤️ Disclaimer : This analysis is purely based on my personal opinion and I only trade if the stated triggers are activated .
Tradingview

FLNC 1D – The power comeback!On the daily chart, Fluence Energy (FLNC) shows a clean cup and handle formation followed by a golden cross (MA50 crossing above MA200) - a textbook bullish reversal setup.
Price broke out of the structure and is now pulling back into the buy zone ($14.57–$16.80) - a confluence of Fibonacci support and previous resistance.
✅ Golden cross confirms trend reversal
✅ Rising volume supports the move
✅ MAs below price - bulls are in control
The first target sits near $27.43, while the second projection extends to $40.28 if momentum continues.
Fundamentally, Fluence remains a leader in energy storage and grid technology - a hot spot for global investment as the renewable sector accelerates.
Let’s just say - this chart looks fully charged ⚡️

ARDX – Double Rising Window Hints Bullish ContinuationARDX – CURRENT PRICE : 6.06
The stock has broken above its long-term downtrend line accompanied by strong volume (look at red arrow). This breakout was confirmed by the formation of a Rising Window (1), signaling the end of the previous bearish phase.
Another Rising Window (2) appeared recently, again on high trading volume, reinforcing bullish sentiment and indicating the likelihood of a continuation in the uptrend. Take note also that the RSI has climbed into bullish territory (above 50), suggesting a shift in momentum towards buyers’ control and further room for upside before reaching overbought conditions.
ENTRY PRICE : 5.80 - 6.10
FIRST TARGET : 7.00
SECOND TARGET : 8.00
SUPPORT : 5.11 (bottom of the Rising Window area)

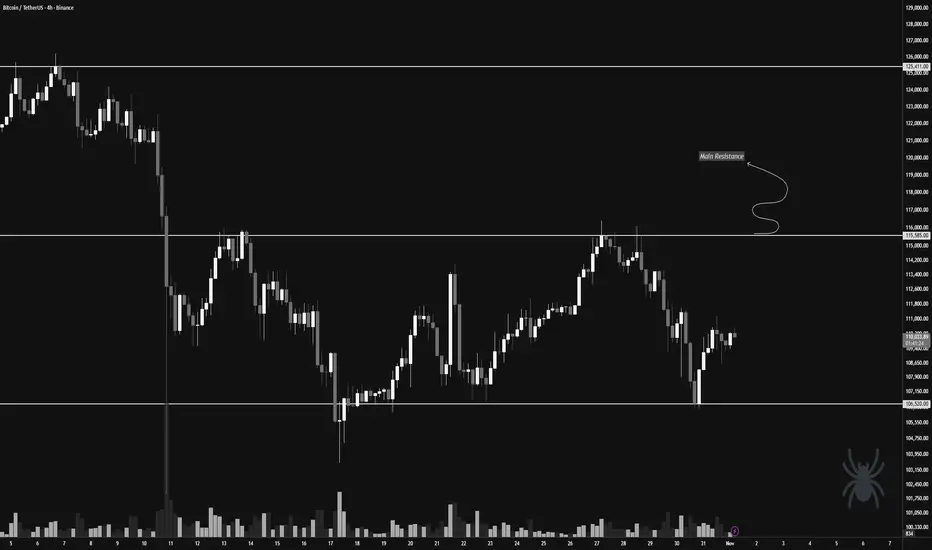
Has Bitcoin entered the distribution phase yet?👋🏻 Hey everyone! Hope you’re doing great! Welcome to SatoshiFrame channel.
✨ Today we’re diving into the 4-Hour Bitcoin analysis. Stay tuned and follow along!
👀 On the 4-hour timeframe, we can see that Bitcoin recently dropped due to the impact of the FOMC news but then rebounded from the key support level at $106,520 and is now facing its multi-timeframe resistances. Looking at the chart more broadly, we notice equal highs and lows around the $115,585 and $106,520 zones. With a breakout of either of these levels, Bitcoin could experience a sharp and significant move.
🧲 Bitcoin’s selling volume has slightly increased, and if the supports break, this selling could turn into pressure — collectively applying downward force on the market price. Then, buyers may re-enter and start buying Bitcoin again. The hypothesis of a possible distribution phase could turn into a valid theory; however, we must be cautious — if Bitcoin decides to move upward after Monday’s session, it could confirm a new all-time high and continue its upward trend.
✍️ The main scenario for Bitcoin lies around the $115,585 price zone. If this level breaks, we could enter a long position and stay with it for a potentially extended upward move. It’s worth noting that an increase in buying volume along this path could serve as a strong confirmation for our long position.
On the other hand, the short position scenario would become valid if the price breaks below the support and selling pressure intensifies, giving us a high-momentum short setup.
❤️ Disclaimer : This analysis is purely based on my personal opinion and I only trade if the stated triggers are activated .
Did you Know ?!!!Did you really think that profiting from the current bull run (a comprehensive upward market) would be easy? Don't be naive. Do you think they will let you buy, hold, and sell at low levels without any struggle? If it were that simple, everyone would be rich. But the truth is: 90% of you will lose. Why? Because the crypto market is not designed for everyone to win. They will shake you. They will make you doubt everything. They will panic you and sell at the worst possible moment. Do you know what happens next? The best players in this game buy when there is fear, not sell; because your panic gives them cheap assets. This is how the game goes: strong hands feed off weak hands. They exaggerate every dip, every correction, every sale. They make it look like the end of the world so that you abandon everything, and when the market starts up again, you'll sit there saying, "What the heck just happened?" This is not an accident. It's a system. The market rewards patience and punishes weak emotions. The big players already know your thoughts. They know exactly when and how to stir fear to make you give up. Because when you panic, they profit. They don't play the market. They play you. That's why most people never succeed. Because they fall into the same traps over and over again. People don't realize that dips, FUD (fear, uncertainty, doubt), and panic are all part of the plan. But the winners? They digest the noise. They know that fear is temporary, but smart decisions last forever. We've seen this hundreds of times. They pump the market after you sell. They take your assets, hold them, and sell them to you at the top, leaving you with nothing, wondering how it happened. Don't play their game. Play your own.
REMEMBER

"ETH - Time to buy again!" (Update)The ETH will increase $2K and reach to the top of the wedge in the coming weeks .
Best regards CobraVanguard.💚

TRX's situation+ Target PredictionFinally, the price broke the wedge, and the price experienced a significant drop. I think is the time for TR to rise again to 0.73 after more correction . STRONG SUPPORT 0.26.
Previous analysis
Give me some energy !!
✨We spend hours finding potential opportunities and writing useful ideas, we would be happy if you support us.
Best regards CobraVanguard.💚
_ _ _ _ __ _ _ _ _ _ _ _ _ _ _ _ _ _ _ _ _ _ _ _ _ _ _ _ _ _ _ _
✅Thank you, and for more ideas, hit ❤️Like❤️ and 🌟Follow🌟!
⚠️Things can change...
The markets are always changing and even with all these signals, the market changes tend to

OPEN 1D - Flag Ready for Takeoff?On the daily chart, Opendoor Technologies (OPEN) is forming a clean bullish flag - a consolidation phase following a massive +400% rally since spring 2025. Price action remains tightly contained within the pattern, with strong support from the MA50 and the 6.3–7.4 buy zone, aligning with the 0.618 Fibonacci retracement.
Technically , the setup looks mature: MA50 is trending upward, MA200 sits far below, and volume contraction hints at a breakout ahead. The first target sits at $16.50 (1.618 extension), while the second target lies at $25.60 (2.618 extension) - a potential +200% move from current levels.
Fundamentally, Opendoor is finally emerging from its downturn:
– +37% YoY growth in property transactions;
– operating costs reduced by ~25%;
– positive operating cash flow for the first time in three years;
– partnerships with Zillow and Redfin driving stronger customer acquisition.
With the U.S. housing market showing signs of recovery and potential Fed rate cuts on the horizon, OPEN stands out as a high-upside play in the proptech sector.
Tactical plan: watch for accumulation near 6.3–7.4, add on breakout confirmation. Profit targets: 16.5 → 25.6.
After all, in both trading and real estate - it’s all about timing and location.

Ethereum confirmation of breakout, downside targetEthereum confirmed a breakout below the 4050–4100 zone, completing the double top pattern. The price stays under the 50 and 100 EMA, showing continued bearish pressure. Priority remains on short positions during pullbacks.
Nearest downside targets: 3463 (Target 1) and 3007 (Target 2). A move above 4100 would cancel the bearish scenario.
Amid expectations of the Fed’s rate decision and rising bond yields, risk assets remain under pressure. Inflows to crypto funds are declining, increasing the downside risks for ETH. In the short term, correction may continue until new bullish catalysts appear.
ETHUSD remains in a bearish setup. Downside targets — 3460 and 3000. Long positions should be considered only after a confirmed move above 4100.

ETH/USDT: Price Decline Warning, Caution for Buy Opportunities!The ETH/USDT pair is currently facing clear downward pressure after failing to break through the strong resistance at 4,150.00. The 4-hour chart shows that Ethereum is moving in a short-term downtrend, with prices heading towards the important support level of 3,780.00. The strong rejection from this area indicates that the current market sentiment is leaning towards selling.
The market's cash flow also reflects short-term distribution, and the RSI indicator shows that ETH has previously entered overbought territory, and may continue to correct downward. These factors suggest that Ethereum could continue to face selling pressure, especially if the support levels are not strong enough to hold the price.
Impact of Recent News:
1. Australia's Core Inflation Data Rises Sharply: Australia's core inflation index increased by 1.0% in Q3, exceeding the forecast of 0.8%. This reduces expectations of a near-term rate cut and could affect ETH/USDT if the USD strengthens.
2. Expectations on U.S. Federal Reserve's Monetary Policy: The market expects the Fed to maintain high interest rates, which could strengthen the USD and put downward pressure on ETH/USDT.
Conclusion: Given the current downtrend and pressure from technical indicators, ETH/USDT is likely to continue decreasing over the next 48 hours. However, traders need to be cautious and closely monitor the support level at 3,780.00. If the price shows strong signs of recovery from here, it could present a good opportunity to enter the market.

How to Analyze Your Trading Performance ScientificallyBy Skeptic – Founder of Skeptic Lab
Most traders know how to analyze charts — but few know how to analyze themselves.
A professional trader doesn’t just look at last month’s profit or loss; they examine consistency , volatility , and long-term stability.
Earlier today, as part of my usual routine, I was reviewing my trading performance and reflecting on my recent results. That’s when I decided to share my analysis process with you :) — a framework built from personal study and research that might help others turn raw data into real improvement.
In this tutorial , we’ll walk through a data-driven framework to evaluate your trading performance like a portfolio manager — using metrics such as cumulative return, volatility, Sharpe ratio, and trend analysis.
1. Data Collection: Turning Trades into Monthly Returns
Instead of focusing on single trades, record your monthly returns in percentage terms.
It can look as simple as this:
This structure helps you see the bigger behavioral pattern behind your system — not just isolated results.
“If you can’t describe what you’re doing as a process, you don’t know what you’re doing.” – W. Edwards Deming
2. Cumulative Return: The Power of Compounding
Your total return isn’t the average of each month — it’s compounded over time:
This shows whether your trading system has truly grown across time, not just fluctuated.
A positive total means your system is resilient; a negative one signals structural issues.
3. Key Statistical Metrics
Once your data is ready, calculate the following metrics — the backbone of every professional performance review:
4. Coefficient of Variation (CV) – Stability Indicator
A CV below 1 implies your returns are stable and predictable.
Above 1.5 suggests your system’s risk-to-reward profile is unstable — and may need adjustment.
5. Sharpe-like Ratio – Measuring Efficiency
Assuming a zero risk-free rate, the Sharpe ratio measures how much return you generate per unit of volatility:
Sharpe > 0.5 → healthy performance
Sharpe > 1 → professional-level consistency
Sharpe < 0.3 → the system needs review
“It’s not about being right, it’s about being consistent.” – Mark Douglas
6. Trend Analysis – Detecting Growth or Decay
Run a simple linear regression between time (month number) and return.
Positive slope: system improving
Negative slope: decline in edge or discipline
Positive slope with high variance: profitable but unstable behavior
Combining this with the Sharpe ratio gives a complete health check of your strategy.
📝Summary Table
Data without action is noise.
Use these insights to correct weaknesses and scale strengths:
Identified Issue: High volatility
→ Practical Fix: Reduce position size in range-bound markets
Identified Issue: Consecutive drawdowns
→ Practical Fix: Add trailing stops or break-even adjustments
Identified Issue: Low average return
→ Practical Fix: Reassess position sizing or strategy fit
Identified Issue: Overconfidence after wins
→ Practical Fix: Apply daily or weekly risk caps
🧩 Final Thoughts
Analyzing your performance is not just about profits — it’s about understanding your patterns .
By measuring Sharpe, CV, and trend, you can answer three crucial questions:
Is my growth consistent or random?
Is my risk proportional to my return?
Can I replicate this performance?
If the answer is yes, you’re not just improving your system —
you’re evolving as a trader :)
🩵If you found this tutorial helpful, give it a boost and share it with your fellow traders. Let’s grow together, not alone!
Happy trading, and see you in the next tutorial ! 💪🔥
LULU 1D - stretching into a comebackOn the daily chart of Lululemon Athletica (LULU), a clean AB=CD pattern is forming, signaling a potential end to the correction and the beginning of a new upward wave. The price has tested the strong buy zone between 164–167, aligned with a major daily support level and rising volume - a classic setup indicating that buyers are regaining control.
Technically , the structure is highly symmetrical, RSI shows a bullish divergence, and the 50-day moving average is starting to turn upward - all suggesting a possible trend reversal. The first upside target for this pattern is $230, followed by a second target at $340, which corresponds to the 1.272 and 1.618 Fibonacci extensions.
From a fundamental standpoint, Lululemon remains a powerhouse in the premium activewear market, maintaining strong brand loyalty even amid competition from Nike and Alo. The company continues to expand its men’s line and footwear segment, which now accounts for over 25% of total revenue. International growth remains robust, with new stores opening in South Korea, the UAE, and Germany. Lululemon’s shift toward higher-margin online sales and more efficient logistics continues to strengthen its profitability.
In the latest quarterly report (September 2025), revenue grew by 9% year-over-year, and EPS came in above Wall Street expectations. High customer retention - over 90% repeat purchase rate - and stable gross margins create a solid foundation for a mid-term recovery in the stock.
Tactical plan: watch for entries within the 164–167 buy zone, consider partial profit-taking near $230, and target $340 if momentum extends. Just like in yoga, patience and balance lead to the best results.

ANET - Rebounds from EMA 50ANET - CURRENT PRICE : 148.00 - 149.00
Technical Rationale:
1. Rebound from Key Moving Average Support
The stock price has rebounded strongly from the 50-day EMA, which has acted as a dynamic support level throughout the uptrend. This rebound indicates renewed buying interest at a technically significant area.
2. Bullish Momentum Confirmation
ANET has crossed above the 20-day SMA, suggesting a short-term shift back to bullish momentum after a healthy pullback. This crossover reflects improving short-term trend strength.
3. Rising Support Line Intact
The long-term rising support trendline remains intact, confirming that the broader uptrend structure is well-maintained. Each corrective phase has so far been supported near this line, reinforcing the bullish bias.
4. Momentum Indicator (RSI)
The RSI is recovering from the mid-zone (~53), showing that bullish momentum is building again without being overbought. This supports the potential for further upside continuation.
ENTRY PRICE : 148.00 - 149.00
FIRST TARGET : 162.00
SECOND TARGET : 173.00
SUPPORT : 136.00

GOLD at breakout level? What's next ??#GOLD.. market just reached at his current breakout area that is around 3945 .
If market sustain below than we can expect further drop...
Good luck
Trade wisely

SOFI — Bullish Breakout with Strong VolumeSOFI has broken out to a new all-time high with strong volume, signaling strong buying pressure and renewed bullish momentum.
The stock remains in a clear uptrend, trading above the 50-day EMA. Recently, SOFI rebounded perfectly at the EMA 50, confirming it as a strong dynamic support zone. The bullish pennant pattern breakout further strengthens the case for a trend continuation.
The uptrend line is still intact, and as long as the price holds above the EMA 50, the bullish outlook remains valid.
Entry Price : 31.00 - 32.00
Stop Loss: Below EMA 50 (~26.80–26.90)
Targets: 35.00 and 38.00

INTC Target Hit, Now Showing Another Bullish Setup!INTC - CURRENT PRICE : 41.53
My earlier INTC buy call has reached its projected targets. The previous analysis is shared below for reference.
Technical Highlights
1) New 52-week High – Price has broken into a fresh yearly high, confirming strong bullish momentum.
2) Pennant Breakout – The breakout from a bullish pennant pattern suggests continuation of the prior uptrend, with a potential target of $49 based on the pattern projection.
3) Golden Cross Intact – The 50-day EMA remains above the 200-day EMA, maintaining the long-term bullish bias.
4) RSI in Bullish Territory – RSI remains above 70, indicating strong momentum and persistent buying strength.
ENTRY PRICE : 40.00 - 42.00
FIRST TARGET : 45.00
SECOND TARGET : 49.00
SUPPORT : 36.43 (the low of 23 OCTOBER 2025 candle)

DOGE's situation+next targets and expected movementsNo matter how bad Dogecoin looks on lower timeframes, the higher timeframes tell a different story—one of strength and potential. As you can see, the weekly chart has formed a large Cup and Handle pattern. If this pattern breaks out, the price could easily surge above $1. So be patient and stay alert, because you don’t want to miss the next bull run.
Unfortunately, the harsh truth is that 99% of you *will* miss it.

We will witness a powerful bullish rally !!After breaking out of the bullish wedge, the price has entered a phase of accumulation. This is a very strong signal on the weekly timeframe and could quickly lead to a price surge. I believe that after Christmas, we will witness a powerful bullish rally.

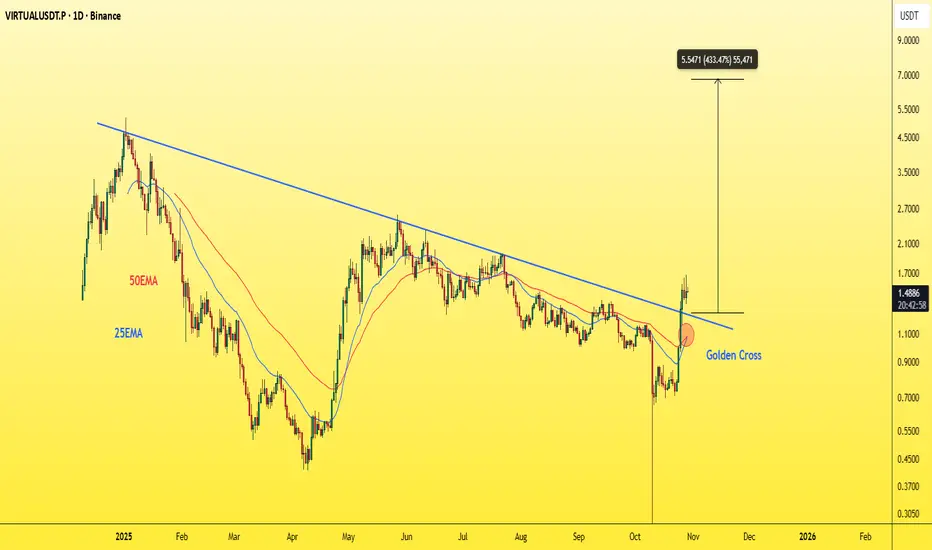
VIRTUAL - Extremely bullishKeep your eyes on it over the next period — it’s about to skyrocket.
It just broke a trendline it’s been trying to break for around 300 days,
and it’s also formed a golden cross on the daily chart.
Best Regards:
Ceciliones🎯
TAOUSDT - simple and clean chart!TAO has formed a triangle pattern and just broke out on the 4-hour chart.
Don’t expect a major correction here — it’s showing strong momentum.
It’s likely heading above $600 soon, so keep a close eye on it — you’ll see what I mean.
Best regards :
Ceciliones🎯

IQV - BUY ON DIPS IQV - CURRENT PRICE : 184.08
From May to July, IQVIA (IQV) staged a strong upward rally, supported by rising volume. Following this advance, the stock underwent a healthy retracement, consolidating recent gains without breaking its long-term uptrend. Take note that the up trendline is still intact.
Currently, price action shows signs of support around the Fibonacci 38.2% retracement level , coinciding with both the Ichimoku Cloud and the 50-day EMA . This confluence suggests the retracement phase may be complete, presenting a good opportunity to apply a Buy on Dips strategy as the stock prepares for its next upward leg.
ENTRY PRICE : 183.50 - 184.50
TARGET : 205.00 and 215.00
SUPPORT : 166.00

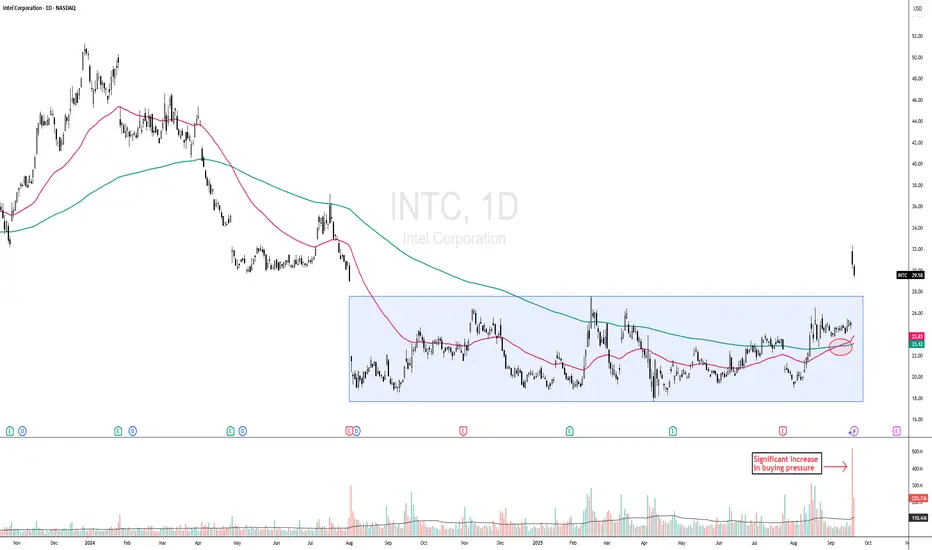
DOW THEORY PLAY - INTC CONFIRMS BREAKOUT FROM ACCUMULATION PHASEINTC - CURRENT PRICE : 29.58
Key Technical Highlights:
1. Breakout from Accumulation Phase with Strong Volume
Intel has successfully broken out of a prolonged sideways accumulation zone. The breakout is accompanied by significantly higher-than-average volume , indicating strong buying interest and institutional participation.
2. New 52-Week High Achieved
Price has breached the previous 52-week high, signaling bullish momentum and the potential start of a new price discovery phase. Historically, such breakouts often attract trend-following traders.
3. Golden Cross Formation (look at the red circle)
A Golden Cross has formed for the first time in a long period, where the 50-day EMA has crossed above the 200-day EMA — a classic long-term bullish confirmation. Notably, the last occurrence of this pattern was in July 2023 , making this the first reappearance in over two years, further reinforcing its significance as a potential turning point in market sentiment.
4. Dow Theory Alignment – Public Participation Phase
According to Dow Theory, this marks the second phase of a major uptrend — the Public Participation Phase — where broader market participants begin to enter following early accumulation by smart money. This phase typically sees strong price advances.
ENTRY PRICE : 28.00 - 30.00
FIRST TARGET : 35.00
SECOND TARGET : 42.00
SUPPORT : 25.00 (CUTLOSS below 25.00 on closing basis)
Note : This is related to point no 1. Markets have a tendency to "fall of their own weight." At bottoms, however, markets require a significant increase in buying pressure, reflected in greater volume, to launch a new bull market. A more technical way of looking at this difference is that a market can fall just from inertia. Lack of demand or buying interest on the part of traders is often enough to push a market lower; but a market does not go up on inertia. Prices only rise when demand exceeds supply and buyers are more aggressive than sellers.
TGT 1D - hitting the target?On the daily chart, Target Corporation (TGT) has finally broken out of its long downtrend and closed above the consolidation box. The setup suggests a potential bullish reversal with targets at $123 and $146.8.
Technically , the structure looks solid: a possible retest of the breakout zone could offer a great mid-term entry. Volume supports the move, and RSI is recovering from oversold levels.
On the fundamental side, Target is regaining investor confidence. The company is expanding its digital sales, strengthening brand partnerships, and improving supply-chain efficiency. Rising margins and better inventory management hint that profits may start to recover - just in time for the holiday season.
Tactical plan: as long as price holds above $94, bulls have control. The next target? Well… Target itself.
