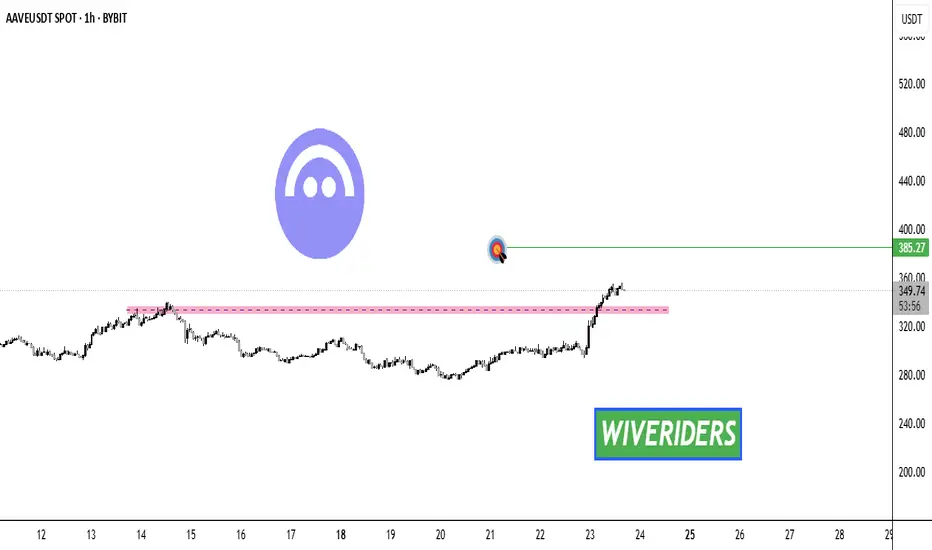
AAVE Breakout Alert! 🚨 CRYPTOCAP:AAVE Breakout Alert! 🚨
CRYPTOCAP:AAVE has broken out of the red resistance zone 🔴✅
The first target is the green line level 🎯
This breakout confirms bullish momentum and could drive further upside if buyers maintain control 💪
Tradingview
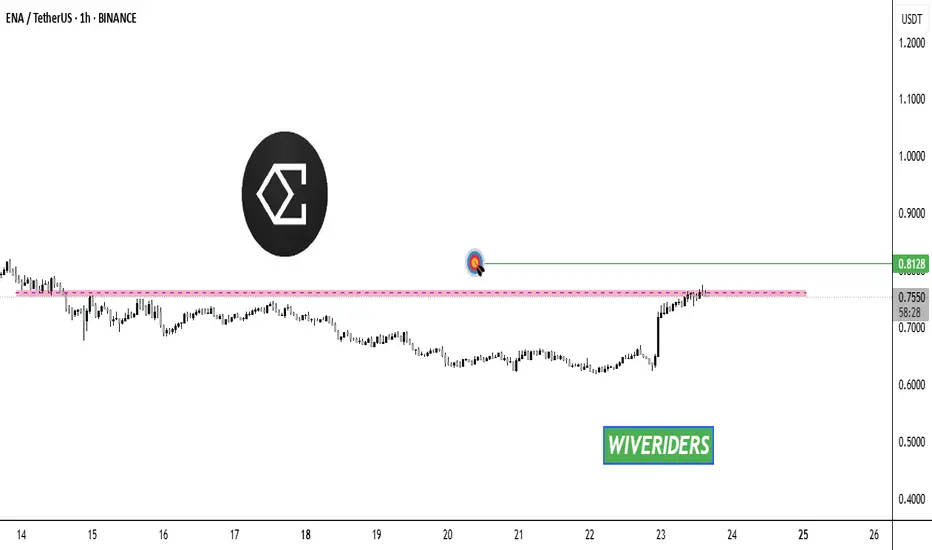
ENA Breakout Alert!🚨 MIL:ENA Breakout Alert! 🚨
MIL:ENA is currently testing the red resistance zone 🔴
If price breaks out, the first target will be the green line level 🎯
A confirmed breakout here would signal bullish continuation and could fuel further upside ✅
ARB Breakout Alert! 🚨 AMEX:ARB Breakout Alert! 🚨
AMEX:ARB is currently testing the red resistance zone 🔴
If price breaks out, the first target will be the green line level 🎯
A confirmed breakout here would signal bullish continuation and could push price higher ✅

GH 3D: breakout forming inside ascending channelThe price of GH continues consolidating within the top of an ascending channel, confirming bullish structure. The rectangular accumulation has lasted for over three months, with price staying above all major EMAs and MAs - a strong trend confirmation. On the last impulse, volume increased, and now the price is compressing again. A breakout with a retest would serve as a valid entry. First target lies near 61.38, second at 73.66, and third at 87.37 - aligned with the upper range of the medium-term Fibonacci extension. Fundamentally, GH remains a promising biotech pick amid sector rotation and potential Fed easing. EMAs and MAs sit below price, and D/A supports the breakout scenario. Waiting for confirmation before entering.

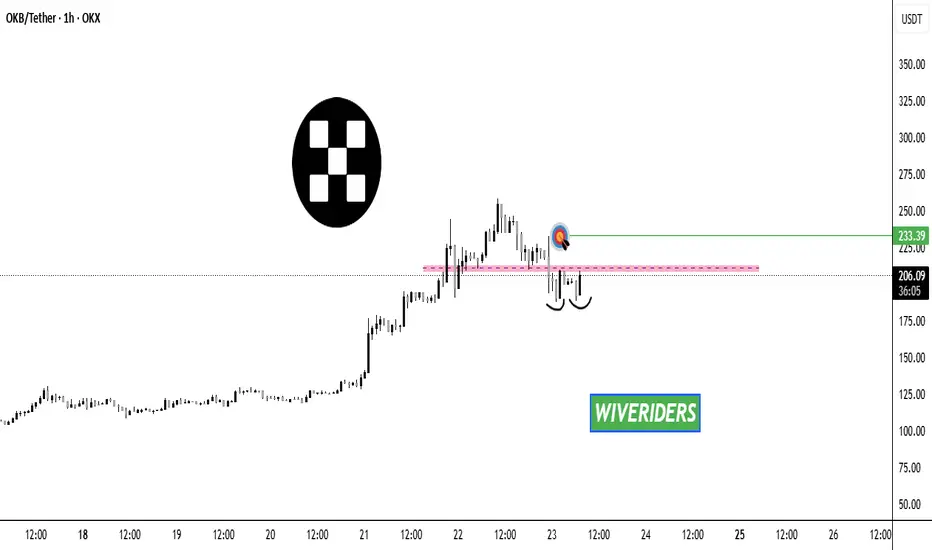
OKB Breakout Alert! 🚨 CRYPTOCAP:OKB Breakout Alert! 🚨
CRYPTOCAP:OKB is currently testing the red resistance zone 🔴
At the same time, price is showing a potential Double Bottom formation — a bullish reversal signal ✅
If price breaks out, the first target will be the green line level 🎯
This setup could confirm strong bullish continuation if buyers hold momentum.
ETC Breakout Alert!🚨 BME:ETC Breakout Alert! 🚨
BME:ETC is currently testing the red resistance zone 🔴
If price breaks out, the first target will be the green line level 🎯
A confirmed breakout here would signal bullish continuation and could push price higher ✅

SPX Breakout Alert!🚨 SPX Breakout Alert! 🚨
SP:SPX is currently testing the red resistance zone 🔴
If price breaks out, the first target will be the green line level 🎯
A confirmed breakout here would signal bullish continuation and could drive further upside ✅

TradeCityPro | Bitcoin Daily Analysis #160👋 Welcome to TradeCity Pro!
Let’s move on to analyzing Bitcoin. Today, Powell gave a speech that had a big impact on the market. Let’s see what the market will do next.
⏳ 4-Hour Timeframe
Today, Jerome Powell delivered his speech at the Jackson Hole event and spoke about U.S. Federal Reserve policies.
🔔 His comments were in favor of the crypto market, raising expectations for an interest rate cut, and this caused Bitcoin to move upward.
🔍 As you can see, the current 4-hour candle is a very large green candle, and the price was supported by the zone we had marked.
📊 The buying volume that entered Bitcoin is very high, and the probability that the price ranges after this candle is high.
⚡️ Considering that we are close to the weekend, this ranging could continue until the weekly candle closes.
🚀 However, at the same time as this bullish candle in Bitcoin, its dominance dropped and declined. For this reason, altcoins like Ethereum moved upward even more strongly than Bitcoin.
📈 If the upward movement continues, we can use a candle setup or RSI entering the Overbuy zone as a long trigger.
❌ Disclaimer ❌
Trading futures is highly risky and dangerous. If you're not an expert, these triggers may not be suitable for you. You should first learn risk and capital management. You can also use the educational content from this channel.
Finally, these triggers reflect my personal opinions on price action, and the market may move completely against this analysis. So, do your own research before opening any position.

BTC 4H Analysis – Key Triggers Ahead | Day 19💀 Hey , how's it going ? Come over here — Satoshi got something for you !
⏰ We’re analyzing BTC on the 4-hour timeframe timeframe .
👀 On the 4H timeframe of Bitcoin we observe that, after being rejected from the 115,000$ area, it is moving towards its support in the 112,000$ zone .
⚙️ We have two key areas on RSI: the support area around 30, where RSI is currently located, and the key zone for a trend change around 73, where volatility usually increases .
🕯 The size of the red candles has each time been larger than the green candles, showing stronger selling pressure .
💵 USDT.D on the 4H timeframe has resistance around the 4.46% area. If this area breaks, Bitcoin selling pressure will increase .Note that Tether dominance is close to its 4H top .
🔜 Today is the Jackson Hole event .
🔔 The alarm zone for a short position is at the 112,000$ level. If this level is lost and price action confirms, we can have a very low-risk trade. For a long position, breaking the 115,000$ area could be the start of a trend reversal .
❤️ Disclaimer : This analysis is purely based on my personal opinion and I only trade if the stated triggers are activated .

EURGBP - LongEURGBP Analysis - LONG 👆
In this Chart EURGBP H4 Timeframe: By Nii_Billions.
❤️This Chart is for EURGBP market analysis.
❤️Entry, SL, and Target is based off our Strategy.
This chart analysis uses multiple timeframes to analyze the market and to help see the bigger picture on the charts.
The strategy uses technical and fundamental factors, and market sentiment to predict a BULLISH trend in EURGBP, with well-defined entry, stop loss, and take profit levels for risk management.
🟢This idea is purely for educational purposes.🟢
❤️Please, support our work with like & comment!❤️

SPY WEEKLY LIVE RECORDED 21st AUG 2025This is the price action of SPY. I have clearly discussed the levels where charts are showing us the probability of buying levels.
If you have any doubts, feel free to leave a comment or DM me.
NOTE:FORGET ABOUT TRADING & FOCUS ON PROTECTING YOUR CAPITAL

XAGUSD - ShortXAGUSD – SELL Setup
📊 H1 Timeframe Analysis by Nii_Billions
🔹 Outlook: BEARISH
Using multiple timeframe confirmation for direction.
Strategy blends technicals, fundamentals, and sentiment.
Entry, SL, and TP structured with risk management in mind.
🟢 Educational purposes only 🟢
❤️ Like & comment if this helps your trading journey.
👉 Follow for more swing trade ideas.

GBP/USD – VSA Signals Supply Emerging at 4H Resistance💡 Idea:
GBP/USD recently tested the 1.37–1.3750 resistance zone and showed clear supply signals in VSA terms. The price is rolling over with wide down-bars on increasing volume, confirming professional selling pressure. The pair is likely entering a markdown phase toward deeper 4H support levels.
📍 Trade Setup
Entry: 1.3470–1.3500 (pullback into broken support / minor supply test)
Stop Loss: 1.3575 (above last supply zone)
Target 1: 1.3340 (next 4H support)
Target 2: 1.3180 (major 4H support base)
R:R Ratio: ~1:3
📊 VSA & Technical Reasoning
Supply Bar at Resistance
At 1.37+, wide spread down-bars closed near the lows on ultra-high volume → classical VSA supply bar, confirming professional selling.
Upthrust / Trap Move
The wick above resistance acted as an Upthrust, luring breakout buyers before reversing sharply — a typical Wyckoff distribution signature.
No Demand Rally
Recent small up-bars into resistance came with narrow spread + low volume, showing lack of demand and confirming sellers are in control.
Lower Highs + Breakdown
Market structure has shifted into a downtrend sequence (lower highs & lower lows) aligning with VSA weakness.
Volume Confirmation
Volume on down-bars remains elevated vs. up-bars, validating that supply > demand. This suggests further downside continuation.
📌 Trading Plan
Look to short retracements into 1.3470–1.3500.
Expect price to break 1.34 support on increased supply.
Trail stop aggressively once 1.3340 is tested, targeting 1.3180 as the larger markdown objective.

TradeCityPro | Bitcoin Daily Analysis #159👋 Welcome to TradeCity Pro!
Let’s dive into the Bitcoin analysis. Today, Bitcoin is sitting right on a very important support level. Let’s see what could happen in the market.
⏳ 4-Hour Timeframe
Today, I removed the old range we had on Bitcoin and added a support zone around 112000.
✔️ The reason for removing the old range was that the price had broken through it several times, both from above and below, so it could no longer be considered a Maker Buyer or Maker Seller zone.
🔔 The new zone I drew is a very strong support, and right now the price is fluctuating inside it.
✨ The 114790 trigger is a good entry signal for a long position, confirming that the price has been supported by the Maker Buyer zone. The important resistance levels above are at 116829 and 119096.
💥 If the 112233 level breaks, a sharp bearish leg could occur. But in my view, it is unlikely to happen today. If it does, it will probably come after Powell’s speech tomorrow.
🧩 Breaking the 30 level on RSI is still the momentum trigger for Bitcoin. If it enters the oversold zone, Bitcoin’s momentum will turn bearish, and the RSI could move down toward 24.60.
🔍 For today and tomorrow, I prefer not to open any new positions and wait until Powell’s speech at the Jackson Hole event to see when the market chooses its direction.
❌ Disclaimer ❌
Trading futures is highly risky and dangerous. If you're not an expert, these triggers may not be suitable for you. You should first learn risk and capital management. You can also use the educational content from this channel.
Finally, these triggers reflect my personal opinions on price action, and the market may move completely against this analysis. So, do your own research before opening any position.

BTC 1H Analysis – Key Triggers Ahead | Day 18💀 Hey , how's it going ? Come over here — Satoshi got something for you !
⏰ We’re analyzing BTC on the 1-hour timeframe timeframe .
👀 On the 1-hour timeframe of Bitcoin, we can see that after hitting the $115,000 zone, it got rejected with a relatively strong red candle and is now moving toward its support at $112,700 .
⚙️ We have two key zones in the RSI : the support zone at 30 , and the resistance zone for long positions at 59.67. Breaking these levels can push Bitcoin toward its alarm zone and sensitive price area for a breakout .
🕯 The size of the red candles is getting smaller , showing reduced selling pressure , while the green reversal candles from $112,700 are closing larger and stronger than before .
💵 USDT.D on the 1-hour timeframe is moving toward its resistance at 4.46% , but the trend is weakening and the size of the buying candles is shrinking . In previous attempts to reach this zone, it faced rejection . If the 4.36% support level is lost , strong inflows could move into Bitcoin .
🔔 Our trading alarm zones are at $115,000 and $112,700 . These zones usually break with increased volume and volatility , and by watching price behavior there , we can find the best trading opportunities .
❤️ Disclaimer : This analysis is purely based on my personal opinion and I only trade if the stated triggers are activated .

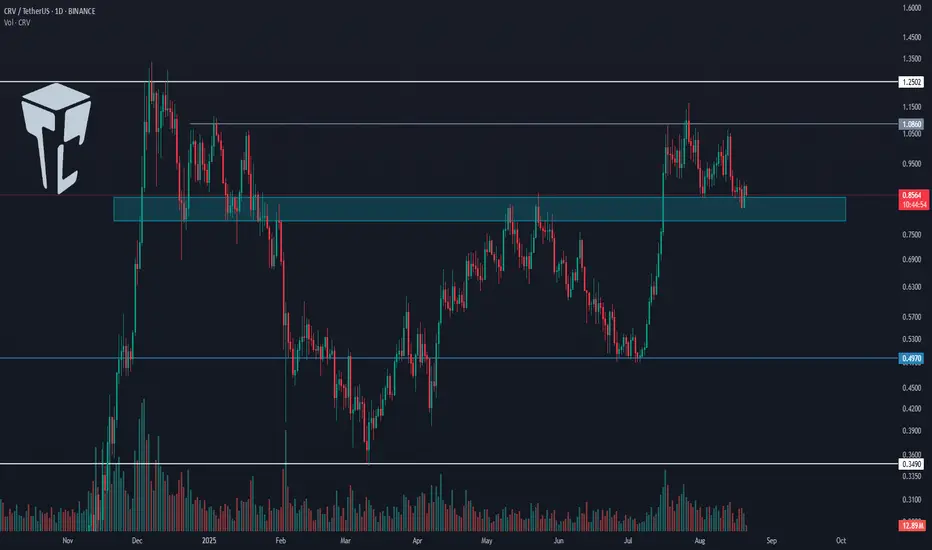
TradeCityPro | CRV: Key Support Test in DeFi Token👋 Welcome to TradeCity Pro!
In this analysis, I want to review the CRV coin for you. It is one of the DeFi projects under Ethereum with a market cap of 1.17 billion dollars, currently ranked 72 on CoinMarketCap.
📅 Daily Timeframe
In the daily timeframe, CRV has a very important support zone, and right now the price is trading near this area.
✔️ The overall trend of CRV can currently be considered bullish because the main highs and lows it has formed are higher highs and higher lows, and at the moment, the price is in the corrective phase of this trend.
⚡️ If the support zone is broken, this corrective phase will deepen, and the price could move toward lower levels. The main supports for this coin in the daily timeframe are 0.497 and 0.349.
💥 Considering the ongoing bullish trend, long positions are currently more logical. If CRV gets supported at this zone, we can look for triggers in lower timeframes to open positions.
📈 The main triggers for long positions on this coin are the breakouts of 1.086 and 1.2502.
📝 Final Thoughts
Stay calm, trade wisely, and let's capture the market's best opportunities!
This analysis reflects our opinions and is not financial advice.
Share your thoughts in the comments, and don’t forget to share this analysis with your friends! ❤️
USDCAD ~ Cheapy Choapa? IDKThe triple top resistance is found on the USDCAD weekly chart!
What we may expect with it is a high-quality downtrend.
But for the reason "This chart is so beautiful," here I have to say,
We need to be careful about this position UNTIL confirmation on sell.
Nika.

Teva long positionTeva looks like a student who failed an exam and now desperately tries to cover the gaps literally, the gap around 21.4.
On the chart we see a clear breakout of the descending channel followed by a neat retest from above, suggesting the stock is ready to get back into a long-term uptrend.
Volumes in the 17–17.5 zone act like a safety cushion, preventing the price from dropping too sharply.
Technically the next target is gap closure in the 21–22 area, which may unlock the path to higher levels.
From the fundamental side, Teva also has some cards to play: the pharmaceutical sector remains in focus due to rising demand for medicines and biotech solutions, and the company has been cleaning up its balance sheet while expanding new business lines. Altogether, both technicals and fundamentals point in the same direction , buyers are not ready to give up just yet.

GOLD - high placed? What's next??#GOLD.. .market placed a very reasonable high so far that is around 3347-50
Keep close that region and holding of that region means again dip expected.
NOTE: we will go for cut n reverse above 3350 on confirmation .
Good luck
Trade wisley

TRON "THE CLEAR COIN".* In this video, I'm talking about the price movement of the Tron coin.
* Making the main focus on how few little drops this coin is making. With percentages.
* Talking about Tron VS Ripple and other cryptocurrencies.
Enjoy your Tron's and don't forget it's a special coin and one of the leader in the crypto world.

XRPUSD continues to declineXRPUSD continues to decline
XRPUSD has been trading within a descending channel since August 11. The asset trades below the SMA200 on hourly timeframe, breaking through and then retesting the support levels. Currently, the price trades below the SMA50 and has recently retested the former 3.00000 support level. MACD on 1- h timeframe has crossed into the red zone. The further decline towards 2.72000 is expected.

GOLD 4H - all eyes on 3350, death cross at workThe technical picture on gold strengthens the bearish case: on the 4H chart, a death cross (MA50 crossing MA200 downward) has formed, signaling short-term pressure from sellers. The key sell zone is 3350, where the 0.618 Fibonacci, descending trendline, and volume cluster converge. From here, a downward move is expected with first targets at 3311, then 3285, and extended potential towards 3270 (127.2–161.8 Fibo). Volume confirms declining buyer interest near local highs, while RSI shows reversal divergence, adding weight to the bearish scenario.
Fundamentally , gold is under pressure as the market factors in the possibility of more aggressive Fed actions if inflation risks persist. At the same time, safe-haven demand is weakening due to DXY stabilization. Geopolitics is not providing immediate triggers for gold hedging, which also cools investor interest.
Tactical plan: if 3350 acts as resistance, it opens an attractive short opportunity toward the mentioned targets. However, if price breaks and consolidates above 3350, the scenario must be reassessed as stop-hunting will begin.
Ironically, gold - the eternal store of value - acts like a teenager again: offended at 3350 and ready for a tantrum downwards.

ETHUSD tries to develop another bullish impulseETHUSD tries to develop another bullish impulse
Fed Governor on DeFi: At the Wyoming Blockchain Symposium on August 20, Fed Governor Christopher Waller called DeFi and crypto payments "nothing to be afraid of," pushing for payment infrastructure collaboration. His pro-crypto stance, as a potential Fed chair, gains traction. Lummis on Crypto Bill: Senator Cynthia Lummis said the CLARITY Act, House-approved in July, could reach Trump by year-end with Senate tweaks, aiming for 2026 rollout. China’s Yuan-Backed Stablecoins: China may allow yuan-backed stablecoins to boost global use, reversing its 2021 ban. A late August roadmap review targets cross-border trade, with Hong Kong and Shanghai as hubs, to be discussed at the SCO Summit.
Technically, ETHUSD trades above the EMA20, trying to hold above this moving average. The MACD is in the green zone. The price may pullback towards 4,200.00 with a further bullish impulse towards 4,600.00 level.
