$BTC Breakout $108k soonCRYPTOCAP:BTC is showing strength after bouncing from the $105K support zone.
It’s now trying to break above $108.5K.
If that happens, the next target could be around $111K–$112K.
The trend looks positive with growing momentum, but if BTC drops below $105K, this move could fail.
For now, bulls are in control.
Let’s see if they can keep it going.
DYRO, NFA
Trednline

GOLD (XAU/USD) 4H Update GOLD (XAU/USD) 4H Update
Price is holding strong above the $3,250, $3,280 demand zone with trendline support intact.
A pullback into this area could trigger the next leg up toward $3,498.
Structure remains bullish unless this zone breaks.
Watching for a bounce Target: $3,499
DYRO, NFA

Gold Prices Drop Sharply After Peaking – Will Recovery Return?Hello everyone,
Today, November 1, 2024, the global gold price has unexpectedly reversed sharply from an all-time high and is currently trading around 2,745 USD/ounce.
The main reason for this decline is the release of U.S. economic data indicating signs of stability and recovery. This diminishes the appeal of gold as a safe-haven asset, while U.S. government bond yields rise and the U.S. dollar continues to strengthen.
In the short term, gold prices may remain under pressure if U.S. economic data continues to improve, especially if employment and inflation reports show a positive outlook. However, other risk factors such as geopolitical conflicts or global financial instability could support gold prices. If signs emerge that the Federal Reserve (Fed) will slow the pace of monetary tightening, this could provide momentum for gold prices to rise again.

JASMY is ready for 200-300% short term pump!!Hi dear community and my loyal followers, as you see my RAD pumped more than 200% which I posted earlier. Now I think it's Jasmy's turn to melt faces. As you see I expect this Inverse H&S pattern to play out after breaking major trendline and pump 200-300% with huge green dildo candle. DOn't be surprised if Jasmy jumps 100-150% in a single day. BTW past 3-4 months interest in Jasmy has been increased which proves buying volume.

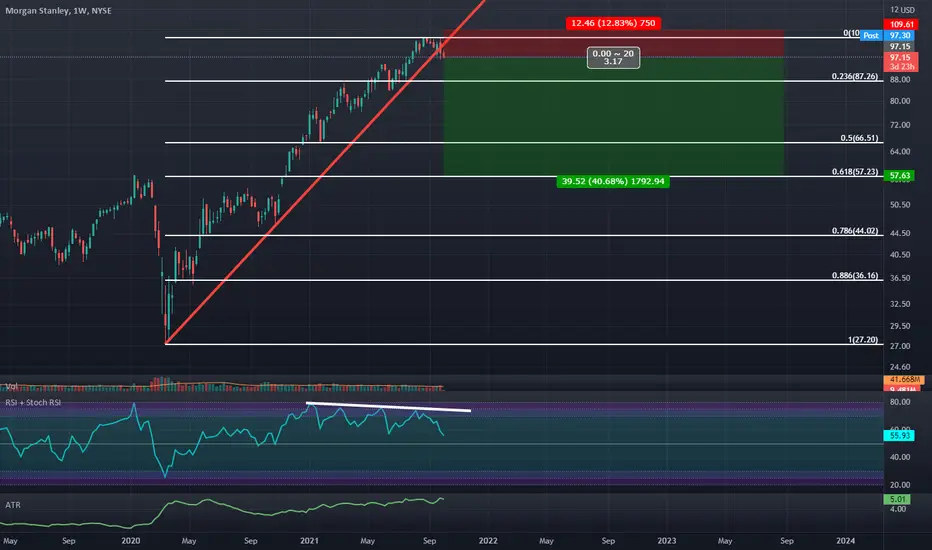
Dark Cloud Cover Visible on Weekly in Morgan StanleyWe have a confirmed Weekly Dark Cloud Cover with 4 instances of Weekly Bearish Divergence and we are breaking down an up trending line I think it wouldn't be so crazy to bearishly target a 50-61.8% retracement from here.
VNINDEX - 1D - DROPHello all my subscribers. Today, I will express my idea about VNINDEX movement in next couple of weeks.
1. General: Price is still in downward trend line with lower following tops (red arrow). Bull also try to get their dominance but unsuccessful with lower following bottoms. Bear completely controls the market, proved by downward's slope. That is just basic analyst, it is not strong enough for making conclusion for a strong reduction movement. Therefore, I want to consider additional indicators.
2. Trend line: from 17 May 2022 to current time, bull tried to show its resistance but last effort was destroyed by "big red candle stick" at 06 July 2022. Many blind traders say that " JUST BEAR TRAP". This is a baseless perspective. My following analyst will prove that this is not bear trap.
3. Candle stick pattern: at 15 July 2022, VNINDEX closed with inverted hammer. Beside, this candle stick just touched downward trend line and created long candle beard. The high probability that this is third lower top.
4. RSI: this is my favorite indicator, it always give me reliable signals about current fluctuation. Now, RSI is, moving 50 as proof that market is still in bear.
5. MACD: it shows us some positive considerations such as MACD line cut Signal line or histogram's slope is moving up. But it is not strong enough for reversal movement.
Conclusion:
There are two material considerations in my analyst, price broke down upward trend line and RSI is now under 50. In short-term, price also can make a small pull-back and create "dead cat bounce". Because of these reasons, I recommend that we should wait for VNINDEX reaches 946 for making next decision.
Finally, I will show you same movement in the past. Please pay your attention to my drawing range box. Price broke down upward trend line created from 28 Jan 2021. At the same time, RSI was under 50. After that, price tried to make stretched movement but finally, a super strong reduction movement happen, from 1536 to 1170.
These are all my considerations for VNINDEX. I hope that it will be useful for all of you.
Feel free leave your feedbacks and questions.

Very Important Trendline formation in BankNiftyBankNifty is taking resistance of trendline 4th time today, draw trendline on your charts for as an important level.
Disclaimer:
I am not SEBI registered analyst.
My studies are for educational purpose only.
Please Consult your financial advisor before trading or investing.
I am not responsible for any kinds of your profits and your losses.

Short /NGSell NatGas up here - 13 year trendline tag on daily. Short via futures or long $KOLD
Natural Gas has a strong seasonality - and May is only 2 weeks away.
Look how insanely clean the tag was on the 1hr chart.

EURUSD!!!! "LONG"The price also hit a daily level after hitting the floor of the daily downtrend channel and tried to return and break the 4-hour time levels.

Another Bullish Angle of AUD/CADThe AUD/CAD has been continuing its new bullish phase , following the moving averages indicators, the price is currently above the 200, 50 and 21-day MA (Blue, Black and Purple line).
And this reveals a strong trend in the market. The 50-day SMA is about to cross over the 200-day SMA which means the price is Golden for the Buyers. The bull started with a very strong momentum since the 18th in driving the price upwardly, but they have 0.9300 psychology level to deal with before the bullish movement could be ascertain on a long term and probably moving towards the 0.9400 as the next mark.
That said, any break below the 0.9240 might result to the bears taking over the market and driving the price lower.

Time To Go Down To The Oversold Zones On The RSI: Trend BrokenTRX has just broken trend and looks to want to get to oversold on the RSI, The quickest and easiest way to do that would be for it to dump from here put your stop 1-2ATRs above entry

us30 analysihello evreyone if you like m yide don t forget the support.is great time to buy us 30 and us 100 and us 500 after break the triedline and the ham

After correction, will the trend line continue?My chart shows that it is capable of breaking new highs in a month.


SPY Trying to Confirm Inverse HnSIf you trade with us then you knew this was coming and you were ready. Here we can see inverse HnS being tested. If that gap fills at 328 we can confirming a double top.


CENTURYTEX LOOKS BULLISH NSE:CENTURYTEX
Build your long and short positions accordingly.
CENTURYTEX
————————
Buy Above: 366
Target: 368,370,372,375,378
SL: 362
Trade with Proper Risk Management.
Victory is beyond fear!!
Disclaimer: I am not a SEBI Registered Analyst. Please take position after consulting your advisor.


Petronet - Bullish View - Expecting price will come to 315Petronet - Bullish View - Expecting price will come to 315

UOB 50 - 200 SMA Death Cross?www.tradingview.com
UOB Weekly Chart:
1. 50 Day SMA / 200 Day SMA death cross imminent?
2. Further decrease in Chaikin Money Flow from -0.20 to -0.28 from May to June
3. Thin volume on 2nd June breakout above $20
4. Consecutive gravestone dojis on 3rd and 4th weeks of March. Although shadow length is rather small.

MC DOWELL - At multiple support levelsMcdowell at multple support levels.
if it holds 550 levels, it is most likely to bounvce back towards 600 levels

EURUSD On Down Slide Path.EURUSD is trading in a falling wedge pattern in a bigger trend, within the falling wedge, it is also trading in channel pattern. We might see more downside in EURUSD from the current level. As we can see, the falling wedge resistance line and parallel channel resistance line overlap each other, so there is strong resistance for upside in EURUSD. We might see downside towards the support line, as we can see in the chart.
If You Like Idea Do Follow/Comment/Like For More Quick Updates.
Note - Trade With Proper Risk Management System.
Thanks

Short EUStructure: downtrend
Price breaks trendline to confirm continuing down
Expect: targets are in the image
