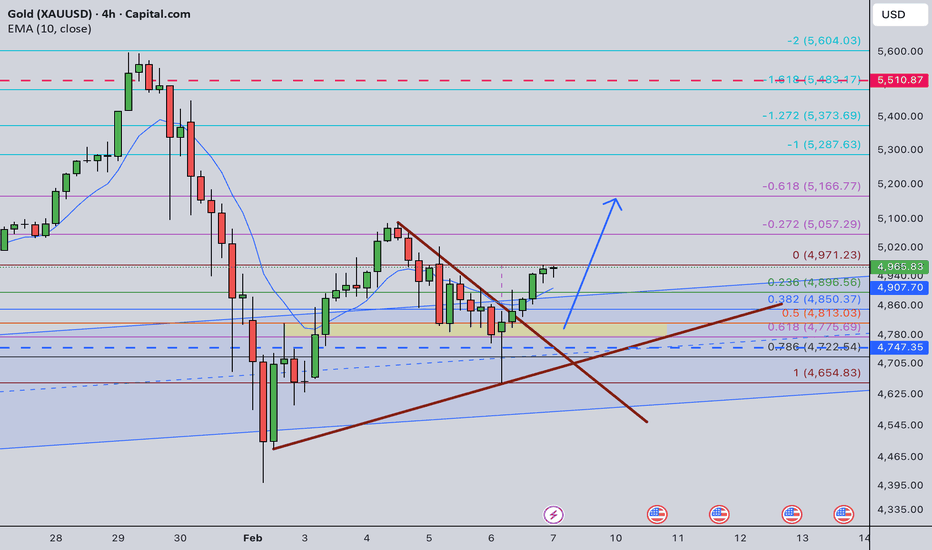
ElDoradoFx - GOLD ANALYSIS (09/02/2026, ASIA SESSION)
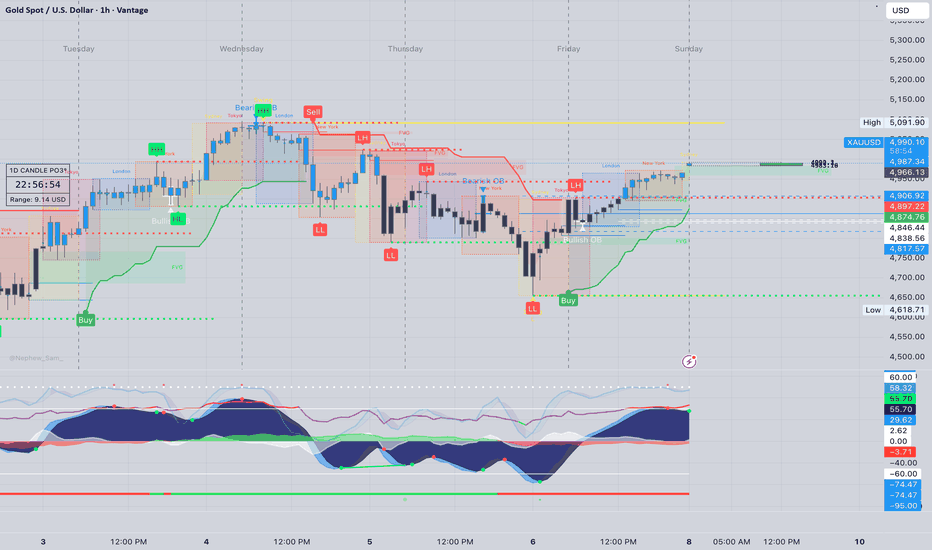
Gold is currently trading around $4,966 after sweeping intraday liquidity and reacting from the 1H supply zone near $4,970. Structure on the 1H shows a strong bullish recovery from the $4,655 swing low, with price now compressing just below resistance.
Asia session is consolidating under the highs, building liquidity for a potential London breakout or deeper pullback into higher-timeframe demand.
As long as price holds above the $4,940–$4,890 1H golden zone, bullish intraday structure remains intact.
⸻
📊 Technical Outlook (D1, H1, 15M–5M)
🔹 D1
• Macro trend remains bullish
• Price holding above daily EMA cluster
• Recent correction looks corrective, not structural
• Expansion potential remains toward 5,000+ zone
🔹 H1
• Clear impulse from 4,655 swing low
• Rejection from 4,970 supply
• 1H golden zone acting as key demand
• Liquidity resting above 4,970
🔹 15M–5M
• Tight consolidation under resistance
• No confirmed bearish BOS
• Compression suggests breakout setup
• Asia likely to fake one side before London
⸻
✨ Fibonacci Golden Zones (1H Swing)
(Based only on chart swing: 4,655 → 4,970)
1️⃣ BUY Swing: 4,655 → 4,970
• 38.2% = 4,940
• 50% = 4,915
• 61.8% = 4,890
🟩 BUY Golden Zone: 4,940 – 4,890
2️⃣ SELL Reaction Swing: 4,970 → 4,940
• 38.2% = 4,950
• 50% = 4,955
• 61.8% = 4,960
🟥 SELL Reaction Zone: 4,950 – 4,960
⸻
🎯 High Probability Zones
📈 BUY Scenario (Main Bias)
Buy Zone: 4,940 – 4,890
🎯 Targets → 4,970 → 5,000 → 5,030
🛑 SL: Below 4,870
⚡️ Confirmation:
• Sweep into zone
• 5M bullish BOS
• Strong rejection wicks
—————————
📈 BUY Breakout Setup
Trigger: Break & hold above 4,970
Retest: 4,960–4,965
🎯 Targets → 5,000 → 5,030 → 5,060
🛑 SL: Below 4,940
—————————
📉 SELL Scenario (Countertrend Only)
Sell Zone: 4,950 – 4,960
🎯 Targets → 4,940 → 4,915 → 4,890
🛑 SL: Above 4,975
⚠️ Only valid with clear bearish BOS
—————————
📉 SELL Breakout Setup
Trigger: Break & close below 4,890
Retest: 4,900 fail
🎯 Targets → 4,870 → 4,840 → 4,800
🛑 SL: Above 4,940
⸻
📰 Fundamental Watch
• Asia liquidity thin → fakeouts likely
• London session expected to drive expansion
• Dollar flows neutral pre-London
• Momentum favors dip buying
⸻
📌 Key Levels
Resistance: 4,960 / 4,970 / 5,000 / 5,030
Support: 4,940 / 4,915 / 4,890 / 4,870
Break-Buy Trigger → > 4,970
Break-Sell Trigger → < 4,890
⸻
📌 Summary
Gold remains intraday bullish while trading near $4,966 under the 4,970 resistance. The highest-probability plays come from pullbacks into the 4,940–4,890 1H golden zone. Only sustained acceptance below 4,890 would shift momentum toward a deeper correction.
Trend-defining level: 4,940
—
🥇 ElDoradoFx PREMIUM 3.0 – PERFORMANCE 06/02/2026 🥇
⚡️ Clean execution. Perfect accuracy.
📈 BUY +190 PIPS
📈 BUY +170 PIPS
📈 BUY +80 PIPS
🚀 BUY +340 PIPS
📈 BUY +70 PIPS
━━━━━━━━━━━━━━━
💰 TOTAL PIPS GAIN: +850 PIPS
🎯 5 Signals → 5 Wins
🔥 Accuracy: 100%
━━━━━━━━━━━━━━━
✅ Flawless trading day — precise entries and strong momentum delivered a perfect score.
— ElDoradoFx PREMIUM 3.0 Team 🚀
Trend Analysis
USDJPY 1h | Cyclical Compression Within Rising StructurePrice continues to advance within a rising channel while exhibiting a recurring intraday cycle of approximately 44 bars. Prior cycle troughs have aligned with local pullbacks, followed by resumed expansion toward the upper boundary of structure.
Recent price action shows compression near the upper channel region, with momentum oscillating rather than accelerating. This reflects phase deceleration rather than trend failure.
The projected path illustrates potential structural oscillation if cycle rhythm persists, not a directional forecast.
This chart documents observed recurrence, phase interaction, and structural containment.
Time governs opportunity.
Price responds conditionally.
Gold ABC Correction | Wave C to 3,652 $ if B Stays Below 0.618📊 Current Structure
Gold is developing a classic ABC correction on the 4H chart:
•Wave A: Completed (initial drop) ✅
•Wave B: Currently at peak retracement testing 0.618 Fibonacci (~5,100)
•Wave C: Projected target 3,652 USD
Wave B has an internal W-X-Y corrective structure and is now testing critical Fibonacci resistance levels.
🎯 Main Scenario: Wave C Projection (CONDITIONAL)
IF Wave B stays below 0.618 Fibonacci (~5,100):
•Target (Wave C): 3,652 USD
•Projected move: -1,386 points (~-28%)
•Key level: Price must reject at or below 0.618 for this scenario
⚠️ Alternative Scenarios
1.If 0.618 breaks → Wave B extends to 0.764 (~5,300) or 0.854 (~5,400)
2.If price breaks above 0.854 → Wave B invalidated, ABC structure fails (potential new bullish leg)
🔒 Risk Management
Conditional setup: Wave C is valid ONLY if 0.618 holds. Monitor price action at 5,100 closely. If broken, reassess for extended Wave B scenario.
📉 Not financial advice. Trade at your own risk.
Tem Top-Down Chart Walkthrough | From Market Structure to EntryIn this video, I walk step-by-step through the Tem chart using a simple top-down trading process designed for beginners and developing traders.
We begin by clearing the chart to remove noise, then move through the higher timeframes, monthly, weekly, and daily — to identify meaningful support and resistance levels.
Gold Correction – Tactical Range TradingGold is correcting but structural resistance remains heavy. I'm watching the channel top for a low-risk short setup. For those playing it safe, the move from the range floor to the median/top offers a higher-probability conservative long. No new ATH expected in the immediate term.
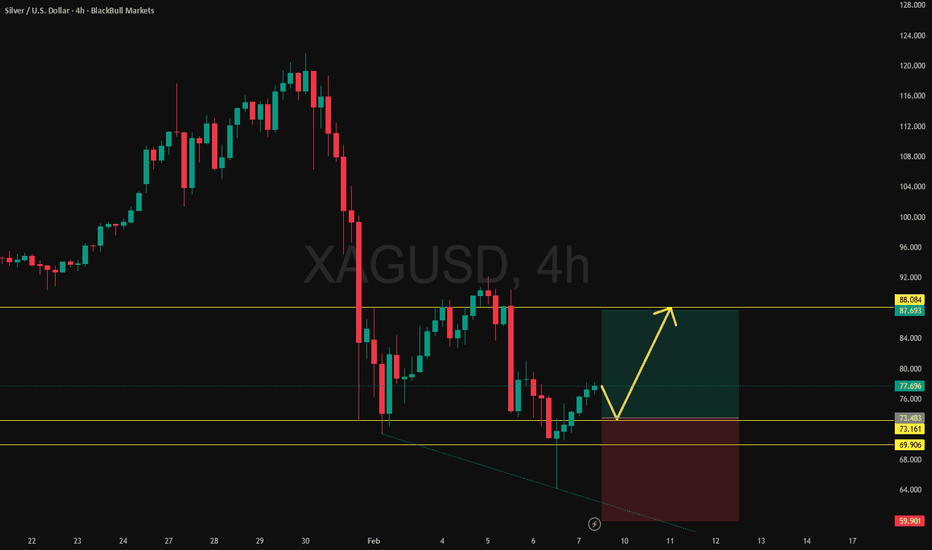
Silver: Range Liquidity Sweep & RetestXAGUSD remains range-bound. I'm anticipating a breakdown to the range floor to sweep liquidity before a rotation back to the short-term top. This is a conservative 1:1 RR play with stops positioned below recent lows to account for a potential trendline retest. Expect sideways action unless a major catalyst shifts the structure.
Silver MCX Mega - Intraday Tehchnical Analysis - 9th Feb., 26MCX:SILVER1!
SILVER Futures — Chart Pathik Intraday Levels for 09-Feb-2026 - 04:16 AM
(If these levels add value to your trades, a quick boost or comment goes a long way in supporting this free content and keeping our trading community thriving!)
Silver MCX is trading around 95,500 after bounce from recent lows near 94,000, consolidating near key resistance at 96,000 with bullish structure from support defense. Each comment or share builds the momentum for disciplined, structured analysis across our trading community!
Bullish Structure:
Longs activate above 96,000 (Long Entry), with confirmation as price sustains above this prior high and defends 95,200 support zone.
Targets: 96,500 (major booking zone), 97,000 (extended move on breakout)
Control: Stop or trail near 95,200 or 95,000 to manage risk
Bearish Structure:
Shorts open below 95,200 or on rejection at 96,000 after failed upside attempts.
Targets: 94,800 (partial/scalp), 94,400 (extended move if breakdown holds)
Control: Fast short covers required above 96,000 or on sharp reversals
Neutral Zone:
96,000 is today's inflection—practice patience until a strong direction emerges above or below this level.
Every setup is designed for structure, plan, and logic—let the chart work for you, not your emotions.
Boost or comment if these levels help your preparation—help Chart Pathik keep delivering quality analysis to more intraday traders!
Gold MCX Future - Intraday Technical Analysis - 9 Feb., 26MCX:GOLD1!
GOLD Futures — Chart Pathik Intraday Levels for 09-Feb-2026 - 04:08 AM
(If these levels add value to your trades, a quick boost or comment goes a long way in supporting this free content and keeping our trading community thriving!)
Gold MCX is trading around 75,500 after consolidation from recent highs near 76,000, testing key resistance at 75,800 with mild bullish bias from support holds. Each comment or share builds the momentum for disciplined, structured analysis across our trading community!
Bullish Structure:
Longs activate above 75,800 (Add Long Entry), with confirmation as price sustains above this level and defends 75,500 support zone.
Targets: 76,000 (major booking zone), 76,200 (extended move on breakout)
Control: Stop or trail near 75,500 or 75,300 to manage risk
Bearish Structure:
Shorts open below 75,500 or on rejection at 75,800 after failed upside attempts.
Targets: 75,200 (partial/scalp), 74,900 (extended move if breakdown holds)
Control: Fast short covers required above 75,800 or on sharp reversals
Neutral Zone:
75,800 is today’s inflection—practice patience until a strong direction emerges above or below this level.
Every setup is designed for structure, plan, and logic—let the chart work for you, not your emotions.
Boost or comment if these levels help your preparation—help Chart Pathik keep delivering quality analysis to more intraday traders!
Vulcan Forged vs Bitcoin vs Ether —Bullish altcoins market!Let's look at the same price pattern once more:
›› On the 6th of February PYRUSDT produced a major low, ending a brutal correction. The same is true for Bitcoin and Ethereum.
›› On the 7th of February, yesterday, PYRUSDT traded neutral, neither lower nor higher. The same is true for Bitcoin and Ethereum.
›› On the 8th of February, today, PYRUSDT produced a major bullish breakout, growing 58%. Bitcoin and Ethereum are likely to follow together with the rest of the altcoins market. Some projects are moving ahead.
What one does, the rest follows.
The market will continue growing.
Thank you for reading.
Namaste.
Natural Gas MCX Future - Intraday Technical Analysis - 9 Feb. MCX:NATURALGAS1!
NATURAL GAS Futures — Chart Pathik Intraday Levels for 09-Feb-2026 - 04:01 AM
(If these levels add value to your trades, a quick boost or comment goes a long way in supporting this free content and keeping our trading community thriving!)
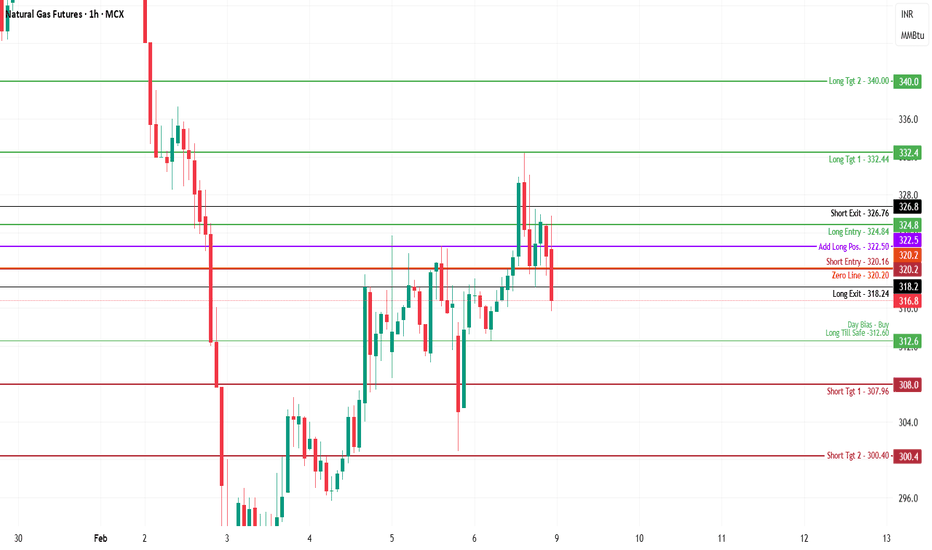
Natural Gas MCX is trading around 322-324 after bounce from lows near 310, consolidating near key resistance at 326 with bullish momentum signals from recent price action. Each comment or share builds the momentum for disciplined, structured analysis across our trading community!
Bullish Structure:
Longs activate above 326 (Long Entry), with confirmation as price sustains above this prior high and defends 322 support zone.
Targets: 332 (major booking zone), 340 (extended move on breakout)
Control: Stop or trail near 322 or 320 to manage risk
Bearish Structure:
Shorts open below 322 or on rejection at 326 after failed upside attempts.
Targets: 316 (partial/scalp), 310 (extended move if breakdown holds)
Control: Fast short covers required above 326 or on sharp reversals
Neutral Zone:
326 is today’s inflection—practice patience until a strong direction emerges above or below this level.
Every setup is designed for structure, plan, and logic—let the chart work for you, not your emotions.
Boost or comment if these levels help your preparation—help Chart Pathik keep delivering quality analysis to more intraday traders!
AI will KILL SaaS Companies...Right?!Tech Services (SaaS) sector stands at a critical juncture.
The 200-week moving average has supported price every time since 2005, with breaks only during the 2008 financial crisis and the 2022 bear market.
Absent another crash, this could represent a once-in-a-generation entry point for CBOE:IGV and leading SaaS names like NYSE:CRM , NASDAQ:ADBE , and $NOW.
Crude Oil MCX Future - Intraday Technical Analysis - 9 Feb., 26MCX:CRUDEOIL1!
CRUDE OIL Futures — Chart Pathik Intraday Levels for 09-Feb-2026 - 03:55 AM
(If these levels add value to your trades, a quick boost or comment goes a long way in supporting this free content and keeping our trading community thriving!)
Crude Oil MCX is trading around 5,850 after pullback from recent highs near 6,000, consolidating near key resistance at 5,920 with bearish signals from downward momentum. Each comment or share builds the momentum for disciplined, structured analysis across our trading community!
Bullish Structure:
Longs activate above 5,920 (Long Entry), with confirmation as price sustains above this prior high and defends 5,800 support zone.
Targets: 6,000 (major booking zone), 6,040 (extended move on breakout)
Control: Stop or trail near 5,800 or 5,730 to manage risk
Bearish Structure:
Shorts open below 5,800 or on rejection at 5,920 after failed upside attempts.
Targets: 5,710 (partial/scalp), 5,650 (extended move if breakdown holds)
Control: Fast short covers required above 5,920 or on sharp reversals
Neutral Zone:
5,920 is today’s inflection—practice patience until a strong direction emerges above or below this level.
Every setup is designed for structure, plan, and logic—let the chart work for you, not your emotions.
Boost or comment if these levels help your preparation—help Chart Pathik keep delivering quality analysis to more intraday traders!
BTCUSDT: Capitulated to the M50ema SupportBitcoin bounced perfectly off the Monthly 50-EMA at $65K, exactly as anticipated.
This level once again proved to be a major long-term support, triggering a strong reaction after the sell-off.
Now we will see what type of consolidation or correction will form within this range.
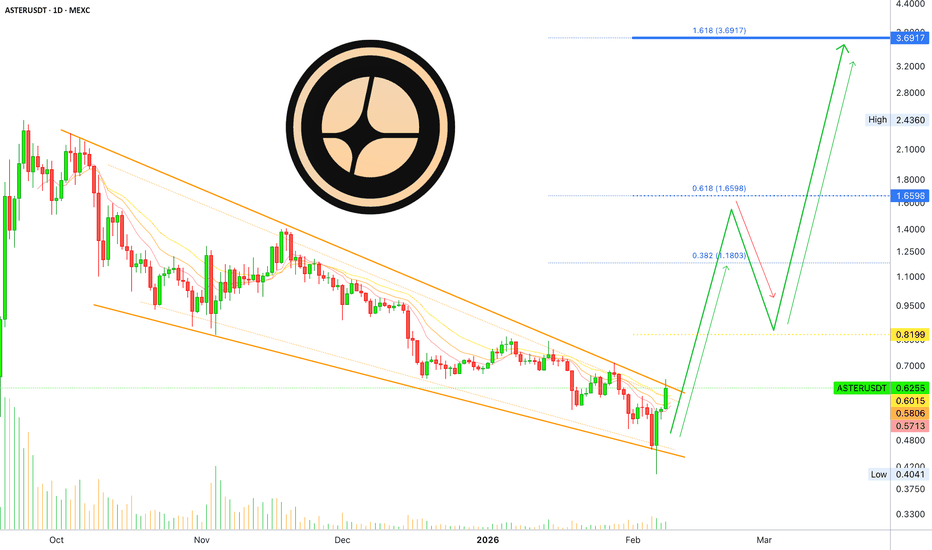
Aster vs Bitcoin vs Ether —Altcoins market bullish bias exposed!Here is how you can predict what the bigger projects will do by looking at the smaller ones. We will focus only on the last three days. 6, 7 and 8 February, today.
›› ASTERUSDT hit a new all-time low 6-February. Bitcoin produced a major low as well and Ethereum a higher low. The point is that this date marks the end of a correction.
In all three instances, the same day produced a very strong recovery and the session ended full green. 6-February.
›› Yesterday, ASTERUSDT traded neutral. It went slightly lower but closed near the open. The same for Bitcoin, Ethereum and many other projects.
8-February, today. Bitcoin and Ethereum are yet to move higher but they are not moving lower, the action is happening near the top of the range.
›› Today, ASTERUSDT broke bullish and moved higher. Bitcoin and Ethereum are likely to do the same. This can be true and valid for the rest of the altcoins. The smaller projects tend to move first because of their size.
It is the same pattern repeated all across:
1) A major low and recovery the same day. 6-Feb.
2) Neutral. 7-Feb.
3) Higher—today. 8-Feb.
We can expect the market to continue rising.
If there is a drop tomorrow, take it simply as an opportunity to buy before additional growth. The week is about to close full green, really strong, and this signal confirms additional growth. This growth signal is based on the mid-term, any movements short-term can be considered noise.
Focus on the bigger picture. The relief rally is on!
Namaste.
Nifty50 Index - Technical Analysis - 9 Feb., 2026 NSE:NIFTY
NIFTY 50 Index — Chart Pathik Intraday Levels for 09-Feb-2026 - 03:50 AM
(If these levels add value to your trades, a quick boost or comment goes a long way in supporting this free content and keeping our trading community thriving!)
Nifty 50 is trading around 25,700 after pullback from recent highs near 25,900, consolidating near key resistance at 25,800 with mild weakness signals from price action. Each comment or share builds the momentum for disciplined, structured analysis across our trading community!
Bullish Structure:
Longs activate above 25,800 (Long Entry), with confirmation as price sustains above this prior high and defends 25,600 support zone.
Targets: 25,900 (major booking zone), 26,000 (extended move on breakout)
Control: Stop or trail near 25,600 or 25,500 to manage risk
Bearish Structure:
Shorts open below 25,600 or on rejection at 25,800 after failed upside attempts.
Targets: 25,400 (partial/scalp), 25,200 (extended move if breakdown holds)
Control: Fast short covers required above 25,800 or on sharp reversals
Neutral Zone:
25,800 is today’s inflection—practice patience until a strong direction emerges above or below this level.
Every setup is designed for structure, plan, and logic—let the chart work for you, not your emotions.
Boost or comment if these levels help your preparation—help Chart Pathik keep delivering quality analysis to more intraday traders!
SPY Weekly Outlook – Week 6 of 2026 (Feb 09–13)SPY Weekly Outlook – Week 6 of 2026 (Feb 09–13)
Weekly Recap
Last week, my core projection for SPY was that price lacked a clear directional bias and would trade within a range, reacting from key levels. Price behaved exactly as expected throughout the week, rejecting from those levels and forming short-term bounces.
The framework was simple and worked very well:
If price takes liquidity from a key level and closes above it → buy calls and target the next higher liquidity level.
If price fails to hold the level and closes back below → exit calls, buy puts, and target the next lower key level.
This structure played out cleanly. After 687.25 broke and price closed below it, we shorted SPY and entered puts. Profits were taken sequentially at 684.75 and 676.5.
Once price found a bounce at 676.5, the remaining put position was stopped, and we flipped long into calls on Thursday, anticipating a bounce. That long positioning paid off very well into Friday.
Overall, execution aligned perfectly with the framework, making it a highly successful week.
(For reference, last week’s SPY outlook is shared as a linked idea.)
Scenarios – Prediction
Bullish Continuation (Likely)
I am tracking two possible paths for bullish continuation next week. For SPY to resume its move toward all-time highs, the 690 level must be reclaimed.
Scenario 1:
Price breaks above 690 and secures acceptance above it (a gap up open also qualifies).
In this case, I expect price to move quickly early in the week toward 697.75 and 700.
Bullish Targets:
697.75 → 700
Scenario 2:
Price fails to break 690, pulls back to build energy, and finds support in the 685–680 bounce zone.
If price bounces from this area and creates deviation:
Bullish Targets:
690 → 697.75 → 700
Bearish Scenario
If price breaks and accepts below 675.5, I will consider SPY to have shifted into bearish mode.
In that case, all call and long positions should be closed, and bias should flip to puts.
Bearish Targets:
669 → 649
Position Management Notes
I only consider a level broken after two consecutive 1H candle closes above or below it. If price deviates into a level and then confirms by closing above or below, I treat that as a valid deviation setup.
No trades are taken without confirmation. If price closes back inside a level we assumed was broken or deviated from, again confirmed by two 1H closes the trade idea is invalidated and positions should be exited.
I share deeper US Market breakdowns and mid week scenario updates on Substack. Link is in my profile.
This analysis is for educational purposes only and reflects my personal opinion. It is not financial advice.
Bank Nifty Index - Weekly Technical Analysis - 9-13 Feb., 26NSE:BANKNIFTY
BANK NIFTY Index — Chart Pathik Weekly Levels for Week of 09/13 -Feb-2026 - 03:42 AM
(If these levels add value to your trades, a quick boost or comment goes a long way in supporting this free content and keeping our trading community thriving!)
Bank Nifty weekly chart highlights pivotal zones around 51,000-52,000 after recent swings, consolidating near resistance at 52,000 with potential weakness from momentum divergence—ideal for positional swings. Each comment or share builds the momentum for disciplined, structured analysis across our trading community!
Bullish Structure:
Longs activate above 52,000 (W Long Entry), with confirmation as price sustains above this prior high and defends 51,700 support zone.
Targets: 52,500 (major booking zone), 53,000 (extended move on breakout)
Control: Stop or trail near 51,700 or 51,500 to manage risk
Bearish Structure:
Shorts open below 51,700 or on rejection at 52,000 after failed upside attempts.
Targets: 51,200 (partial/scalp), 50,500 (extended move if breakdown holds)
Control: Fast short covers required above 52,000 or on sharp reversals
Neutral Zone:
52,000 is this week’s inflection—practice patience until a strong direction emerges above or below this level.
Every setup is designed for structure, plan, and logic—let the chart work for you, not your emotions.
Boost or comment if these levels help your preparation—help Chart Pathik keep delivering quality analysis to more intraday traders!
CRCL Top-Down Chart Walkthrough | From Market Structure to In this video, I walk step-by-step through the CRCL chart using a simple top-down trading process designed for beginners and developing traders.
We move through the higher timeframes — monthly, weekly, and daily to identify meaningful support and resistance levels.
Why Risk Management matters more than WIN RateWhy Risk Management matters more than WIN Rate
Welcome everyone to another educational article.
If you are enjoying these, please make sure to follow for more!
Lets get started.
Definitions:
Risk Management > Is the process of defining:
- What you can afford to lose completely
- The percentage of all your capital, risked per trade
- How losses are controlled, before you take a trade
Risk management allows you to Stay in the game . It protects your capital and account from blowing up, from your emotional ideas.
Win Rate > is the percentage of trades that:
- Hit Take Profit
- Hit Stop Loss
- Hit Break Even
Win rate alone does Not determine profitability. A high Win Rate w/poor risk management can still lose you money.
Straight Into It
Risk management is more important than win rate because defining your risk allows you to take many trades over time.
If you “go all in” on one trade:
- You technically have a 100%- win rate system if it wins
- But it is based on one outcome
This system is flawed because it relies on a single result, not probability.
Trading is not one trade it is hundreds.
Why Defined Risk Wins Over High Win Rate
When you define your risk:
- You control downside
- You survive losing streaks
- You allow probability to play out
A system that wins over:
- 100
- 200
- 300 trades
It is far more reliable than a system based on one trade.
Consistency over time always beats one-off success.
Example: Risk in Practice
Let’s say you have $100.
When people say “ risk 1% ”, they mean:
- Risk $1 per trade
- Not $100
Using leverage (example: 10x):
- Your capital risk is $1
- Your margin exposure becomes $10
This allows you to trade 10% position size while only risking 1%.
If the trade loses:
- You still have $99
- That’s 99 more attempts
That’s how systems survive.
Why This Matters Long-Term
Risk management:
• Reduces emotional pressure
• Prevents revenge trading
• Keeps drawdowns manageable
• Allows confidence to grow naturally
Win rate looks good on paper.
Risk management keeps you alive long enough to profit.
Extra Insight
A trader with:
• 40% win rate
• Strong risk management
Will outperform a trader with:
• 70% win rate
• Poor risk control
Why?
Because the first trader survives long enough for probability to work.
Conclusion
Win rate tells you how often you win.
Risk management determines whether you stay in the game.
One trade proves nothing.
A hundred trades prove everything.
Define your risk .
Respect probability.
Trade for longevity > not ego.
Check out the process of "Understanding Risk Management here" Here:
