Bearish focus on BTCUSD Buyers are losing momentum ,am expecting a drop from a key level
Money management is a key
Trend Analysis

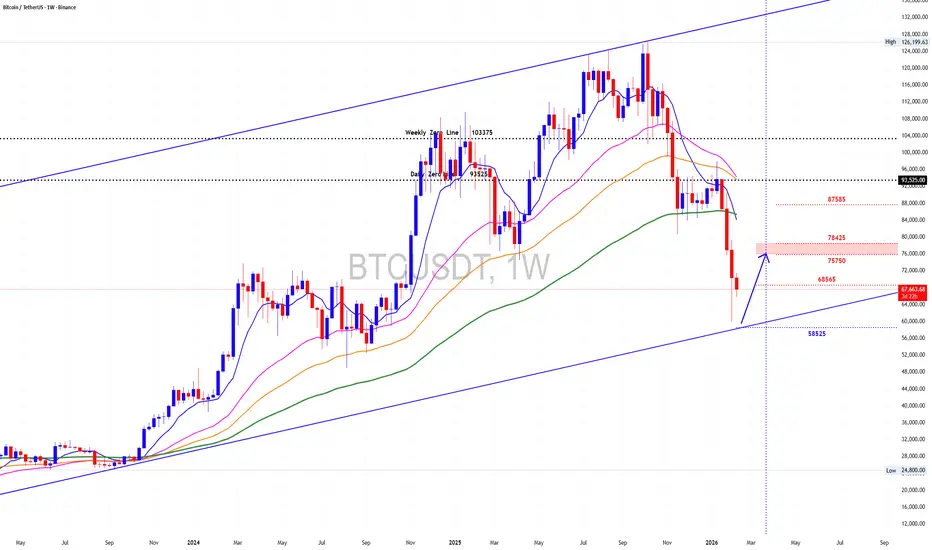
Bitcoin: Weekly Chart UpdateAs of now all points out that we are going to test the $75k area before going to test the $60k low and break lower .
One thing we all agree, Bitcoin already printed its first Weekly Lower Low and that changed the picture.
Boost.........Follow.........Comment.
The Week's Meltdown Is Almost CompleteThis week’s meltdown is about to complete at 207.2 - 207.05.
Look for a rejection with a with a pull back up to 210.1 at the Fib .382 to close the week with a big candle wick.

PFE & TSLAPhizer presents with a very strong uptrend that is in place. This
a great swing trade to put on.
Tsla is now reflecting its current correction. We are going to use its ETF inverse bearish position.
Please find more tradesetus especially on options at OSS.CC We do also a free nightly newsletter and a full service newsletter with a free two trial at OSS.CC
Happy Trading.


Potential bearish drop off?Cable (GBP/USD) has rejected off the pivot and could drop to the 1st support, which has been identified as an overlap support.
Pivot: 1.3717
1st Support: 1.3549
1st Resistance: 1.3782
Disclaimer:
The opinions given above constitute general market commentary and do not constitute the opinion or advice of IC Markets or any form of personal or investment advice.
Any opinions, news, research, analyses, prices, other information, or links to third-party sites contained on this website are provided on an "as-is" basis, are intended to be informative only, and are not advice, a recommendation, research, a record of our trading prices, an offer of, or solicitation for, a transaction in any financial instrument and thus should not be treated as such. The information provided does not involve any specific investment objectives, financial situation, or needs of any specific person who may receive it. Please be aware that past performance is not a reliable indicator of future performance and/or results. Past performance or forward-looking scenarios based upon the reasonable beliefs of the third-party provider are not a guarantee of future performance. Actual results may differ materially from those anticipated in forward-looking or past performance statements. IC Markets makes no representation or warranty and assumes no liability as to the accuracy or completeness of the information provided, nor any loss arising from any investment based on a recommendation, forecast, or any information supplied by any third party.

GBP/USD | NWOG Retest (READ THE CAPTION)As you can see in the 30m chart of GBPUSD, after it hit the Feb 9th NWOG Midpoint (Consequent Encroachment), it bounced back up, but after hitting Jan 26th NWOG Low, it dropped again, going back to the Feb 12th NDOG, hitting it and going back up a bit and it is now being traded at 1.3638.
I expect GBPUSD to retest the Jan 26th NWOG.

GBPCAD bearish view
$GBPACAD we are have bearish push, currently three times bounce on sup. zone, look like its valid, from here now higher bearish expectations having.
SUP zone: 1.85700
RES zone: 1.84100, 1.83400

PLTR Weekly Swing Signal NASDAQ:PLTR The weekly entry label printed on PLTR late Jan/early Feb.
If you look back on this chart, the last weekly signals lined up with the larger upside expansions. Those weren’t random bounces, they were points where accumulation started before the next leg higher.
Right now we’ve had a solid pullback after a strong run. RSI has cooled off, momentum has reset, and price has come back into an area where stronger hands typically build positions, not where retail chases.
This is usually the phase where:
Weak hands get shaken out
Fear picks up
Smart money quietly accumulates
From a structure standpoint, this looks like a higher-timeframe swing setup forming again.
I’m treating this as a swing opportunity, not a scalp. The weekly signal is what matters here. If history rhymes, this is the zone where positioning makes sense before expansion, not after.
As always, not financial advice, just sharing what I’m seeing on the chart.

GOLD Trade Plan 12/02/2026Dear Traders,
Price has been strongly ranging above the 5000 level. I expect a temporary move upward from this area. However, if price fails to hold and stabilize above the 5140 zone, selling pressure could push it back toward the mid-channel area to gather momentum for a potential move higher.
Regards,
Alireza!

Bitcoin Bear Flag Breakdown in Play - Target $74k - $75kAnd this chart of Bitcoin we see the Bear Flag pattern playing out as forecast by the Red zigzag line a few weeks ago.
Price pushed up directly into the Red Cell Zone which are just visualizations of limit sell orders on the order books. Similarly, there are strong limit buy orders in the buy support green zone below around 84 to 85k.
But based on my prior study of the macro Head and Shoulders that likely will play out, even if we get it bounce here I do believe we will roll over and take out the buy support Zone below us and complete the Bear Flag measured move target down to 74k to 75k.
This will likely be the bottom, as Bitcoin is never gone below the price it was when a new incoming president won an election. 74k was a prior resistance level flipped as support and I expected to hold.
If it doesn't, then likely Bitcoin can head to 62k which would be the measured move on the macro Head and Shoulders in the prior study here.
In the meantime, lots of uncertainty in the markets, that could drive prices either way in the short term.
Today we have FOMC and although there is a 97% chance they do not cut rates, Powell's comments will be important and may move the markets depending on how hawkish or doveish he sounds.
With war tensions in the Middle East and Iran's escalatory language, Market participants are staying out as they don't like uncertainty.
On the other hand, hearing rumors that the US is buying Japanese yen to help prop up their currency and potentially start the money printer which would be bullish.
The DXY is also heading down, and if it breaks the 95 level then typically we enter another bullish phase as we saw in 2021.
Let me know your thoughts!

USDCAD H4 | Bearish Reaction Off Pullback ResistanceMomentum: Bearish
Price is currently below the ichimoku cloud.
Sell entry: 1.36340
- Pullback resistance
- 61.8% Fib retracement
Stop Loss: 1.36823
- Swing high resistance
- 78.6% Fib retracement
Take Profit: 1.35649
- Pullback support
High Risk Investment Warning
Stratos Markets Limited (fxcm.com/uk), Stratos Europe Ltd (fxcm.com/eu):
CFDs are complex instruments and come with a high risk of losing money rapidly due to leverage. 69% of retail investor accounts lose money when trading CFDs with this provider. You should consider whether you understand how CFDs work and whether you can afford to take the high risk of losing your money.
Stratos Global LLC (fxcm.com/en): Losses can exceed deposits.
Please be advised that the information presented on TradingView is provided to FXCM (‘Company’, ‘we’) by a third-party provider (‘TFA Global Pte Ltd’). Please be reminded that you are solely responsible for the trading decisions on your account. Any information and/or content is intended entirely for research, educational and informational purposes only and does not constitute investment or consultation advice or investment strategy. The information is not tailored to the investment needs of any specific person and therefore does not involve a consideration of any of the investment objectives, financial situation or needs of any viewer that may receive it. Past performance is not a reliable indicator of future results. Actual results may differ materially from those anticipated in forward-looking or past performance statements. We assume no liability as to the accuracy or completeness of any of the information and/or content provided herein and the Company cannot be held responsible for any omission, mistake nor for any loss or damage including without limitation to any loss of profit which may arise from reliance on any information supplied by TFA Global Pte Ltd.
Stratos Trading Pty. Limited (fxcm.com/au):
Trading FX/CFDs carries significant risks. FXCM AU (AFSL 309763), please read the Financial Services Guide, Product Disclosure Statement, Target Market Determination and Terms of Business at fxcm.com/au

EURCHF H4 | Bearish Reaction Off Pullback ResistanceMomentum: Bearish
Price is currently below the ichimoku cloud.
Sell entry: 0.91562
- Pullback resistance
- 78.6% Fib retracement
Stop Loss: 0.91821
- Overlap resistance
Take Profit: 0.91229
- Swing low support
High Risk Investment Warning
Stratos Markets Limited (fxcm.com/uk), Stratos Europe Ltd (fxcm.com/eu):
CFDs are complex instruments and come with a high risk of losing money rapidly due to leverage. 69% of retail investor accounts lose money when trading CFDs with this provider. You should consider whether you understand how CFDs work and whether you can afford to take the high risk of losing your money.
Stratos Global LLC (fxcm.com/en): Losses can exceed deposits.
Please be advised that the information presented on TradingView is provided to FXCM (‘Company’, ‘we’) by a third-party provider (‘TFA Global Pte Ltd’). Please be reminded that you are solely responsible for the trading decisions on your account. Any information and/or content is intended entirely for research, educational and informational purposes only and does not constitute investment or consultation advice or investment strategy. The information is not tailored to the investment needs of any specific person and therefore does not involve a consideration of any of the investment objectives, financial situation or needs of any viewer that may receive it. Past performance is not a reliable indicator of future results. Actual results may differ materially from those anticipated in forward-looking or past performance statements. We assume no liability as to the accuracy or completeness of any of the information and/or content provided herein and the Company cannot be held responsible for any omission, mistake nor for any loss or damage including without limitation to any loss of profit which may arise from reliance on any information supplied by TFA Global Pte Ltd.
Stratos Trading Pty. Limited (fxcm.com/au):
Trading FX/CFDs carries significant risks. FXCM AU (AFSL 309763), please read the Financial Services Guide, Product Disclosure Statement, Target Market Determination and Terms of Business at fxcm.com/au

GBPUSD SELLUK data looking shaky esp GDP, narrative early pointing to a short term sell.
High Timeframe already flipped, we shall see if this idea holds. Could potentially run lower too.

Expected retracement US30Looking at the chart, the Dow Jones is currently sitting right inside a consolidation zone around 50,247, where price is hesitating between buyers and sellers. This grey box i drew marks resistance, showing the market is undecided at this level. My expectation seems to be that price won’t immediately break higher but will instead retrace downward first. The “entry zone” i highlighted around 49,400 reflects where i anticipate buyers stepping back in, giving a discount entry for a long position. Along the way, the blue line at 49,589 acts as a mid-support checkpoint, while the stronger green line at 48,615 is a deeper defense level. If price holds at either of these supports, the bullish continuation thesis remains valid. However, if the red line at 48,461 is broken, it signals that bears have taken control and the bullish setup is invalidated. In short, the drawing frames the market expectation as a short-term pullback into support, followed by a medium-term continuation upward, with clear risk boundaries to protect against deeper downside.

If Bitcoin doesn’t hold here then 27k is my targetBitcoin on the monthly timeframe is still inside a long-term rising channel, but it has recently experienced a sharp rejection after a strong rally toward the upper part of that channel. The current move down appears to be a significant correction rather than minor volatility.
Price is now approaching important support zones, starting around 60k, with stronger historical support between 50k–52k and 38k–42k. A deeper correction toward 30k cannot be ruled out if momentum continues downward.
Technically, this could be either:
• A normal mid-cycle pullback within a broader uptrend, or
• The beginning of a larger distribution phase if price breaks and closes below the lower channel boundary on the monthly chart.
At this stage, momentum is bearish short-term, corrective medium-term, but the long-term uptrend structure remains intact unless key support levels fail.

PiPPiN $0.55 | For Hodl Gang $0.05 cents only Note Prices are approxinations from severasl projects of the designated handler
unless Yohei changes the dealer .. it should be within the range..
just a plan from another time
Sol has now two Flagship SHowcase
Bonk that redeemed the chain
PUMPfun that brought mass adoption
and Pippin as Pump's next Generation Onboarding Program
No Airdrops YET
still a meme to most
the Ai AGi Synsthetic PROMPT and Verification Angle is for next leg up towards Decacrorn levels
--

Bitcoin got MASSACRED by gold.Bitcoin got MASSACRED by gold.
NO other way to spin it, no matter how hard MAXIS try.
This was 100% AVOIDABLE, for those using PROPER chart analysis.

EURUSD – Execution Update | Target Reached EURUSD – Execution Update | Target Reached ✅
Previously outlined continuation scenario has played out as anticipated.
Price respected the defined demand / mitigation zone on lower timeframes, formed bullish structure, and delivered a clean impulsive expansion toward the projected liquidity.
📌 Execution Details:
Entry: Demand reaction within the marked grey zone
Structure: Higher low formation on intraday timeframe
Momentum confirmation: Strong displacement move
Result: Take Profit achieved
The move unfolded in alignment with the 4H continuation bias shared earlier.
Liquidity above was efficiently delivered without violating the invalidation level.
This trade was not prediction-based — it was structure-based.
Clear zone.
Defined risk.
Logical target.
Discipline + patience = asymmetric outcome.
Risk management remains the core edge.

BTC - 12H Chart & Developments This post will just slight expand on our last:
Just wanted to pint out the 12H doji that just printed! As long as price can stay above the wick low there is a very good chance the low is being established here.
The 12H RSI also has a slight bullish divergence that has formed (green trendlines).
Last but not least, if that low is formed here and price is able to have a solid run back to the upside then the target could be around $78.4k based on a predictive Fibonacci sequence.
Confirmations should print tomorrow in line with the daily's.

GBPJPY SELLcontinuation of sell off.
we put a box around the range and clone the box. once broken from this range or consolidation we see price fill the next box.
it sits inline with the 205.000 psychological level where we see price pushing to.
price broke and re-tested of the box at 210.000 another psychological level.
this is as the yen strengthens and financials risks fade.

AUDCAD Will Go Down! Sell!
Here is our detailed technical review for AUDCAD.
Time Frame: 4h
Current Trend: Bearish
Sentiment: Overbought (based on 7-period RSI)
Forecast: Bearish
The market is trading around a solid horizontal structure 0.966.
The above observations make me that the market will inevitably achieve 0.956 level.
P.S
The term oversold refers to a condition where an asset has traded lower in price and has the potential for a price bounce.
Overbought refers to market scenarios where the instrument is traded considerably higher than its fair value. Overvaluation is caused by market sentiments when there is positive news.
Like and subscribe and comment my ideas if you enjoy them!

XAU/USD 12 February 2026 Intraday AnalysisH4 Analysis:
-> Swing: Bullish.
-> Internal: Bullish.
Analysis and bias to remain the same as analysis dated 02 February 2026.
Price has printed as per analysis dated 22 January where I mentioned price to print bearish CHoCH to indicate bearish pullback phase initiation.
Price is now trading within an established internal range.
Intraday expectation:
Price to react at either discount of 50% internal EQ, or H4 supply zone before targeting weak internal high priced at 5,602,225.
Note:
The Federal Reserve’s renewed easing cycle, alongside a weaker U.S. dollar and persistent geopolitical tensions, continues to drive volatility in the gold market.
Traders should remain cautious and adjust risk management strategies to navigate sharp price swings.
Additionally, gold pricing is highly sensitive to U.S. policy under President Trump, where tariff measures, fiscal uncertainty, and shifting geopolitical strategy amplify market repricing risks and reinforce safe‑haven demand.
H4 Chart:
M15 Analysis:
-> Swing: Bullish.
-> Internal: Bearish.
Analysis and bias to largely remain the same as analysis dated 02 February 2026. I have added to intraday expectation with respect to alternative scenario.
Price has printed according to analysis dated 30 January 2025 where I mentioned, in alternative scenario, price could print a bearish iBOS as all HTF's require a pullback.
This is exactly how price printed.
Price has since printed a bullish CHoCH to indicate bullish pullback phase initiation.
Price is currently contained within an established internal range.
Intraday expectation:
Price trade up to either M15 supply zone, or premium of 50% internal EQ before targeting weak internal low, priced at 4,402.380.
Alternative scenario:
Price to potentially print bullish iBOS as H4 pullback could be complete, however, Daily and Weekly TF still require pullback.
Note:
Gold continues to exhibit elevated volatility as markets digest the Federal Reserve’s ongoing dovish tilt and persistent global geopolitical tensions.
With uncertainty remaining a dominant theme across global risk assets, traders should prioritise disciplined risk management, as abrupt price swings and liquidity pockets may become increasingly common.
Furthermore, recent tariff announcements from President Trump, particularly those directed at China, have added another layer of instability to the macro landscape. These policy developments have the potential to intensify market turbulence, heighten risk‑off flows, and trigger sharp intraday reversals or whipsaw‑like behaviour in gold.
M15 Chart:
