BERAUSDT Forming Bullish MomentumBERAUSDT is displaying a strong bullish momentum pattern, signaling a potential continuation of its upward trend. The market structure shows clear accumulation at lower levels, followed by a decisive breakout that highlights growing buyer confidence. This kind of price behavior often acts as a precursor to a major rally, especially when combined with increasing volume and strong market sentiment. With momentum shifting firmly to the upside, traders are expecting a 90% to 100%+ move in the coming sessions as the pair targets higher resistance zones.
The volume profile remains healthy, suggesting that investors are actively positioning themselves in anticipation of the next bullish leg. This consistent demand underscores rising confidence in BERA’s long-term potential, as well as the growing strength of its ecosystem. The ongoing market activity indicates that the bulls are firmly in control, with dips being quickly bought up — a strong confirmation of upward momentum building beneath the surface.
If current conditions persist, BERAUSDT could soon challenge major breakout levels, triggering a surge in buying pressure and pushing prices into new highs. Technical indicators also align with this bullish outlook, hinting at strong trend continuation and a favorable setup for medium to long-term traders.
✅ Show your support by hitting the like button and
✅ Leaving a comment below! (What is You opinion about this Coin)
Your feedback and engagement keep me inspired to share more insightful market analysis with you!
Trend Analysis
Gold rebounds – Market eyes the $4090–$4100 target📊 Market Overview:
After hitting a new record high at $4,078/oz, gold briefly pulled back to $4,067 before rebounding to $4,075, showing strong buying interest 💰.
Risk aversion remains elevated amid ongoing US–China trade tensions and geopolitical uncertainty.
🧭 Technical Analysis:
• Trend: Strong bullish on H1–H4
• EMA: Price remains above EMA20–50 cluster → short-term uptrend intact
• Resistance: $4,078 – $4,095
• Support: $4,060 – $4,048
• Candle pattern: Bullish rejection candle near $4,067 confirms active buyers
• Momentum: RSI near 68 – strong, not yet overbought
💡 Outlook:
Gold is retesting the $4,078 peak; if an H1 candle closes firmly above it, the next target lies at $4,090–$4,100 🎯.
Otherwise, a short-term pullback toward $4,060–$4,050 could occur before another rally attempt.
________________________________________
🔺 BUY XAU/USD
Entry: $4.069 – $4.072
🎯 TP: 40 / 80 / 200 pips
🛑 SL: $4.066
XAUUSD — Accumulation Phase Awaiting Breakout XAUUSD — Accumulation Phase Awaiting Breakout | European–American Session Scenarios & Detailed Trading Plan 🟡
Summary: Gold maintains an upward trend within a rising channel. The European–American session prioritizes buying in confirmed support zones; selling is only a secondary option when there is a strong rejection signal at the peak.
📊 Technical Analysis (H1/H30)
Market Structure
Price moves within an ascending channel, with adjustments mainly being pullbacks.
Two prominent liquidity zones on the chart: Buy zone around 4020–4030 and Sell zone above 4125–4135.
Key & Confluence Price Zones
Support:
4057–4059: former resistance turned support + channel boundary, suitable for retest.
4022–4024: coincides with buy zone and dense volume cluster (VPVR).
Resistance: 4072 / 4088 / 4105 / 4125, watch for reactions at 4095–4100 (near Fibonacci extension 1.618/2.618).
Fibonacci: extension measurement suggests a target of ~4130; this is also near the sell liquidity zone, likely to see a short rejection before deciding the next direction.
Note pivot points: 4069 – 4042 – 4095 – 4120 are key levels to monitor price action.
Structure Reading Suggestion: If a "buy test trend" move appears near the channel bottom, prioritize finding confirmation candles to continue buying on retracement.
📰 Fundamental Analysis (Highlights)
Imperial Bank of Commerce: long-term inflation concerns support gold's rise; target 4,500 in the next 2 years → bullish inclination.
State Street: delayed rate cuts keep USD/real yields sensitive, maintaining volatility; gold remains a safe haven as risks increase.
Pansen Macro (ECB): difficult to cut rates soon due to weak growth → impacts EUR/DXY, indirectly affecting gold.
Commodity Context: Goldman Sachs remains cautious on copper (10k–11k/ton 2026/27); risk capital may rotate, benefiting gold as defensive sentiment rises.
Connection: The contrast between tight policy and risk sentiment creates an accumulation range; when yields ease, gold may break through 4100–4130.
🎯 European–American Session Trading Strategy (if–then)
Scenario 1 — BUY at support (priority)
Entry: 4057–4059
SL: 4052
TP: 4072 → 4088 → 4105 → 4125
Condition: if price retests 4057–4059 and there is a confirmation candle / reclaim of the channel boundary, continue to buy with the trend.
Scenario 2 — BUY deep at buy zone
Entry: 4022–4024
SL: 4016
TP: 4038 → 4052 → 4077 → 4090
Condition: only activate when there is a wick at the buy zone and price holds above 4042 afterward.
Scenario 3 — SELL reaction (secondary)
Only consider short selling when there is a clear rejection at 4120–4130 (sell liquidity zone) accompanied by weakening momentum; target a pullback to 4100/4088. Do not chase the price.
Invalidation & Risk Management
If price breaks and accepts below 4042, stay out and wait for a new structure; losing 4016 opens risk of returning to the 3990x cluster (old POC).
Each trade risk ≤ 1–2% of the account; adhere to SL first, position later. 🛡️
SENSEX Analysis With Intraday Levels for 14th Oct 2025SENSEX At A Glance (As of October 13, 2025)
The BSE Sensex closed at 82,327.05 on October 13, 2025, down 173.77 points or 0.21% from the previous close of 82,500.82. The index opened at 82,049.16, hit a high of 82,438.50, and a low of 82,043.14 during the session. This marked the end of a two-day rally, with the decline primarily driven by losses in IT stocks (e.g., Infosys down, contributing -62.61 points) amid US-China tariff concerns under potential Trump policies. Positive contributors included Bajaj Finance (+70.35 points) and Adani Ports (+51.73 points). Overall market breadth was negative, with broader indices like midcaps and smallcaps also slipping 0.3-0.5%.
🛠️ Technical Analysis
Candlestick Patterns and Indicators: The daily chart showed a bearish engulfing pattern after indecision, with the index closing below key moving averages. RSI (14) around 52 (neutral but declining), MACD showing a bearish crossover. Implied volatility (India VIX) edged up to ~11, indicating mild caution.
Support/Resistance: Immediate support at 82,000-82,043 (today's low and 50% Fibonacci retracement). Resistance at 82,500-82,800 (recent highs and 200-DMA). Low IV suggests range-bound trading unless triggered by news.
Option Greeks (for Sensex Options): Near-ATM strikes (around 82,300) have Delta ~0.5/-0.5, moderate Theta decay (~₹10-15/day), and Gamma favoring directional breaks.
Fundamental Analysis
Macroeconomic Cues: FII inflows remained positive (net buy ~₹500 Cr), but DII selling added pressure. Q2 earnings season is underway, with focus on banking (positive RBI liquidity) and IT (H-1B visa risks). Global impacts: US indices mixed (Nasdaq down ~3.56% recently), Asian markets lower (Hang Seng -1.63%), weighing on sentiment.
Sectoral News: IT dragged the index (down 1-2% on tariff fears), while financials (Bajaj Finance, Axis Bank) provided support. Realty and autos weakened on demand slowdowns.
FII/DII Flows: FII net buyers, DII net sellers, signaling mixed institutional confidence.
Real-Time News Sentiment
Headlines and Announcements: Key stories include US tariff threats on China impacting exports/IT, and corporate updates (e.g., Bharat Forge litigation with no material impact, EFC investor meet). No major RBI commentary; geopolitical stability (e.g., Middle East ceasefires) reduces tail risks.
Discussion on Social Sites & Sentiment: Recent posts highlight market declines ("Bears takeover!"), company-specific updates (e.g., RACL Geartech director change), and neutral-to-bearish views on BSE stocks. Broader discussions on global tariffs add caution.
🔍Intraday Probability Estimates for October 14, 2025 (My OWN VIEW
Based on current after-hours cues (GIFT Nifty indicating a flat-to-lower open, correlated to Sensex), low IV, and bearish momentum:
Upside: 35% – Limited by resistance and global drag, but possible on positive earnings.
Downside: 55% – Higher probability from tariff woes and IT weakness.
Volatile Market (>1% move): 30% – Earnings surprises could trigger, but low VIX caps big swings.
Fundamental Analysis
Macroeconomic Cues: FII inflows remained positive (net buy ~₹500 Cr), but DII selling added pressure. Q2 earnings season is underway, with focus on banking (positive RBI liquidity) and IT (H-1B visa risks). Global impacts: US indices mixed (Nasdaq down ~3.56% recently), Asian markets lower (Hang Seng -1.63%), weighing on sentiment.
Sectoral News: IT dragged the index (down 1-2% on tariff fears), while financials (Bajaj Finance, Axis Bank) provided support. Realty and autos weakened on demand slowdowns.
FII/DII Flows: FII net buyers, DII net sellers, signaling mixed institutional confidence.
Real-Time News Sentiment
Headlines and Announcements: Key stories include US tariff threats on China impacting exports/IT, and corporate updates (e.g., Bharat Forge litigation with no material impact, EFC investor meet). No major RBI commentary; geopolitical stability (e.g., Middle East ceasefires) reduces tail risks.
SN Sentiment: Recent posts highlight market declines ("Bears takeover!"), company-specific updates (e.g., RACL Geartech director change), and neutral-to-bearish views on BSE stocks. Broader discussions on global tariffs add caution.
Intraday Probability Estimates for October 14, 2025
Based on current after-hours cues (GIFT Nifty indicating a flat-to-lower open, correlated to Sensex), low IV, and bearish momentum:
Upside: 35% – Limited by resistance and global drag, but possible on positive earnings.
Downside: 55% – Higher probability from tariff woes and IT weakness.
Volatile Market (>1% move): 30% – Earnings surprises could trigger, but low VIX caps big swings.
BTST/STBT Trade Setup: BTST (buy calls if closes above 82,300 for gap-up potential, 35% prob). STBT (short puts for downside carry, 55% prob), avoid if VIX spikes.
View of Closing Session (Last 1 Hour): Likely mild selling or consolidation; low volume in cautious environment, watch FII flows.
Probabilities for Day-End Close (From ~82,327)
Higher: 35% (institutional support, but globals dominate).
Lower: 55% (tariff fears emphasized).
Roughly Flat (±0.5%): 10% (low IV favors sideways).
Assumptions: Prioritizing global tariff tensions and negative Asian cues over domestic flows; historical patterns in low-VIX days (60% range-bound) adjusted for sentiment.
# "WEEKLY Levels" mentioned in BOX format.
^^^^^^^ Plot Levels Using 3 Min, 5 Min Time frame in your Chart for Better Analysis ^^^^^^^
L#1: If the candle crossed & stays above the “Buy Gen”, it is treated / considered as Bullish bias.
L#2: Possibility / Probability of REVERSAL near RLB#1 & UBTgt
L#3: If the candle stays above “Sell Gen” but below “Buy Gen”, it is treated / considered as Sidewise. Aggressive Traders can take Long position near “Sell Gen” either retesting or crossed from Below & vice-versa i.e. can take Short position near “Buy Gen” either retesting or crossed downward from Above.
L#4: If the candle crossed & stays below the “Sell Gen”, it is treated / considered a Bearish bias.
L#5: Possibility / Probability of REVERSAL near RLS#1 & USTgt
HZB (Buy side) & HZS (Sell side) => Hurdle Zone,
*** Specialty of “HZB#1, HZB#2 HZS#1 & HZS#2” is Sidewise (behaviour in Nature)
Rest Plotted and Mentioned on Chart
Color code Used:
Green =. Positive bias.
Red =. Negative bias.
RED in Between Green means Trend Finder / Momentum Change
/ CYCLE Change and Vice Versa.
Notice One thing: HOW LEVELS are Working.
Use any Momentum Indicator / Oscillator or as you "USED to" to Take entry.
⚠️ DISCLAIMER:
The information, views, and ideas shared here are purely for educational and informational purposes only. They are not intended as investment advice or a recommendation to buy, sell, or hold any financial instruments. I am not a SEBI-registered financial adviser.
Trading and investing in the stock market involves risk, and you should do your own research and analysis. You are solely responsible for any decisions made based on this research.
"As HARD EARNED MONEY IS YOUR's, So DECISION SHOULD HAVE TO BE YOUR's".
Do comment if Helpful .
In depth Analysis will be added later
ADA Price Target 2025 We’re currently moving within a narrowing triangle pattern. If the altcoin season continues without any major black-swan events, geopolitical tensions, or Fed actions that trigger public fear and institutional exits, we could see potential upside moves toward ~$1.2 first, and then ~$2.0 as a secondary target.
The breakout could be even stronger, but once large buyers start to quiet down ( SELL ), it’s usually wise to lock in profits and protect gains.
Gold Ready for continue growth Target 4152 / 4180Gold prices remain elevated, with a key resistance area forming near 4,190. From this zone, a potential short-term correction could occur, possibly pushing prices toward 4,090, forming an intermediate bottom.
Expectations of two U.S. Federal Reserve rate cuts before year-end continue to support gold prices. Meanwhile, the ongoing U.S. government shutdown has increased demand for safe-haven assets, further underpinning gold’s strength.
Technical Outlook:
The bullish pattern in gold remains intact despite recent price declines. After the pullback, prices are showing signs of recovery, suggesting a possible continuation of the uptrend.
If the price breaks above 4,142, we could see further bullish momentum toward the 4,152–4,180 zone. However, if it fails to hold above 4115 / 4,100, the price may retest lower supports before resuming the upward trend.
You may Find more details in the chart.
Trade wisely best of Luck Buddies.
Ps; Support with like and comments for better analysis Thanks for Supporting.
AUD/NZD Technical OutlookAUD/NZD has shown a strong bullish run since April; however, recent price action suggests that the upward momentum may be coming to an end. A potential deep pullback appears likely, with price expected to retrace toward the recent swing low zone.
The Stochastic RSI is indicating a bearish divergence, reinforcing the possibility of a downside correction in the near term.
Entry: 1.13530
Stop Loss: 1.1460
Take Profit (TP): 1.0800 (near the trendline support)
Alternative TP: 1.0600 (recent daily swing low)
Overall, this setup favors a short position, anticipating a continuation of the correction phase before any potential trend resumption.
ETH Faces Growing Bearish Pressure Below Key Technical LevelEthereum’s daily chart signals mounting bearish momentum as the asset continues to trade below its Super Trend indicator.
This level, which has now flipped into dynamic resistance, underscores the current weakness in ETH’s price action.
The Super Trend indicator is a tool traders use to gauge market direction based on volatility. When prices move above the Super Trend line, it suggests a bullish phase driven by buying strength.
However, Ethereum’s current position below this threshold indicates sustained bearish control, warning that downward momentum could persist and limit recovery prospects in the short term.
EURCAD - SHORTTRADING ADVICE REVIEW - EUR/CAD
**✓ SUMMARY: Recommendation REVISED - WAIT FOR CONFIRMATION**
## Previous Context Review
- **Date of Original Analysis**: October 13, 2025
- **Original Recommendation**: SHORT EUR/CAD
- **Key Price Levels**: Entry below 1.6200, Stop 1.6350, Targets 1.6095/1.6030
- **Original Setup Grade**: B+ (15/21 points, 1.75% risk allocation)
***
## ✓ FUNDAMENTAL UPDATE
**New developments: YES - Mixed Signals**
**Key Changes (Past 24-48 Hours):**
1. **French Political Crisis INTENSIFIED**
- Macron **rejected resignation calls** on October 13
- **Two no-confidence motions** filed against reinstated PM Lecornu
- Political instability **worsening** - supports EUR weakness ✅
2. **Oil Price Recovery**
- WTI crude **+2.36%** to $59.61 on October 13
- Bounced from $58.26 low on October 10
- Still **-19.26% YoY** but short-term recovery could strengthen CAD ⚠️
3. **Canadian Employment Surprise**
- September jobs **+60K** vs expectations
- Unemployment steady at 7.1%
- **Reduces urgency** for aggressive BOC cuts ⚠️
**Impact on Original Bias: NEUTRAL/MIXED**
- EUR weakness factors strengthened (French crisis)
- CAD weakness factors mixed (oil recovery vs employment)
***
## ✓ TECHNICAL UPDATE
**Setup Still Valid: YES - But Pending Confirmation**
**Critical Observation**: The **1.6200 support level has NOT been breached**
**Price Action Analysis:**
- Current Price: **1.6237** (from 2H chart)
- 24H Range: **1.6195 - 1.6286**
- Distance from 1.6200: **+37 pips** (still above key level)
- Pattern: **Consolidation above support** - no clean breakdown yet
**Technical Status:**
- ✅ Support zone **integrity maintained**
- ⚠️ **No confirmation signal** yet (bearish breakdown pending)
- ✅ French crisis **fundamental catalyst** still active
- ⚠️ Oil recovery creating **short-term CAD strength**
***
## ✓ REVISED RECOMMENDATION
**Entry Strategy - MODIFIED:**
- **Primary Entry**: **WAIT** for clean break below **1.6200** with volume
- **Alternative**: Sell limit at **1.6280-1.6290** on any pullback to resistance
- **Stop Loss**: **1.6350** (unchanged)
- **Target 1**: **1.6095** (1:2.3 R:R)
- **Target 2**: **1.6030** (1:3.1 R:R)
- **Risk**: **1.5%** (reduced from 1.75% due to mixed signals)
**Reasoning**:
Original setup remains **fundamentally sound** with French political crisis worsening, but **technical confirmation is still pending**. Oil recovery and Canadian employment data create **short-term headwinds** for the short thesis.
***
## ✓ ACTION ITEMS
**Immediate Actions:**
- **Monitor 1.6200 level closely** - wait for clean breakdown
- **Track oil prices** - further recovery above $60 reduces setup attractiveness
- **Watch French political developments** - no-confidence vote timing
- **Prepare entry orders** below 1.6200 but DO NOT execute yet
**Key Monitoring Points:**
- **1.6200 break confirmation** with 4H candle close below
- **Oil price action** - sustained move above $60 would weaken setup
- **BOC meeting prep** (October 29) - market pricing for cuts
**Reassessment Timeline:**
- **Daily review** until 1.6200 breaks or setup invalidates at 1.6350
- **Immediate reassessment** if oil reaches $62+ or French crisis resolves
***
## ✓ CHECKLIST COMPLIANCE
**All 6 Checkpoints Status:**
1. **Confluence (3+/8)**: ✅ **PASS** - French crisis worsened (+1 factor)
2. **Freshness**: ✅ **PASS** - Still first touch of 1.6200 breakdown level
3. **Confirmation**: ⚠️ **PENDING** - No clean breakdown yet (CRITICAL)
4. **Grade**: ✅ **B+** maintained (mixed fundamentals = neutral)
5. **Limits**: ✅ **APPROVED** - Within daily/weekly risk limits
6. **Correlation**: ✅ **APPROVED** - No new correlation concerns
**Zero-Tolerance Violations**: ❌ **NONE**
**Current Compliance**: **5/6 checkpoints passing** - WAIT for Checkpoint 3 confirmation
***
## Final Assessment
The **fundamental thesis remains intact** with the French political crisis intensifying EUR weakness. However, **technical confirmation is still required** as the critical 1.6200 support has held firm. The **oil price recovery** and **Canadian employment surprise** create short-term headwinds but don't invalidate the medium-term setup.
**Patience is required** - this is exactly the type of disciplined approach your institutional checklist demands. Wait for clean confirmation rather than forcing a trade that hasn't fully materialized yet.
(www.nytimes.com)
(www.reuters.com)
(www.aljazeera.com)
(markets.businessinsider.com)
(tradingeconomics.com)
(www.marketwatch.com)
(global.morningstar.com)
(www.exchangerates.org.uk)
(wise.com)
(ppl-ai-file-upload.s3.amazonaws.com)
(tradingeconomics.com)
(www.reuters.com)
(wise.com)
(think.ing.com)
(www.poundsterlinglive.com)
(www.ecb.europa.eu)
(www.abc.net.au)
(finance.yahoo.com)
(www.ecb.europa.eu)
(www.cnn.com)
(www.investing.com)
(wolfstreet.com)
(www.france24.com)
(www.ofx.com)
(www.rba.gov.au)
(www.tradingview.com)
(www.truenorthmortgage.ca)
(www.goodreturns.in)
(stockinvest.us)
(myperch.io)
(www.mitrade.com)
(equalsmoney.com)
(www.tradingview.com)
(www.eia.gov)
(www.investing.com)
(www.bankofcanada.ca)
(au.investing.com)
(www.fastbull.com)
(www.bankofcanada.ca)
(oilprice.com)
(www.fxempire.com)
Commodity Supercycles and Resource ScarcityIntroduction
Commodities—ranging from energy and metals to agricultural products—are the essential building blocks of the global economy. Their prices fluctuate based on demand and supply dynamics, technological progress, and macroeconomic cycles. However, history reveals that commodity markets often experience prolonged periods of rising and falling prices known as “commodity supercycles.” These cycles, typically lasting decades, reflect fundamental transformations in the world economy—industrial revolutions, rapid urbanization, or structural shifts in demand.
In recent decades, economists and investors have increasingly linked commodity supercycles to resource scarcity, the growing challenge of balancing finite natural resources with the expanding needs of humanity. As population growth, industrialization, and the transition to green technologies intensify, questions about the sustainability of resource use have become central to global economic planning.
This essay explores the concept of commodity supercycles, their historical patterns, causes, and implications, as well as the relationship between these cycles and resource scarcity. It also examines how emerging trends such as renewable energy, recycling technologies, and geopolitical tensions are shaping the next possible supercycle.
Understanding Commodity Supercycles
A commodity supercycle refers to a long-term, broad-based price boom across multiple commodities, driven by structural shifts in global demand. Unlike short-term price fluctuations due to seasonal or cyclical economic activity, supercycles typically last 20 to 40 years. They are usually tied to periods of rapid industrialization or technological transformation that cause sustained increases in commodity consumption.
For example, the post-World War II reconstruction era, the 1970s oil shocks, and the China-led industrialization of the 2000s each corresponded with major supercycles. These booms were followed by extended downturns as supply caught up with demand or economic growth slowed.
Economists identify three key phases of a commodity supercycle:
Expansion Phase – Rising demand, limited supply, and increasing investment in resource extraction.
Peak and Plateau Phase – Supply gradually expands, demand growth stabilizes, and prices reach their highest levels.
Contraction Phase – Oversupply, slowing demand, and technological changes drive prices down over a long period.
Each phase reflects deep economic transformations that go beyond traditional business cycles, often linked to the rise and fall of global powers, demographic shifts, and major infrastructure booms.
Historical Overview of Commodity Supercycles
1. The 19th Century Industrial Revolution Cycle (1850–1914)
The first recognized supercycle was driven by the Industrial Revolution in Europe and North America. Rapid urbanization, rail expansion, and mechanized manufacturing led to soaring demand for coal, iron, steel, and agricultural commodities.
Technological innovation in steam engines, metallurgy, and transportation created a massive pull on global resources. Colonization expanded access to raw materials, but prices still rose sharply due to unprecedented demand. This cycle ended with the onset of World War I and the Great Depression, which collapsed trade and industrial output.
2. The Post-World War II Boom (1945–1973)
The second major supercycle followed World War II, driven by reconstruction in Europe and Japan, the rise of suburbanization, and the U.S. economic boom. Infrastructure projects, automobiles, and consumer goods required steel, copper, oil, and agricultural commodities. The Bretton Woods system, which stabilized exchange rates, and the establishment of multilateral trade institutions like the IMF and World Bank, supported global growth.
The cycle peaked with the 1973 oil crisis, when OPEC’s embargo sent oil prices skyrocketing, causing inflationary pressures and economic slowdown.
3. The China-Driven Supercycle (2000–2014)
The most recent supercycle was fueled by China’s industrialization and urbanization after joining the World Trade Organization (WTO) in 2001. Massive infrastructure spending, steel production, and construction caused an extraordinary demand surge for iron ore, copper, aluminum, coal, and oil.
Prices of most commodities reached historic highs between 2008 and 2011. However, by 2014, a slowdown in China’s growth and global oversupply brought the cycle to an end. The collapse in oil and metal prices marked the beginning of a prolonged downturn.
Causes of Commodity Supercycles
Several structural forces interact to create supercycles. The most significant include:
1. Industrialization and Urbanization
Periods of intense industrial expansion, such as in 19th-century Britain or 21st-century China, lead to sharp increases in commodity demand. Infrastructure development, housing, and manufacturing all require raw materials, creating upward pressure on prices.
2. Demographic Growth
Population booms in emerging economies increase demand for food, energy, and housing. For example, post-war baby booms and the rise of the global middle class have repeatedly expanded resource consumption.
3. Technological Innovation
Technological revolutions both create and destroy demand for commodities. The internal combustion engine increased oil demand; renewable technologies now increase demand for lithium, nickel, and copper. These transitions often reconfigure global trade flows.
4. Supply Constraints
Commodity supply is slow to adjust due to long investment cycles, geological limitations, and political instability. For instance, developing a new copper mine can take over a decade. Limited supply elasticity amplifies the impact of demand shocks.
5. Geopolitical and Policy Factors
Wars, trade restrictions, or resource nationalism can tighten supply and intensify price cycles. The 1970s oil crisis and recent Russia-Ukraine conflict illustrate how geopolitics can trigger commodity surges.
Resource Scarcity: A Growing Challenge
Resource scarcity refers to the limited availability of natural resources relative to human demand. This scarcity is not only physical but also economic—driven by rising extraction costs, environmental degradation, and geopolitical constraints.
1. Physical and Geological Limits
Many commodities, especially fossil fuels and certain metals, exist in finite quantities. As high-quality reserves are depleted, extraction becomes more expensive and energy-intensive. For example, new oil discoveries have declined steadily since the 1980s, raising concerns about “peak oil.”
2. Environmental Constraints
Mining, deforestation, and fossil fuel extraction cause environmental damage and carbon emissions. Climate change policies now restrict resource exploitation, creating a trade-off between economic growth and sustainability.
3. Economic and Political Constraints
Resource access is often limited by political instability, nationalization of assets, and export controls. Countries with critical resources may use them for strategic leverage, increasing global scarcity risk.
4. Water and Food Scarcity
Beyond metals and energy, water and arable land are becoming increasingly scarce. Global warming, desertification, and pollution threaten agricultural productivity, leading to food security challenges and potential social unrest.
The Link Between Supercycles and Resource Scarcity
Supercycles often exacerbate resource scarcity. During expansion phases, intense demand leads to rapid depletion of reserves, environmental damage, and overexploitation. As production costs rise, prices increase, creating feedback loops that sustain the cycle.
Conversely, resource scarcity can trigger new supercycles by increasing extraction costs and limiting supply. For example, the transition to renewable energy requires massive amounts of critical minerals like lithium, cobalt, and rare earth elements—resources that are themselves scarce and geographically concentrated.
This dynamic interplay means that resource scarcity is both a driver and a consequence of commodity supercycles. As one resource becomes scarce, economies adapt by shifting demand to substitutes—sometimes triggering new cycles in different commodities.
Case Studies: Resource Scarcity in Action
1. Oil and Energy Scarcity
Oil remains the world’s most important commodity. Periods of high prices, such as during the 1970s and 2000s, reflected both demand surges and fears of resource exhaustion. While technological innovations like fracking temporarily alleviated scarcity, geopolitical risks and environmental constraints continue to threaten long-term supply stability.
2. The Green Energy Transition and Critical Minerals
The global push toward decarbonization has created massive demand for metals such as lithium, nickel, cobalt, and copper. Electric vehicles (EVs), solar panels, and batteries rely on these inputs. However, these minerals are heavily concentrated in a few countries—such as the Democratic Republic of Congo (cobalt) and Chile (lithium)—raising concerns over future bottlenecks and new forms of resource dependency.
3. Water Scarcity and Agricultural Commodities
Climate change-induced droughts are reducing freshwater availability for irrigation. In regions like South Asia and Africa, this threatens food production and could trigger volatility in agricultural commodity markets such as wheat, rice, and soybeans. As populations grow, the risk of food inflation and social instability rises.
The Emerging 21st-Century Supercycle
Many analysts believe the world may be entering a new commodity supercycle, driven by structural transformations such as green industrialization, digital infrastructure, and geopolitical realignments.
Key Drivers:
Energy Transition – The shift from fossil fuels to renewables increases demand for transition metals and critical minerals.
Geopolitical Fragmentation – Resource nationalism, trade wars, and sanctions are disrupting supply chains, raising production costs.
Reindustrialization in the West – Efforts to “reshore” supply chains and reduce dependency on China are spurring domestic infrastructure investment.
Global Population and Urban Growth – With the world population surpassing 8 billion, resource demand for housing, energy, and food remains robust.
However, this new supercycle differs from past ones—it is shaped by sustainability imperatives, technological advances, and decarbonization policies. While demand for green metals is booming, fossil fuel demand may plateau or decline, making this supercycle more selective and diversified.
Economic and Market Implications
1. Inflationary Pressures
Sustained commodity price increases can fuel inflation, especially in emerging economies reliant on imports. The 2021–2023 period illustrated how energy and food shortages contributed to global inflation spikes.
2. Investment Opportunities
Supercycles create profitable opportunities in mining, energy, and infrastructure sectors. Investors anticipate long-term demand by financing exploration and extraction. However, volatility remains high, requiring risk management strategies.
3. Shifts in Global Power
Resource-rich nations—such as Australia, Chile, and Saudi Arabia—gain geopolitical leverage during supercycles. Conversely, resource-dependent importers face economic vulnerability and trade deficits.
4. Technological Innovation
Scarcity stimulates innovation. Rising commodity prices encourage investment in recycling, substitution, and efficiency technologies. For example, advances in battery chemistry aim to reduce reliance on cobalt.
Managing Resource Scarcity: Sustainable Pathways
To mitigate the risks of resource scarcity and stabilize future supercycles, policymakers and industries must pursue sustainable resource management strategies.
1. Circular Economy
Recycling and reusing materials can reduce pressure on primary extraction. The shift toward a circular economy—where waste becomes input—offers a long-term solution to resource depletion.
2. Technological Substitution
Innovation can replace scarce materials with more abundant ones. For instance, sodium-based batteries may reduce dependence on lithium, and carbon composites may replace steel in some applications.
3. Diversification of Supply
Developing multiple sources for critical materials reduces geopolitical dependency. Collaborative international frameworks can ensure more equitable resource distribution.
4. Resource Efficiency
Improving energy and material efficiency across industries can lower demand growth. Smart grids, energy-efficient buildings, and sustainable farming techniques play key roles.
5. Global Governance and Cooperation
International institutions must coordinate policies for resource management, ensuring fair trade, transparent supply chains, and environmental protection. Initiatives like the Extractive Industries Transparency Initiative (EITI) promote responsible mining and investment.
Conclusion
Commodity supercycles are more than economic phenomena—they are reflections of humanity’s evolving relationship with the planet’s resources. Each cycle marks a phase of industrial transformation, technological progress, and social change. Yet, they also expose the vulnerabilities of a world dependent on finite natural assets.
As we enter a new era defined by climate imperatives, energy transitions, and population growth, resource scarcity is likely to be the defining economic and political challenge of the 21st century. Whether this results in instability or innovation depends on how effectively societies manage the delicate balance between consumption and conservation.
Future supercycles may not be characterized by endless extraction, but by smart utilization, circular economies, and technological breakthroughs. In this sense, the path ahead requires not only economic foresight but also environmental responsibility—because managing resource scarcity wisely will determine the sustainability of global growth itself.
Horizen (ZEN) Eyes Bullish Continuation as Momentum Builds
ZEN, the native token privacy-focused blockchain Horizen known for its zero-knowledge proof infrastructure, is displaying notable resilience amid recent market turbulence.
The token has rebounded strongly since last week’s downturn, signaling renewed investor confidence.
Technical indicators on the daily chart highlight this shift in sentiment. Readings from the Moving Average Convergence Divergence (MACD) show the MACD line crossing above the signal line — a classic bullish signal that suggests growing buy-side momentum.
This crossover indicates that demand for ZEN is beginning to outpace selling pressure, hinting at the potential for further upward movement if momentum sustains.
ETH Recovery Phase — Key Level 3,800After last week’s crash, the price is now trying to recover.
The key level for this week is 3,800 — as long as we stay above it, the price remains in an upward correction. A minor break and quick recovery won’t change much, but if the price fails to reclaim 3,800 and breaks 3,645 , there’s a high probability of continued decline toward 3,000 .
A full recovery will come after breaking 4,390 , which would greatly increase the chances of seeing a new ATH.
DXY: Strong Growth Ahead! Long!
My dear friends,
Today we will analyse DXY together☺️
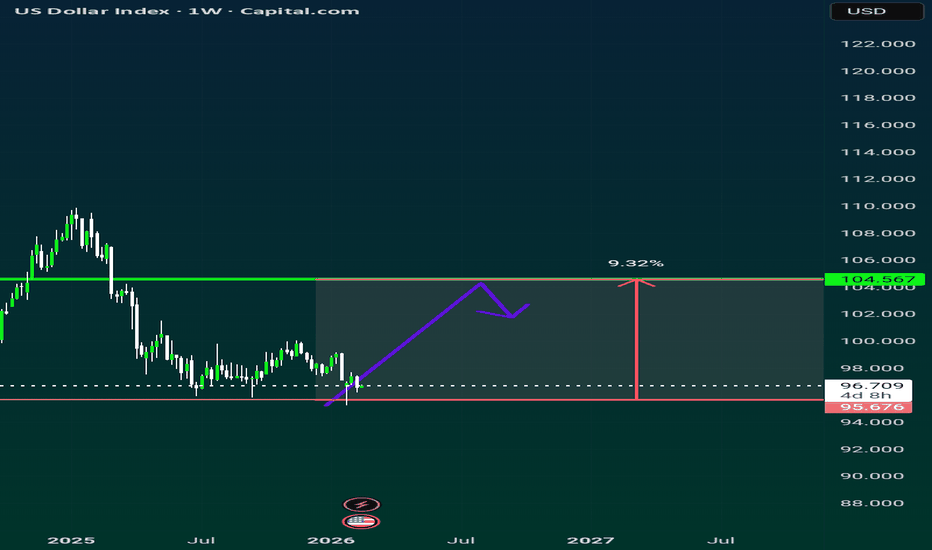
The recent price action suggests a shift in mid-term momentum. A break above the current local range around 98.869 will confirm the new direction upwards with the target being the next key level of 98.977 and a reconvened placement of a stop-loss beyond the range.
❤️Sending you lots of Love and Hugs❤️
BITCOIN NETWORK ACTIVITY INDEX. GUIDE DOG THAT STILL ISN'T BLINDWere you still fantasy dreamed about super-duper hyped Crypto and Tech names, or recently were wiped out already when prices changed each second on Friday, October 10, 2025 even faster rather then video clips do it in TikTok Reels or for example YouTube Shorts?..
...but there're several important issues that you should know.
Well.. lets talk about Bitcoin Network Activity Index, and why this one is guide dog that helps you to alive, not staying blind in the Galaxy of uncertainity.
Green Light. Red Light. Both Colours Blind.
Guide dogs (colloquially known in the US as seeing-eye dogs) are assistance dogs trained to lead people who are blind or visually impaired around obstacles. Although dogs can be trained to navigate various obstacles, they are fully red–green colour blind and incapable of interpreting street signs. The human does the directing, based on skills acquired through previous mobility training.
The handler might be likened to an aircraft's navigator, who must know how to get from one place to another, and the dog is the pilot, who gets them there safely.
Understanding Network Activity Index.
While time to time crypto candles change colours on your monitors even faster rather then video clips do it in TikTok Reels or for example YouTube Shorts, there should be a comprehensive metric designed to measure the overall safety and health of the Bitcoin network.
That is Bitcoin Network Activity Index specially designed by CryptoQuant by aggregating several important blockchain indicators.
These indicators include the number of active addresses (sending, receiving and both together), transaction counts, unspent transaction outputs (UTxOs), average block size, and other on-chain transactional data. This index provides a quantifiable overview of how much usage and engagement the Bitcoin blockchain is experiencing at any given time.
Bictoin Network Activity Index. How it works
The index serves as an important tool for understanding the fundamental dynamics of Bitcoin beyond just price movements. It captures the transactional activity and network participation that underpin Bitcoin’s value as a decentralized digital asset. For example, increases in the Network Activity Index often coincide with periods of rising Bitcoin price and heightened market enthusiasm, while decreases can indicate slowing demand, bearish sentiment, or periods of consolidation where market participants are holding rather than actively trading.
Significantly, the CryptoQuant Network Activity Index has been shown to correlate historically with Bitcoin's price action. When transaction volume, active addresses, and other network engagement measures rise, it can signal growing adoption and usage, which creates natural buying pressure and supports price increases. Conversely, sharp declines in network activity have often preceded or occurred alongside Bitcoin price drops, reflecting waning market interest or corrections.
Relations with Bictoin price action.
An example of network activity importance is the noted 600,000 daily transactions threshold highlighted by CryptoQuant analysts. This activity level appears to act as a “price engine” trigger, where surpassing it tends to lead to continued price rallies. Thus, rising transaction counts robustly indicate rising underlying demand on the network, which is a bullish sign for Bitcoin’s price.
However, it is important to note that network activity by itself does not determine price direction in isolation. Bitcoin’s price is influenced by a mix of factors including macroeconomic conditions, regulatory developments, market speculation and institutional activiry.
And yet, network activity remains a key fundamental indicator that helps market participants gauge the genuine level of usage and interest in Bitcoin, providing insights about market sentiment and potential price trends.
Conclusion.
In summary, the Bitcoin Network Activity Index is crucial because it quantifies Bitcoin’s on-chain operational health and user engagement, which are leading indicators of the asset’s intrinsic demand and valuation. Monitoring this index allows investors, analysts, and traders to make more informed predictions about Bitcoin’s future price action by understanding shifts in real network usage and investor behavior rather than relying solely on price charts or external market narratives.
Were you happy about it or not, but Bitcoin Network Activity Index still sits shy under its 52-week SMA, all the year 2025, while average number of active BTC addresses recently reached 52-week lows (compare with BTC price, that is still far above its 52-weeks lows).
--
Best 'be careful in the night' wishes,
@PandorraResearch Team
#SEI/USDT — Triangle Pattern Breakout Ahead?#SEI
The price is moving within a descending channel on the 1-hour frame, adhering well to it, and is heading for a strong breakout and retest.
We have a bearish trend on the RSI indicator that is about to be broken and retested, which supports the upward breakout.
There is a major support area in green at 0.1950, which represents a strong support point.
We are heading for stability above the 100 moving average.
Entry price: 0.2110
First target: 0.2210
Second target: 0.2324
Third target: 0.2456
Don't forget a simple matter: capital management.
When you reach the first target, save some money and then change your stop-loss order to an entry order.
For inquiries, please leave a comment.
Thank you.