Coiled Spring or Trap?SOL $86 | Bollinger Squeeze in a Downtrend -- Coiled Spring or Trap?
February 16, 2026
Fear & Greed at 12. SOL is down from $94 to $86, bleeding alongside the broader market. But the Bollinger bands just squeezed to 2.3% bandwidth -- the tightest compression in weeks. Every trader knows what comes after a squeeze: a big move. The question is which direction.
━━━━━━━━━━━━━━━━━━━━━━━━━━━━━━
WHY SOL, WHY NOW
━━━━━━━━━━━━━━━━━━━━━━━━━━━━━━
Two things make SOL interesting in this fear environment:
1. The Bollinger squeeze. Bandwidth at 2.3% is compression territory. SOL's ATR is 1.16% -- still decent daily range even as volatility contracts. When bands get this tight, the subsequent expansion is usually violent. The direction is the unknown, but the move is coming.
2. Trend strength paradox. ADX is at 34.5 with trend direction DOWN -- that's a strong downtrend. But ADX measures the strength of the trend, not how long it has left. A high ADX near a volatility squeeze often signals the trend is about to exhaust, not accelerate. The regime detector is only 42% confident in "ranging" -- it's conflicted too.
SOL has higher annualized vol than BTC (57.3% vs 37.2%), which means both the risk and the reward of catching this squeeze are amplified.
━━━━━━━━━━━━━━━━━━━━━━━━━━━━━━
WHAT DERIVATIVES ARE SAYING
━━━━━━━━━━━━━━━━━━━━━━━━━━━━━━
The derivatives picture is thin but telling:
● Taker buy ratio at 51.8% -- balanced, no clear aggression from either side
● No significant OI divergence flagged -- positioning is not extreme
● Funding screener: no extreme funding rates on SOL -- the trade is not crowded
● Only 1 liquidation recently, a long, $462 -- absolutely quiet
Compare this to BTC where taker buy ratio is 60.8% with buyers pushing hard. SOL is in a holding pattern. Neither longs nor shorts are committed. This is classic pre-squeeze behavior -- everyone is waiting.
━━━━━━━━━━━━━━━━━━━━━━━━━━━━━━
REGIME & TREND
━━━━━━━━━━━━━━━━━━━━━━━━━━━━━━
Regime detector says: RANGING, 42% confidence .
● ADX at 34.5 -- moderate-strong trend (still DOWN)
● SMA20 at $85.67, SMA50 at $87.17 -- bearish alignment, SMA20 below SMA50
● Trend direction: DOWN, strength 1.0 (max)
● Volatility NORMAL: ratio 0.90x, z-score -0.89
● Historical vol: 57.3% annualized
The regime is saying mean reversion, but the trend strength at 1.0 (maximum) is a warning: this has been a powerful downmove. Mean reversion works until it doesn't.
━━━━━━━━━━━━━━━━━━━━━━━━━━━━━━
TECHNICALS
━━━━━━━━━━━━━━━━━━━━━━━━━━━━━━
BINANCE:SOLUSDT at ~$86 on Binance Futures.
● RSI(14) at 49.5 -- perfectly neutral, dead center
● MACD histogram at +0.09 -- barely bullish, essentially flat
● Bollinger %B at 0.70 -- upper half of the squeeze range
● Bollinger bandwidth at 2.3% -- squeeze
● Price below VWAP ($93.87) -- significantly below institutional average
● ATR at 1.16% -- healthy daily movement
● Hurst at 0.29 -- mean-reverting, consistent with range-bound behavior
Everything is neutral. RSI at 49.5, MACD flat, %B mid-range. This is a coin waiting for a catalyst. The squeeze is the setup; the break will determine direction.
━━━━━━━━━━━━━━━━━━━━━━━━━━━━━━
KEY LEVELS
━━━━━━━━━━━━━━━━━━━━━━━━━━━━━━
Support:
● $85.67 -- SMA20
● $84.68 -- Bollinger lower band (squeeze break target if bearish)
● $80.00 -- psychological support, major level
Resistance:
● $86.65 -- Bollinger upper band (squeeze break target if bullish)
● $87.17 -- SMA50 (key reclaim level)
● $93.87 -- VWAP (major target on a sustained move)
━━━━━━━━━━━━━━━━━━━━━━━━━━━━━━
THE SETUP
━━━━━━━━━━━━━━━━━━━━━━━━━━━━━━
Bias: NEUTRAL -- wait for squeeze resolution
This is a conditional trade. Don't enter the squeeze. Enter the break .
Bullish break (if price closes above $87.17 / SMA50):
Entry: $87.20-87.50
● T1: $90.00 (+3.2%)
● T2: $93.87 (VWAP, +7.6%)
Stop: $85.50 (below SMA20, -2.0%)
R:R to T1: ~1:1.6, to T2: ~1:3.8
Bearish break (if price closes below $84.68 / BB lower):
Entry: $84.50-84.00
● T1: $82.00 (-3.0%)
● T2: $80.00 (-5.3%)
Stop: $86.00 (back inside the bands, +1.8%)
R:R to T1: ~1:1.7, to T2: ~1:3.0
Important: SOL's 57.3% annualized vol means these targets can be hit fast. Use smaller size than you would on BTC. A 1% account risk means roughly half the position size.
━━━━━━━━━━━━━━━━━━━━━━━━━━━━━━
RISKS
━━━━━━━━━━━━━━━━━━━━━━━━━━━━━━
● BTC correlation: if BTC breaks $66K, SOL likely goes to $80 regardless of its own setup
● Macro risk-off is active. VIX rising, SPX falling. Alt-coins get hit hardest in risk-off
● Trend strength at 1.0 means the downtrend has been relentless. Fading a max-strength trend is dangerous
● VWAP at $93.87 is 9% above current price -- that's a lot of overhead supply from underwater longs
● Squeezes can resolve with a fakeout: a break in one direction followed by a sharp reversal
Watch for the candle that closes outside the bands on volume. That's your signal, not the first wick.
━━━━━━━━━━━━━━━━━━━━━━━━━━━━━━
BOTTOM LINE
━━━━━━━━━━━━━━━━━━━━━━━━━━━━━━
SOL is coiled. A Bollinger squeeze with perfectly neutral oscillators in extreme market fear means a big move is loading. The downtrend says short, but the squeeze says wait. Derivatives show no crowded positioning -- neither side is committed, which means the break will catch people off guard.
Don't guess the direction. Let the squeeze break tell you. A close above SMA50 ($87.17) is the bull signal. A close below BB lower ($84.68) is the bear signal. Until one of those happens, this is a coin in limbo.
Manage your risk. NFA.
Data collected February 16, 2026.
Trend Analysis

ORCL ORDERS FEB 2026ORCL (1D) is drifting lower into a clear demand pocket (150–155). The prior 180–200 area acted as supply/rejection, suggesting distribution overhead while bids absorb dips near support.
Options/order zones by expiration (institutional framing):
* FEB: Sell Calls (supply) 180–200 | Sell Puts (demand) 148–155
* MAR: Sell Calls (supply) 170–300 | Sell Puts (demand) 115–140
* APR: Sell Calls (supply) 190–480 | Sell Puts (demand) 110–150
* MAY: Sell Calls (supply) 190–380 | Sell Puts (demand) 110–140
Targets:
* # Target up: reclaim 165–170 -> 180–190 (then 200–205 if supply breaks)
* # Target down: lose 150 -> 145 (then 140–135 into next demand)

The Market Is Terrified But Nobody Is Actually SellingBTC $69,300 | The Market Is Terrified But Nobody Is Actually Selling
February 16, 2026
Fear & Greed sits at 12 -- extreme fear for seven straight days. Headlines scream "worst Q1 since 2018." But look past the panic. The options market is telling you something different. Max pain is right here at $69K, put/call ratio is neutral, and taker buy ratio just hit 60.8%. Someone is buying this fear.
━━━━━━━━━━━━━━━━━━━━━━━━━━━━━━
WHAT THE NEWS IS SAYING
━━━━━━━━━━━━━━━━━━━━━━━━━━━━━━
It's wall-to-wall bearish:
1. BTC is down 22% in Q1 , on track for the worst start to a year since 2018. CoinTelegraph ran a "$75K or bearish regime shift?" headline today. Crypto funds logged their fourth consecutive week of outflows at $173M.
2. But the smart money is positioning differently. Michael Saylor signaled another BTC buy. Strategy (formerly MicroStrategy) went on record saying they can survive even if BTC drops to $8,000 and will "equitize" their debt. Metaplanet revenue jumped 738% -- 95% from Bitcoin. BlackRock's digital assets head warned about leverage-driven volatility but hasn't reduced their IBIT position.
The narrative split is clear: retail is scared, institutions are loading.
━━━━━━━━━━━━━━━━━━━━━━━━━━━━━━
OPTIONS & DERIVATIVES
━━━━━━━━━━━━━━━━━━━━━━━━━━━━━━
This is where it gets interesting.
● DVOL at 50.89, up from 48.47 yesterday -- implied vol rising but still in normal range
● Put/Call ratio at 0.74 -- neutral, no panic hedging
● Max pain at $69,000 -- we're sitting right on it (-0.45% away)
● 25-delta skew at +15.12 -- puts are expensive relative to calls (fear_puts_expensive)
● Put IV 76% vs Call IV 61% -- market willing to pay 15% more for downside protection
Translation: options traders are nervous (skew shows fear), but they're not positioned for a crash (PCR is neutral and we're at max pain). The skew is a contrarian indicator -- when everyone buys puts, the move often goes the other way.
Taker buy ratio at 60.8% -- aggressive buyers dominating market orders. This is not a market that's selling into the fear.
Recent liquidations: only 3 BTC liquidations, all longs, $4,900 total. No cascade, no forced selling event.
━━━━━━━━━━━━━━━━━━━━━━━━━━━━━━
REGIME & TREND
━━━━━━━━━━━━━━━━━━━━━━━━━━━━━━
Regime detector says: RANGING, 49% confidence .
● ADX at 25.2 -- weak trend, market is indecisive
● SMA20 at $68,654, SMA50 at $69,356 -- bearish cross (SMA20 below SMA50)
● Trend direction: DOWN, strength 0.66
● Volatility NORMAL: ratio 0.93x, z-score -0.7
● Historical vol: 37.2% annualized
The regime recommendation is mean reversion with normal stops. This is not a trending market -- it's chopping around in a range, which means breakout trades are risky and dip-buys have better odds.
━━━━━━━━━━━━━━━━━━━━━━━━━━━━━━
TECHNICALS
━━━━━━━━━━━━━━━━━━━━━━━━━━━━━━
BINANCE:BTCUSDT at ~$69,300 on Binance Futures.
● RSI(14) at 57.7 -- neutral, slight bullish lean
● MACD histogram at +99.06 -- bullish crossover in progress
● Bollinger %B at 1.15 -- above upper band, short-term overbought
● Price below VWAP ($73,043) -- still weak vs institutional average cost
● ATR at 0.69% -- low daily range, compression before a move
● Hurst at 0.28 -- mean-reverting, good for range trading
The conflict: MACD just crossed bullish and RSI has room, but price poked above the upper Bollinger band and remains below VWAP. This looks like a short-term relief rally within a larger downtrend -- not yet a trend reversal.
━━━━━━━━━━━━━━━━━━━━━━━━━━━━━━
MACRO ENVIRONMENT
━━━━━━━━━━━━━━━━━━━━━━━━━━━━━━
Macro bias: RISK OFF
● VIX at 20.54, up 18.3% on the week -- fear is rising in equities too
● SPX down 1.85% on the week
● DXY sideways at 97.02 -- mild headwind for crypto
● US 10Y yield falling to 4.06% -- flight to safety
● Gold holding at $5,019 -- safe haven demand intact
● USDJPY at 153.34, falling -- carry trade unwinding continues
● SKEW index at 139 -- elevated tail risk hedging
This week: Fed rate-decision minutes due, Hive and Riot earnings reports. Any hawkish surprise or mining company weakness could add selling pressure.
━━━━━━━━━━━━━━━━━━━━━━━━━━━━━━
KEY LEVELS
━━━━━━━━━━━━━━━━━━━━━━━━━━━━━━
Support:
● $68,655 -- SMA20 / BB middle
● $68,099 -- Bollinger lower band
● $66,000 -- psychological level, major support zone
Resistance:
● $69,356 -- SMA50 (critical reclaim level)
● $69,212 -- Bollinger upper band
● $73,043 -- VWAP (institutional level)
━━━━━━━━━━━━━━━━━━━━━━━━━━━━━━
THE SETUP
━━━━━━━━━━━━━━━━━━━━━━━━━━━━━━
Bias: CAUTIOUS NEUTRAL with bullish lean
This is not a clear long or short. It's a range. Trade it like one.
Entry zone (long): $68,000-68,600 (SMA20 / BB lower area on a pullback)
Targets:
● T1: $69,356 (SMA50, +1.1%)
● T2: $71,000 (+3.2%)
● T3: $73,000 (VWAP area, +6.3%)
Stop: $66,800 (below BB lower and psychological support, -1.7%)
R:R to SMA50 is tight at about 1:0.6. To $73K it's roughly 1:3.7. Only worth taking from the lower end of the range.
Important: this is a mean-reversion setup in a ranging market with a macro risk-off backdrop. Size conservatively. Don't chase the bounce above the upper BB.
━━━━━━━━━━━━━━━━━━━━━━━━━━━━━━
RISKS
━━━━━━━━━━━━━━━━━━━━━━━━━━━━━━
● Macro risk-off is active and VIX is climbing. Any equity sell-off could drag BTC below $66K
● Fed minutes this week: any hawkish surprise means yields up and risk assets down
● Four straight weeks of crypto fund outflows ($173M) -- institutional money is leaving, not entering
● The SMA20 is below SMA50 -- the trend technically still points down
● Max pain at $69K creates a gravity well, but that's only until the Feb 17 expiry. After that, new strikes dominate
━━━━━━━━━━━━━━━━━━━━━━━━━━━━━━
BOTTOM LINE
━━━━━━━━━━━━━━━━━━━━━━━━━━━━━━
Fear is at 12 for a week straight, but the liquidation data is quiet, taker buys are dominant, and options positioning shows nervousness without panic. The regime says range, not crash. Saylor is buying, Metaplanet is printing revenue, and BTC is sitting right on max pain.
This doesn't look like capitulation. It looks like accumulation dressed up as fear. But the macro is ugly, the SMA structure is bearish, and fund flows are negative. Don't hero-long this. Wait for $68K or a clean reclaim of SMA50 at $69,356 before committing size.
Manage your risk. NFA.
Data collected February 16, 2026.

AAPL (H4): Pullback Within Larger Impulsive StructureOn the 4-hour chart, AAPL appears to be undergoing a corrective retracement following a well-defined impulsive advance. The broader structure still favors a higher-degree bullish count.
Price is currently reacting near the 0.382 retracement region, an area that often serves as a shallow corrective floor in strong uptrends. A sustained hold above this level would support the view that the recent weakness is corrective rather than structural deterioration. Under this scenario, the market may be carving out wave (a) of iv, with scope for a temporary bounce before a possible final dip toward the 0.5–0.618 zone.
The 243 area is technically significant. A decisive break below this region would increase the probability of a deeper retracement, exposing the 0.5 and 0.618 levels as potential completion zones for wave iv. However, unless the broader impulse invalidation level is breached, the dominant structure remains constructive.
If wave iv completes within the highlighted Fibonacci cluster, the next impulsive leg higher (wave v), could target the 1.618 extension near the 320 region under the alternative (iii) projection. Such a move would align with typical fifth-wave expansion behavior following a controlled fourth-wave retracement.
In summary, AAPL’s 4H structure suggests a corrective phase within a still-intact bullish framework. The key focus remains on whether current support stabilizes price, setting the stage for continuation toward higher extension targets.

Apollo Hospitals Enterprise🏥 Stock: Apollo Hospitals Enterprise
💰 Trade Plan
CMP: ₹7618
Stop Loss: ₹6677
Targets:
🎯 ₹7980
🎯 ₹8794
🎯 ₹10090
Defined structure. Defined risk. Upside conditional on breakout.
📊 Technical Structure
Strong rally from ₹6803 → ₹8099 (All-Time High)
Healthy correction toward 61.8% Fibonacci retracement
Buyers stepping in near Fib zone
Now showing upside traction
If price sustains above ATH ₹8099, probability shifts towards fresh all-time highs.
This is a classic:
Impulse → Controlled correction → Attempted trend resumption
Breakout + sustain = expansion phase.
📌 Trading Approach (Read Carefully)
High volatility → keep quantity light
Staggered entry, no lump-sum aggression
Strict position sizing
This is a patience trade, not a chase
Ignore noise & news flow — price > opinion
SL must be respected at all costs
No emotional attachment.
No prediction game.
Only structure and risk control.
⚠️ Clarification:
This is an independent analysis based purely on technical and market study. No part of Religare is involved in this view or recommendation.
📝 Important:
I am not responsible for any loss or profit incurred. I am not taking any fees for these views – just sharing my analysis for educational and informational purposes.
📉 Disclaimer:
Not SEBI-registered. Please do your own research or consult a financial advisor before taking any investment decision.

ORCL FEB 2026ORCL remains in a clear downtrend, with price rejecting below the 175–180 supply band and still capped by the larger distribution shelf near ~190. The bounce off ~145 looks like short-covering/absorption into prior demand, but bulls need acceptance back above 175–180 to shift control.
Institutional flow read: heavy distribution overhead (notably around ~190), while the 145 base is acting as the current defense line. If 145 breaks, expect sellers to press into the next liquidity pocket.
Targets:
* Upside target: 175–180 reclaim/hold -> 200 (gap fill). Extension if momentum holds: 245–272 (larger gap zone).
* Downside target: lose 145 -> 120–110. If 110 fails -> 100, then 95–85.

Excellent Profits on re-Buy ordersAs discussed throughout my last week's commentary: 'My position: I have done excellent re-Buy orders throughout yesterday's session especially Buying #5,027.80 rejection to the upside which delivered #5,057.80 extension where I closed my set of Buying orders in Profit. This morning I have Bought #5,006.80, and closed my order on #5,027.80 extension. Also followed with #5,022.80 - #5,027.80 / #100 Lot re-Buys. Bottom line my practical suggestion is to continue Trading with re-Buy zones and close the orders at will. #5,042.80, #5,027.80, #5,012.80, #5,002.80 key entry points.'
My position: My each session starting by making key re-Buy points (of course, I am not Selling Gold at least more than a Year) as I turn all my attention to Buying. I am making spectacular Profits on Intra-day basis, especially on Thursday's session where Gold dipped aggressively and I Bought in extension local Low's on multiple occasions. Friday's session #4,985.80 set of Buying orders delivered excellent Profits and now I do await Lower Values on Gold to Buy more. Keep in mind that today is Bank holiday and Volume will be less than usual so tomorrow's session will bring decent moves. Keep Buying / never Sell for maximum Profit.

NZD/USD Bullish Reversal Toward 0.60581 and 0.60729The NZD/USD 45-minute chart shows a recent shift from a downtrend to a potential bullish breakout. Price had been moving under a descending trendline, forming lower highs and lower lows. However, strong buying pressure appeared around the 0.6025–0.6030 support zone, marked by multiple rejection candles and higher lows. Buyers defended this demand area several times, indicating accumulation. The pair has now broken above the falling trendline and is consolidating near 0.6040, suggesting bullish momentum is building. If price holds above the breakout zone, further upside is likely. The first target is 0.60581, where minor resistance is expected. If momentum continues, the second target stands at 0.60729, representing the next key resistance level and a potential continuation of the upward move.

CMG | Bearish Structure Developing Under Descending ResistanceChipotle has been making a series of lower highs since the $45+ region, with a clear descending trendline acting as dynamic resistance on the daily timeframe. The recent relief rally from the $30 area appears to be losing momentum as price approaches confluent resistance.
Key observations:
The current bar structure is printing 2-Down (Short) with a Ready Down signal, suggesting sellers are stepping back in after the bounce. Price is sitting at approximately $36.30, caught between an ascending support trendline from the lows and the descending resistance from the highs — a compression pattern that typically resolves with a directional break.
The broader trend remains bearish with a score reflecting sell-side pressure. What's notable is the confluence of filters aligning on the bearish side, including momentum and mean reversion — which adds weight to the directional bias when they agree.
Levels I'm watching:
38.71 area — invalidation zone above recent structure; a reclaim here would shift the thesis
36.66 — near-term support that needs to break for continuation
34.59 — measured target based on the current range structure
Upper resistance ~45 — descending trendline origin and prior breakdown level
Scenario A — Bearish continuation: If the ascending trendline support around $36 fails to hold, the next leg down likely targets the mid-$34 area. Volume confirmation on the breakdown would add conviction.
Scenario B — Relief rally first: Price could squeeze toward the $38–39 zone before rolling over, which would actually provide a higher-probability entry for those watching for shorts at better risk/reward.
Scenario C — Invalidation: A daily close above $38.71 with momentum flipping would negate the bearish structure and suggest the relief rally has more legs.
Worth watching how this compression resolves over the coming sessions.
This post reflects our personal analysis for educational purposes only and is not financial advice. Always do your own due diligence and manage risk accordingly.

USD/JPY Short-term Intraday Buy🔹 Context
Strong bullish impulse. Current pullback into high-volume area (previous POC).
Higher timeframe structure remains bullish.
🔹 Confluence
• Previous session POC
• Value Area Low support
• Pullback into prior accumulation
• No aggressive selling expansion
Absorption > distribution.
🔹 Entry
Buy on reclaim of mid-value / micro structure shift.
Expecting rotation toward VAH / recent highs.
🔹 Invalidation
Acceptance below Value Area Low.
🔹 Risk
1% risk
Minimum 1:2 RR
SL below structural low.

BTC Analysis Whats Going On Right Now__FOLLOW FOR MORE UPDATES.NOT A FINANCIAL ADVICE.
NARRATIVE
BTC Just Raid The Major Weekly Liquidity (Support Level). If We Look Here For Shorts, Thats
Hell Of The Madness . Why I'm Telling You Not To Sell Here Because When A Support Broke
Institutions Closes Their Net Shorts And Starts To Go Counter Party To the Major Inducement (Traders They Are Selling The Breakout).
ANALYSIS
+Support That I Mark With Orange Rectangle Is Influential To Offer Through OLD Weekly SSLQ (Weekly Support That Is Ripped). Or The +BISI (Buy Side Imbalance Sell Side Ineffeciency) Is Marked With Burgundy Color Is Utilized For Pyramid Purpose . When We Offer Through Old Weekly SSLQ, I Marked Resistance In Orange This Is Influential To Re-raid The Old Weekly Liquidity, Want To See This Resistance Treated As Support (+Mitigation Block).
REMEMBER
Every Gap I Marked Can Be Reclaimable, You Can Use Again When Reclaimed If Ripped. Or Remember When Price Failed A Specific Price Gap You Can Place A Mitigation Limit Order Right At 50% Of That Gap.
:) Have A Nice Day *FOLLOW FOR MORE*

Rivian Shares Spike 26% As It Predicts Big Jump in Sales Summary
1. Rivian shares jumped more than 25% Friday after the electric vehicle maker reported better-than-expected quarterly results and issued a rosy outlook for sales growth.
2. Plans to launch its R2 SUV are still on track for the second quarter, and Rivian said it will announce details about the R2 and other products at an event on March 12.
A solid fourth quarter and ambitious plans for 2026 sent Rivian stock soaring Friday.
Rivian (RIVN) shares jumped more than 25% after the electric vehicle maker narrowly topped revenue estimates at $1.29 billion, while recording a smaller adjusted loss than analysts had forecast at 54 cents per share.
The company said its plans to start selling the R2, an SUV that will be cheaper than its current vehicles, remain on track for the second quarter. Rivian said that more details about its product lineup will be coming at a March 12 event.
Rivian expects to deliver between 62,000 and 67,000 vehicles this year, a more than 50% jump at the midpoint from the 42,247 it delivered in 2025. The company hopes software upgrades and its new model can help drive demand that has slowed in the U.S. after the Trump administration allowed EV tax credits to expire last September.
Technically, shares of NASDAQ:RIVN are set to break above the celing of a bullish symmetrical triangle eyeing the $20 resistant.

#CHR/USDT READY TO NEW EXPLODE !#CHR
The price is moving within a descending channel on the hourly timeframe. It has reached the lower boundary and is heading towards a breakout, with a retest of the upper boundary expected.
The Relative Strength Index (RSI) is showing a downward trend, approaching the lower boundary, and an upward bounce is anticipated.
There is a key support zone in green at 0.0520. The price has bounced from this level several times and is expected to bounce again.
The RSI is showing a trend towards consolidation above the 100-period moving average, which we are approaching, supporting the upward move.
Entry Price: 0.0257
Target 1: 0.0266
Target 2: 0.0276
Target 3: 0.0286
Stop Loss: Below the green support zone.
Remember this simple thing: Money management.
For any questions, please leave a comment.
Thank you.

AMZN (H1): Bearish Continuation Scenario in FocusOn the 1-hour timeframe, AMZN appears to be transitioning from a corrective recovery phase into a renewed impulsive decline. The structure suggests that the recent advance may have completed a Wave 2 (or wave b in an alternative count), with price now rolling over into a potential Wave 3 or wave c sequence.
The rejection near the 0.786 retracement level (around 248.88) adds weight to the bearish interpretation. That level acted as a technical ceiling, reinforcing the idea that the prior bounce was corrective rather than the start of a sustained bullish reversal.
Several unfilled gaps remain overhead, but unless price reclaims the upper imbalance zone decisively, these gaps are more likely to serve as resistance rather than magnets in the immediate term. The true invalidation of the bearish count sits at where wave (1) is located. A sustained move through that region would force a reassessment of the wave structure.
If the current interpretation holds, the next downside objective aligns with the lower imbalance zone around the 176 area, which could complete a larger Wave C (or wave 3) leg. Momentum expansion typically follows consolidation breakdowns, and the current posture suggests downside pressure is building.
In summary, AMZN on the 1H chart is showing early signs of impulsive bearish continuation. Any short-term rebounds should be evaluated within the context of a broader corrective-to-impulsive transition unless key resistance levels are reclaimed.

XAUUSD H21️⃣ Market Structure Overview
Phase 1 – Distribution → Impulse Sell
Price was compressing under a descending trendline.
Large bearish impulse broke structure and created a clear FVG.
Liquidity was swept below the prior LOW (4878 area).
Phase 2 – Reversal + ChoCH
After the liquidity grab, strong bullish displacement.
Clear ChoCH printed on H2.
Structure shifted from bearish to short-term bullish.
That 4878–4895 area was the smart money accumulation zone (your “PLAN BUY $$$” area makes sense).
2️⃣ Current Positioning
Price is now:
Holding above 0.5 (4978)
Respecting 0.618 (4949) as key demand
Trading just below descending resistance
This is classic:
Impulse → Pullback → Continuation setup
But we are at a decision area.
3️⃣ Key Levels to Watch
🔵 Demand Levels
4978 (0.5) – intraday support
4949 (0.618) – stronger reaction zone
4895 (0.9) – last line of defense
4878 LOW – invalidation of bullish structure
🔴 Supply / Targets
5046 – intermediate resistance
5099–5100 – major target (liquidity above highs)
The 5099 area aligns with:
External liquidity
Premium zone
Projected continuation leg
4️⃣ Likely Scenarios
🟢 Bullish Continuation (Higher Probability for Now)
As long as price:
Holds above 4949
Does not close H2 below 0.618
We can expect:
Small pullback / internal liquidity sweep
Expansion toward 5046
Continuation toward 5099–5100
Your drawn path reflects this well.

DXY Technical Strength, Fundamental UncertaintyDXY Technical Strength, Fundamental Uncertainty
We need to be very careful with DXY. After the NPF data, the USD strengthened because the NFP data came out better than expected.
According to many news reports, the US employment report for January dashed hopes for a short-term interest rate cut by the Federal Reserve.
However, we all know that the FED has made it clear several times that it is not interested in cutting rates anytime soon.
So this interpretation is very old. So why was the USD stronger? Shouldn’t it have been stronger after the FOMC when Powell made this clear during the meeting?
Personally, I think the DXY could fall again due to Trump’s actions. I don’t think the USD is ready to get stronger unless Trump stops making strange comments.
The chart looks like it could go up, but I am not optimistic about the USD.
You may find more details in the chart.
Thank you and good luck! 🍀
❤️ If this analysis helps your trading day, please support it with a like or comment ❤️

What Are Order Blocks and Why They Matter — Complete SMC GuideWhat Are Order Blocks and Why They Matter — Complete SMC Guide
Most BTC traders have heard the term "Order Block." Few actually understand what it is, how it forms, and why price reacts at those zones. This guide exists to change that.
What is an Order Block?
An Order Block is the last candle (or group of candles) of consolidation before an impulsive move that generates a Break of Structure. It is not just any box drawn on the chart. It is a specific zone where institutional activity left a structural footprint — unfilled orders, pending liquidity, an imbalance that the market needs to revisit.
At the fund where I worked on the algorithmic execution side, we did not use the term "Order Block." We called it an order accumulation zone or pending liquidity cluster. But the concept is identical: identify where large participants left open positions that the market will eventually need to fill.
How does a valid Order Block form?
Not all Order Blocks deserve your attention. A valid OB requires three things:
1) Displacement: After the consolidation, there must be an impulsive move — large-bodied candles with little to no wick. That indicates institutional urgency, not retail noise.
2) Break of Structure (BOS): That impulsive move must break a prior swing high or swing low. Without a BOS, there is no confirmation of structural change. And without structural change, your "Order Block" is just a box on the chart.
3) Imbalance / Fair Value Gap: The move out of the OB frequently leaves an FVG — a three-candle gap where price moved so fast that there were no transactions in both directions. That gap acts as a magnet: price tends to return to fill it.
Why does it work?
The market is an auction mechanism. Its job is to facilitate transactions at the most efficient price. When an impulsive move leaves unfilled orders (the OB) and a liquidity void (the FVG), the market has a structural reason to return. It is not magic. It is not conspiracy. It is market mechanics.
Mark Douglas wrote that an edge is nothing more than an indication of a higher probability that one thing will happen over another. That is exactly what a valid Order Block offers: not a certainty, but an elevated probability based on structure, not opinion.
Example on BTC 4H:
Look at the chart. On February 8, BTC rallied to $72,271 — the local swing high after bouncing from the $60,000 zone. There was consolidation between $70,000 and $72,271 on February 8-9. That last consolidation before the impulsive move down is the supply-side Order Block.
The displacement followed immediately: from February 9 through February 12, price dropped over $7,000 in large-bodied bearish candles with minimal wicks. The move broke below the prior swing low, confirming a bearish BOS. Along the way, it left multiple Fair Value Gaps — three-candle imbalances where price moved too fast for bidirectional exchange.
The swing low was printed on February 12 at $65,118. Price has since recovered to $68,636 — still below the equilibrium at $68,695. If price continues higher and enters that supply OB zone near $70,000-$72,271, watch for a reaction. Not a certainty — a probability. The structure is either respected or it is not. That is the discipline this approach requires.
How I use this in my trading:
The SMC Pro DOE indicator detects these setups automatically. It scans OB formation, validates the BOS, maps FVGs, and marks confluence on the chart without subjective interpretation. It has two modes:
1) Aggressive Mode: Enters when price reaches a valid OB. More trades, 49% win rate, but with favorable risk-reward that generates +49% net P&L in backtesting (with commissions).
2) Selective Mode: Requires OB + FVG + additional confirmation. Fewer trades, 62% win rate, profit factor of 2.35.
Both modes are backtested on BTC 4H from January 2023 through February 2026. With 0.075% commission per trade. No repainting. The numbers are on the script page.
Conclusion:
Order Blocks are not magic lines. They are high-probability zones based on market structure. Learning to identify them correctly — with displacement, BOS, and FVG confluence — is what separates structural analysis from subjective chart art.
If you want to see how the indicator identifies these setups in real time, it is available for free on my profile.
Disclaimer: This is not financial advice. Past performance does not guarantee future results. Always trade with proper risk management.
Tags: orderblocks, smartmoney, SMC, education, tutorial, BTC, Bitcoin, FVG, liquidity, priceaction, ICT, marketstructure, institutionaltrading, BOS, trendanalysis

XAU / USD 2 Hour Chart ( Sell In Progress )Hello traders. As per my previous analysis, I took the trade, marked on the chart. I always use the same formula. Close most of the trade's profit after 40 pips, move my SL to my entry point or below, so there is no loss / break even. And then I leave the rest of the trade, the 25% I did not close, running as my runner. Done for the day. Happy Monday , Be well and trade the trend. Big G gets my thanks.

ZAMA/USDC – Potential Trend Shift & Upside ScenarioAfter a strong bearish move, price may be building a base and transitioning into a short-term uptrend. If bullish momentum continues, a move toward higher resistance zones is possible, with invalidation below the recent structure lows.

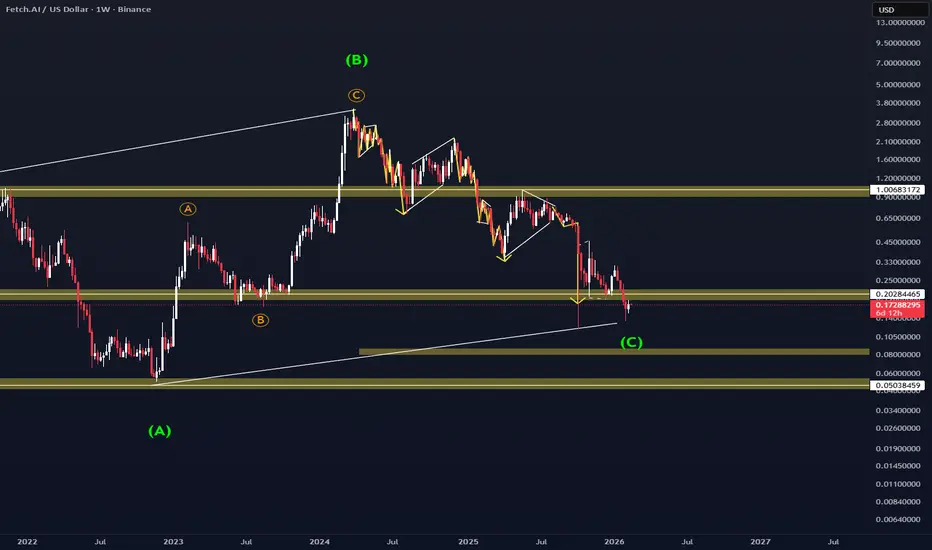
FETCH.AI - Bullish Momentum Expected Above $0.20 Weekly Close📊 Technical Analysis - FETCH.AI (FET/USD)
Looking at the current chart structure, FET is showing interesting price action with key Wave patterns forming. Based on my analysis:
🔑 Key Observation:
The price is currently trading around $0.17, and I'm watching the critical $0.20 level closely.
📈 Bullish Scenario:
If we get a WEEKLY CLOSE above $0.20, I expect to see strong bullish momentum develop. This level has been acting as a significant resistance zone, and a weekly close above it would signal:
✅ Breakout confirmation
✅ Potential trend reversal
✅ Higher timeframe bullish structure
🎯 What I'm Watching:
- Weekly candle close above $0.20 (key trigger)
- Volume confirmation on the breakout
- Support/resistance zones marked on the chart
- Elliott Wave structure completion (the big ABC corrective pattern)
⚠️ Risk Management:
As always, wait for confirmation and manage your risk accordingly. A weekly close is more significant than intraday spikes.
💡 This is not financial advice - just sharing my technical perspective on FET.
👍 What do you think? Are you bullish or bearish on FET?
💬 Drop your price targets in the comments below!
❤️ If you found this analysis helpful, hit that LIKE button and FOLLOW for more crypto insights!
#FETUSD #FetchAI #CryptoTrading #TechnicalAnalysis #ElliottWave
Beginner Guide - How to Read EMAs on the Sentinel Core (15m)Sentinel Core uses three layers of structure:
🟡 EMA 21 → Short-term control
🔵 EMA 50 → Structural filter
🔴 EMA 200 → Macro bias
You always read them in that order:
200 → 50 → 21 → then price behavior
1️⃣ EMA 200 (Red) — Macro Bias
This is your environment filter.
On your chart:
EMA 200 is sloping down
Price is trading below it
That immediately tells you:
👉 Macro bias = bearish
👉 We prefer shorts
👉 Longs are lower probability unless structural shift occurs
Rule:
Above EMA 200 = constructive environment
Below EMA 200 = defensive / bearish environment
You do NOT fight the 200.
2️⃣ EMA 50 (Blue) — Structural Filter
This tells you if structure is trending or rotating.
On your left side:
EMA 50 is clearly sloping down
Price respects it as resistance
That confirms:
👉 Bearish structure alignment
When price retraces into EMA 50 and rejects → continuation probability increases.
If EMA 50 goes flat → environment weakens.
3️⃣ EMA 21 (Yellow) — Short-Term Control
This is momentum.
On your chart:
EMA 21 stays below EMA 50
Pullbacks remain shallow
Candles respect 21 during impulses
That tells you:
👉 Sellers are in short-term control
👉 Momentum is aligned with structure
If EMA 21 crosses above 50 and holds → structural shift warning.
🔎 What Happens in Compression?
See marked this well on your chart.
When:
EMA 21 & 50 compress tightly
Candles overlap
No clear higher high / lower low
Sentinel Core reduces probability.
That is a no-trade zone.
EMAs separating = expansion
EMAs compressing = chop
🧠 How To Read Your Chart Specifically
Early section:
Price below EMA 200
21 < 50
Clean downward slope
→ Bearish continuation phase
Mid section:
21 and 50 compress
Price rotates sideways
→ Reduced probability environment
Right section:
Still below 200
50 acting as resistance
→ Bearish bias remains intact
No structural shift occurred because:
Price never reclaimed 200
21 never sustainably held above 50
No bullish expansion sequence
So Sentinel Core would grade this as:
Defensive / Bearish Structure with rotational pauses.
🔐 The Golden Rule
You do not trade crosses.
You trade alignment + separation + structure.
Alignment = 21 & 50 positioned correctly
Separation = volatility expansion
Structure = higher high / lower low confirmation
All three must agree.
Sentinel Core does not predict.
It grades alignment.
Structure first.
Momentum second.
Execution last.
#XAUUSD #Gold #EMA #Scalping #Intraday #TrendStructure #SentinelCore #PriceAction

great opportunity to buy an hold.Solano is at a great key level to enter. The price has a reversal channel on the weekly chart. The price is at the weekly key level. You can see that the Stoch. is giving a reversal signal. It's not 100% certain that the price will explode upwards now, but this is a great key level to buy more and hold until the run returns.
