GOLD Price Update – Clean & Clear ExplanationGold is a strong bullish structure after forming a clear higher high–higher low sequence. Price has respected multiple demand zones, confirming sustained buying interest after the earlier in the session.
The recent breakout above the 5,040–5,050 resistance zone signals strength. Price is now pulling back slightly, indicating a healthy retracement rather than weakness. This pullback into the marked demand zone suggests a potential continuation move.
Bullish Scenario:
If price holds above the demand area and shows confirmation, upside targets lie near 5,110–5,150, where prior supply and liquidity reside.
Bearish Risk:
A breakdown below 4,970–4,950 would invalidate the bullish bias and may lead to a deeper correction toward lower demand zones.
“If you come across this post, please like, comment, and share. Thanks!”
Trend Analysis

GBPUSD buy opportunity 1️⃣ MARKET STRUCTURE (BIG PICTURE)
Bias: BULLISH → CORRECTIVE → BULLISH CONTINUATION LOADING
What price did:
Strong impulsive bullish move up (structure break)
Then entered a descending channel → this is a bullish correction, not a reversal
Price has now tapped the lower channel + demand
Reaction upward already started
📌 Key insight:
Descending channel = pullback in an uptrend
This is where smart money reloads longs
1️⃣ MARKET STRUCTURE (BIG PICTURE)
Bias: BULLISH → CORRECTIVE → BULLISH CONTINUATION LOADING
What price did:
Strong impulsive bullish move up (structure break)
Then entered a descending channel → this is a bullish correction, not a reversal
Price has now tapped the lower channel + demand
Reaction upward already started
📌 Key insight:
Descending channel = pullback in an uptrend
This is where smart money reloads longs
2️⃣ KEY SUPPORT & RESISTANCE (PRICE ACTION ONLY)
🟩 SUPPORT ZONES (BUY AREAS)
🟢 Major Demand Zone
1.3500 – 1.3550
Origin of strong bullish impulse
Multiple reactions
Channel low aligns here (confluence)
This zone already did its job.
🟢 Minor Support (Intraday)
1.3600 – 1.3630
Short-term base
Acts as flip zone
🟥 RESISTANCE ZONES (TARGETS)
🔴 Resistance 1
1.3740 – 1.3760
Internal structure high
Mid-range liquidity
🔴 Resistance 2 (Major)
1.3820 – 1.3870
Previous distribution zone
Upper range liquidity
Where sellers previously stepped in
This is main TP magnet.
3️⃣ TRADE SETUP (HIGH-PROBABILITY LONG)
✅ PRIMARY IDEA: BUY CONTINUATION
You are trading:
✔ Trend
✔ Pullback
✔ Demand
✔ Channel low
That’s elite PA alignment.
📍 ENTRY (Aggressive → Conservative)
Option A (Aggressive):
Buy between 1.3600 – 1.3650
Option B (Conservative):
Buy on 4H bullish close above 1.3700
Or LTF bullish break + retest
🛑 STOP LOSS (SL)
Below: 1.3500
Why:
Below demand
Below channel structure
Below higher low → invalidates bullish idea
🎯 TAKE PROFITS (TP)
🎯 TP1
1.3740
Partial close
Secure risk
🎯 TP2
1.3820
Strong resistance
High probability reaction
🎯 TP3 (Runner)
1.3870 – 1.3900
Liquidity sweep potential
Only if momentum stays strong
4️⃣ RISK–REWARD CHECK
Risk ≈ 100–150 pips
Reward ≈ 250–400+ pips
R:R = 1:2.5 → 1:3+
This is textbook swing PA.

61.8% Fib resistance ahead?NZD/JPY is rising towards a pullback resistance at the 61.8% Fibonacci retracement, which could reverse the move and trigger our take profit.
Entry: 94.56
Why we like it:
There is a pullback resistance level that aligns with the 61.85 Fibonacci retracement.
Stop loss: 94.97
Why we like it:
There is a swing high resistance level.
Take profit: 93.73
Why we like it:
There is an overlap support level that aligns with the 61.8% Fibonacci retracement.
Enjoying your TradingView experience? Review us!
Please be advised that the information presented on TradingView is provided to Vantage (‘Vantage Global Limited’, ‘we’) by a third-party provider (‘Everest Fortune Group’). Please be reminded that you are solely responsible for the trading decisions on your account. There is a very high degree of risk involved in trading. Any information and/or content is intended entirely for research, educational and informational purposes only and does not constitute investment or consultation advice or investment strategy. The information is not tailored to the investment needs of any specific person and therefore does not involve a consideration of any of the investment objectives, financial situation or needs of any viewer that may receive it. Kindly also note that past performance is not a reliable indicator of future results. Actual results may differ materially from those anticipated in forward-looking or past performance statements. We assume no liability as to the accuracy or completeness of any of the information and/or content provided herein and the Company cannot be held responsible for any omission, mistake nor for any loss or damage including without limitation to any loss of profit which may arise from reliance on any information supplied by Everest Fortune Group.

Bitcoin Short-term Long and Long-term ShortIn this video, I gave a walkthrough on the wave counts for bitcoin, revising on the big picture cycle level count, and then go into details on the 5-waves breakdown of the down move in Bitcoin.
I believe that Bitcoin will rally in a correction and move up to $80,472, the first resistance set by the previous wave 3 low and then go down for a wave C with the first target of $49,350. But that is not the ultimate target. The ultimate target sees Bitcoin falling to around $15,000, which is the cycle wave 2 low.
Good luck!

AUD/USD Volume Profile Rejection Level + FVG Confluence (0.6923)Price on AUD/USD M30 shows a strong rejection of lower prices followed by a sharp reversal, signaling aggressive buyers. Volume Profile reveals a heavy volume cluster near the rejection low, marking where buyers stepped in. The planned long entry is at 0.6923 — the start of that volume cluster. This level is strengthened by nearby Fair Value Gap confluence, making it a high-probability pullback zone.

S&P500 Free Signal! Sell!
Hello,Traders!
SPY taps a well-defined supply zone after buy-side liquidity grab. Clear bearish BOS and rejection from premium signal downside continuation toward sell-side liquidity.
--------------------
Stop Loss: 698$
Take Profit: 690$
Entry: 695$
Time Frame: 2H
--------------------
Sell!
Comment and subscribe to help us grow!
Check out other forecasts below too!
Disclosure: I am part of Trade Nation's Influencer program and receive a monthly fee for using their TradingView charts in my analysis.

XAUUSD (Gold) – 15m | Short-Bias Technical ObservationPrice recently delivered a strong impulsive bullish move, followed by a pullback from the recent high, indicating potential profit-taking and short-term exhaustion. The market has already reacted near a prior structure level (BOS area), which now appears to be acting as resistance.
The current pullback aligns with the Fibonacci Golden Zone (50%–61.8%), overlapping with a previous consolidation zone, suggesting this area may act as a decision zone rather than immediate continuation.
From a market-structure perspective:
The impulsive move has paused
Momentum is cooling after rejection from the high
Price is currently reacting within a premium zone, where sellers may become active if weakness continues
If price fails to reclaim the broken structure decisively, short-term downside pressure could extend toward lower liquidity levels. However, a strong bullish reaction from the highlighted zone would invalidate the short-bias and favor continuation.
📌 This is a technical observation, not a trade signal.
📌 Always wait for confirmation and manage risk accordingly.

NZDCHF Set To Grow! BUY!
My dear friends,
Please, find my technical outlook for NZDCHF below:
The instrument tests an important psychological level 0.4642
Bias - Bullish
Technical Indicators: Supper Trend gives a precise Bullish signal, while Pivot Point HL predicts price changes and potential reversals in the market.
Target - 0.4655
Recommended Stop Loss - 0.4633
About Used Indicators:
Super-trend indicator is more useful in trending markets where there are clear uptrends and downtrends in price.
Disclosure: I am part of Trade Nation's Influencer program and receive a monthly fee for using their TradingView charts in my analysis.
———————————
WISH YOU ALL LUCK

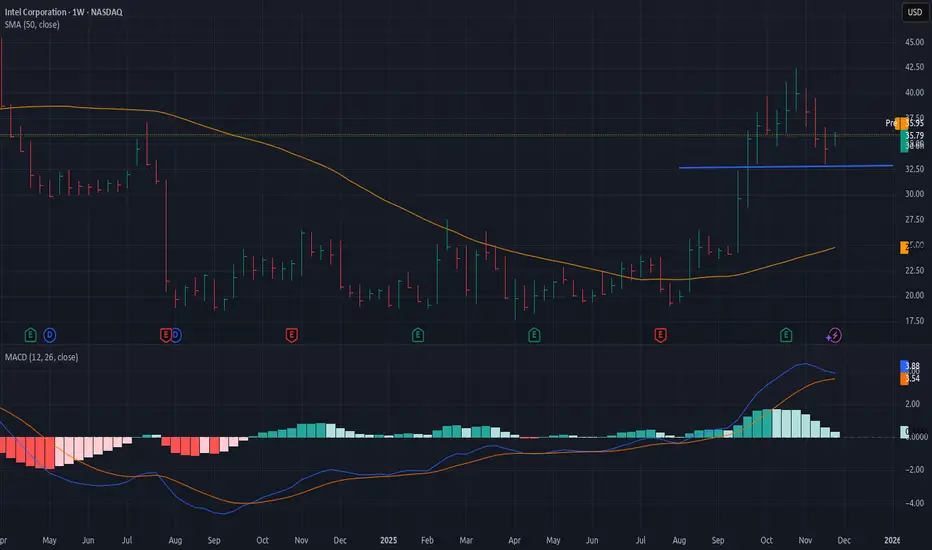
INTC mid-term TAIntel keeps building the strong uptrend on daily and weekly time frames and currently remains among the strongest in the semiconductor sector. It may move higher against the general market due to heavy bullish volumes and strong trend strength.

#HBAR—This HNS Structure Rarely Fails After Liquidity Is Taken
Yello Paradisers! -Are you noticing how HBAR is quietly setting a trap after taking liquidity exactly where most traders panicked and sold, and could this be the moment when patience finally pays off?
💎#HBAR forming a clean inverse head and shoulders pattern right at a previous support zone, which is a classic professional accumulation behavior. Before this structure started to develop, price deliberately swept liquidity below support, forcing out weak hands and triggering stop losses from inexperienced traders. This is exactly the type of environment where smart money likes to build positions.
💎After the liquidity sweep, we saw a sharp bullish impulse accompanied by strong volume. This move was crucial because it broke above the previous swing high of the left shoulder, which also aligned perfectly with horizontal resistance acting as the neckline. This is a strong technical confirmation that buyers are stepping in with conviction, not randomly.
💎At the moment, #HBAR is forming the right shoulder. What is important here is not speed but quality. Price is consolidating tightly while volume is clearly declining. This is a healthy sign, as it signals an absence of aggressive sellers. When price holds near the neckline without heavy selling pressure, it usually increases the probability of continuation to the upside rather than a breakdown.
💎The RSI already gave us an early warning signal. A bullish divergence formed between the left shoulder and the head, showing that downside momentum was weakening even while price was still moving lower. This divergence often appears before trend reversals and is another reason why this structure deserves close attention.
💎Another key detail is the neckline behavior itself. This level has already been tested three times, and each test weakens the ability of sellers to defend it. Repeated tests usually favor a breakout rather than rejection, especially when combined with declining volume during consolidation.
💎From a level perspective, major support is located around the 0.072 area. As long as the price holds above this zone, the bullish structure remains valid. On the upside, the major resistance sits near 0.135, with an intermediate resistance around 0.110 that may cause short-term reactions.
That's why Paradisers, we are playing it safe and focusing only on high-probability structures like this one. Strive for consistency, not quick profits. Treat the market as a businessman, not as a gambler. This is the only way you will make it far in your crypto trading journey and get inside the winner circle.
MyCryptoParadise
iFeel the success🌴

Paypal longPaypal is massively oversold on RSI and getting some momentum upwards. Time to start position yourselves in. What do you think guys?

USDCAD SELL TRADE PLANPAIR: USDCAD
DATE: 2026-02-09
PLAN ID: USDCAD_2026-02-09_v1
Analysis Time (UTC): 17:58 UTC
⸻
1) TRADE INTENT
Selling a pullback into unmitigated supply after a confirmed bearish shift, aiming for continuation into downside liquidity.
⸻
2) PLAN OVERVIEW
Market State: Transitioning → Trending (Bearish shift active)
Trade Model: Trend Continuation After Breakdown
Direction: SELL
Horizon: Intra-Day
Setup Grade: A
Plan Status: ✅ VALID
⸻
3) LEVELS CARD (Execution Section)
Setup Status
• Price State: FAR
• Execution Mode: Wait
• Zone Status: Fresh Tap Pending
Risk & Confidence
• Confidence: 74%
• Risk Per Trade: 1.0%
⸻
ENTRY PLAN
Primary Entry (Higher Probability — preferred execution)
• Entry 01: 1.36250–1.36400 zone
• Reason: Pullback into clean H1 supply (displacement origin) aligned with HTF bearish structure and liquidity above recent lower high
Secondary Entry: None included
⸻
TRADE PARAMETERS
• Stop Loss: 1.36560
• Take Profit Targets:
• TP1: 1.35500
• TP2: 1.34950
• TP3: Not included (no clean extended draw)
• Pre-Entry Invalidation: Break above 1.36600
Trigger Required:
• Valid confirmation trigger must appear
• Examples: BOS, CHOCH, strong engulfing, displacement, or rejection
• Confirmation valid on M15 (preferred), or M30 / H1 / H4 if first clean signal appears
Session Preference: London–NY Overlap
Order Type: Limit (pending setup — confirmation required)
⸻
4) MARKET CONTEXT
• H4 Structure: Recent bearish BOS and lower high confirms trend shift
• Liquidity Objective: Clean sell-side draw below Jan swing low at 1.34950
• Valid Zone: H1 origin of impulse tied to structure shift, untouched
• Invalidation Condition: Break and close above 1.36600 = bearish invalidation
⸻
5) FUNDAMENTALS & NEWS
• Verdict: ALIGNED
• Action: TRADE — No red news near execution window; CAD strength supported by commodities and risk tone
⸻
6) EXECUTION PROTOCOL
• If FAR: Wait for price to reach the 1.3625–1.3640 zone
• If NEAR: Prepare for execution and monitor M15–H1 for trigger
• If IN ZONE without trigger: Wait — do not preempt
• If trigger prints: Execute per confirmation
• If moved away: Stand aside — do not chase
• If invalidated: Cancel trade
⸻
7) RISK & POSITIONING
• No conflicting USD exposure noted
• Risk set to standard 1.0% — acceptable for intra-day short continuation
⸻
8) CONFIDENCE SUMMARY
Structure, zone, and liquidity alignment are clean — clear continuation play following a strong bearish shift.
⸻
9) FINAL EXECUTION NOTE
Wait for price to cleanly enter the supply zone.
Do not engage unless valid confirmation appears — BOS, CHOCH, engulfing, or clear rejection.
Stand aside if price runs early or invalidates structure.

SILVER FREE SIGNAL|SHORT|
✅SILVER rejection from premium supply after strong displacement. Bearish market structure shift signals mitigation lower, with sell-side liquidity resting below the range.
—————————
Entry: 83.27$
Stop Loss: 86.00$
Take Profit: 79.00$
Time Frame: 2H
—————————
SHORT🔥
✅Like and subscribe to never miss a new idea!✅

INTC long-term TAIntel is strong, it's a beautiful reversal of a downtrend on a long-term trend. Current uptrend is in correction and there's a distribution going on mid-term, which means now is not the best time to enter but considering strong weekly reversal INTC is something you should keep an eye on and pick up. The blue line for the support has been standing so far, we will see if it's going to be the lowest target in this correction.
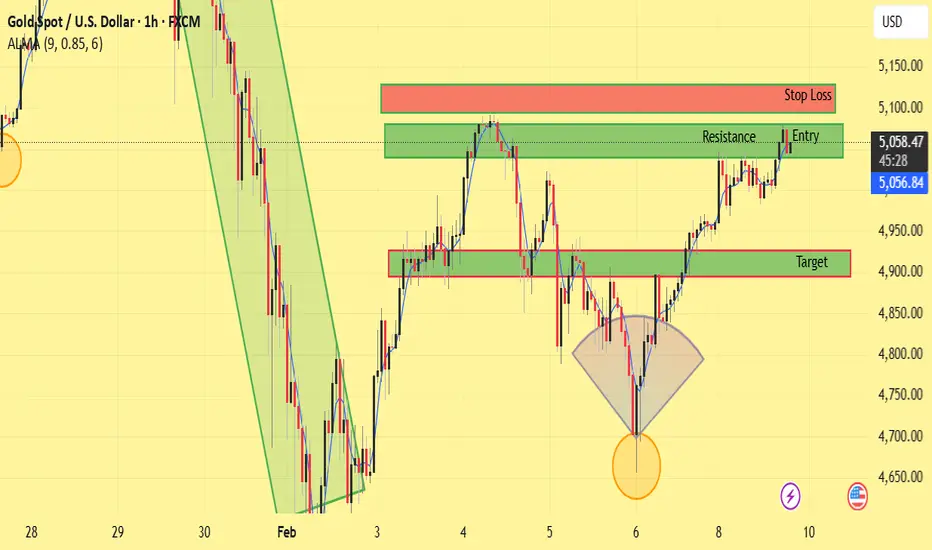
XAUUSD (Gold) – 1H Chart Analysis & Trade IdeaGold is currently trading within a short-term bullish structure after forming a clear reversal from the recent swing low. The price action shows higher highs and higher lows, supported by strong bullish momentum.
Technical Overview
Price previously sold off aggressively but found strong demand near the marked swing low, forming a V-shaped reversal.
After the reversal, gold broke above minor structure and continued to climb, confirming bullish continuation.
The current price is approaching a key resistance zone, which has been marked as the potential entry area.
This resistance zone also aligns with prior supply, increasing the probability of a short-term pullback.
Trade Idea
Entry: Sell from the marked resistance zone near 5,055–5,060
Stop Loss: Above the upper red zone (above resistance / liquidity area)
Target: The marked green demand zone around 4,900
Bias
Short-term: Bearish from resistance (pullback expected)
Invalidation: A strong bullish close above the resistance zone would invalidate the short setup and suggest continuation to higher levels.
This setup is based on support & resistance, market structure, and price reaction zones. Always wait for confirmation and manage risk accordingly.

EURUSD: The Rejection That Changes EverythingWe're at $1.18996 in premium territory, and the market just showed its hand. A brutal 58.6% upper wick rejection at $1.19005 printed a textbook shooting star—bears defended this level with conviction. The technical structure? Messy. Higher lows meet lower highs in choppy consolidation, but the rejection signal tips the scale.
1. THE TECHNICAL REALITY 📉
• Price compressed in tight 15-pip range over 24 hours—classic pre-breakout behavior
• Trading in PREMIUM zone closer to resistance than support
• Conflicting structure: higher lows (bullish) vs. lower highs (bearish) = consolidation
• Bearish OB supply zone at $1.18210-$1.18240 acting as concrete ceiling
2. THE INDICATORS ⚖️
Bearish Signals:
• MACD bearish divergence (histogram 0.0010 vs signal 0.0013)—momentum fading
• Shooting star candle with massive 58.6% upper wick at $1.19005
• Distribution pattern from premium zone rejection
Bullish Signals:
• ADX at 71.2 confirms strong trend in play
• Ascending support trendline at $1.18000 (29 touches) still active
• BOS bullish structure technically intact
The Conflict:
RSI dead neutral at 52.5 offers zero directional conviction. We're in no-man's land—strong trend strength but fading momentum creates decision paralysis.
3. THE TRADE SETUP 🎯
🔴 Scenario A: Distribution Breakdown
• Trigger: Confirmed breakdown below $1.18900 with momentum
• Entry: $1.18880 on retest
• Target 1: $1.18550 (40 pips)
• Target 2: $1.18240 (70 pips—bearish OB fill)
• Final Target: $1.18100 (support confluence)
• Stop: $1.18950 (50 pips)
🟢 Scenario B: Structure Flip
• Trigger: Bulls reclaim $1.18110 discount zone + CHoCH bullish
• Entry: 4H close above $1.18240
• Target: $1.18260 (weak high retest)
• Invalidation: Failure to hold above bearish OB at $1.18240
MY VERDICT
This is a 58% confidence setup—not high-conviction. The rejection wick and premium positioning favor shorts, but choppy structure demands smaller position sizing. Patience is the play. Don't force trades in consolidation. Wait for the market to show its hand: either a clean breakdown with momentum or a structural flip above $1.18240. React with precision, don't predict with hope.

QBTS long-term TAD-wave is going through the countertrend correction on weekly that has started about a month ago and it's almost done, mid-term is still broken so it needs more time to finally bottom out but there are plenty of resources on weekly time frame to continue the uptrend.

Gold consolidation remains bullish structureGold consolidation remains bullish after price action slowed and closed above the 5000 level. This behaviour suggests healthy digestion following the recent rally rather than trend exhaustion.
Gold prices rose today and tested the highest resistance level of the week. The move was supported by softer real yields, a weaker U.S. dollar, and renewed safe-haven demand ahead of key macroeconomic data.
Recent Federal Reserve signals have reinforced expectations for easier monetary policy. Comments from Fed official Mary Daly, indicating openness to one or two rate cuts, combined with risks of softer U.S. jobs and CPI data later this week, have increased bullish sentiment for bullion.
Tecnically, if bulls maintain control within the current range, a pullback toward the support zone is possible. As long as price holds this area and then achieves a daily close above 5060, upside momentum should strengthen. In that scenario, the next key resistance zone lies between 5130 and 5252.
You may find more details in the chart,
Trade wisely best of luck buddies.
Ps; Support with like and comments for better analysis Thanks for Supporting.

BTC range planwatching sub 50s, and fib 0.2 has to hold. This price zone corelates with #IBIT ETF initiation. Therefore, theoretically it has to take the low or double bottom for the potential entry.
I expect the institutions will rescue the price again over the pivot where they used to enter the BTC market but this time it will be ranging for building the solid base which will eventually hunt down the current ATH.

ONDS mid-term TAOndas is in very bullish formation on daily and weekly time frames, any corrections is a good opportunity to jump onboard. Currently mid-term is testing support area above ~$11ish area which could be a good entry point.

Gold trading plan!- Completed " 12345 " Impulsive Waves and " ABC " Corrective Waves
- Break of Structure
- Fibonacci Level - 78.60%
- Fair Value Gap
- Sell Side Liquidity

TSM long-term TATSM is still in a very strong and healthy bullish formation on weekly as of this moment and it's been so for the last few months. It has a lot of potential to go much higher.
