Gold - Preparing the final blow off top!💰Gold ( OANDA:XAUUSD ) will rally a final +20%:
🔎Analysis summary:
Just in January alone, Gold is up another +25% so far. Looking at this very bullish parabolic rally, Gold remains super strong and is still not done with the bullrun. Until Gold retests the ultimate resistance trendline, it can easily rally another +20% from the current levels.
📝Levels to watch:
$6,000
SwingTraderPhil
SwingTrading.Simplified. | Investing.Simplified. | #LONGTERMVISION
Trend Analysis

OG Fan Token OG to print 200% upside more to resistanceOn the above 8 day chart price action has corrected 90% since October on this football token.
Resistance is around 200% above current price action with RSI at ridiculously oversold levels for this timeframe. There's many more technical reasons for being bullish, but time is limited for usual waffle.
Is it possible price action falls further? Sure.
Is it probable? No.
Start scaling out after $8 or wait for a probability condition to print.
Ww
==============================================
Disclaimer
This idea is for educational and informational purposes only. It is not financial advice. Cryptocurrency trading carries significant risk of loss and is not suitable for all investors. Always conduct your own research (DYOR) and consider consulting a qualified financial advisor before making any investment decisions. Past performance is not indicative of future results.

AUDUSD Will Go Down! Short!
Take a look at our analysis for AUDUSD.
Time Frame: 4h
Current Trend: Bearish
Sentiment: Overbought (based on 7-period RSI)
Forecast: Bearish
The market is testing a major horizontal structure 0.697.
Taking into consideration the structure & trend analysis, I believe that the market will reach 0.689 level soon.
P.S
Please, note that an oversold/overbought condition can last for a long time, and therefore being oversold/overbought doesn't mean a price rally will come soon, or at all.
Like and subscribe and comment my ideas if you enjoy them!

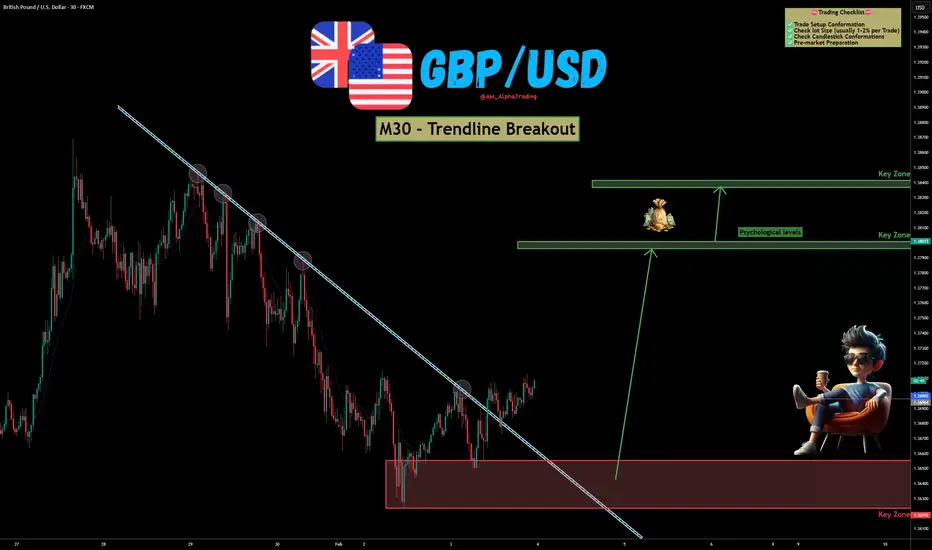
GBP/USD – Trendline Breakout | Bullish Reversal SetupGBP/USD has shown a clear breakout above a well-respected descending trendline on the M30 timeframe, hinting at a potential shift from bearish to bullish momentum. Price action is reacting strongly from a key demand zone, increasing the probability of continuation to the upside. OANDA:GBPUSD
📊 Technical Overview :
Price respected the descending trendline multiple times, confirming its validity.
The recent clean breakout and hold above the trendline suggests buyers are stepping in.
A strong base has formed at the lower demand zone, acting as a launchpad for the move.
Upside targets are aligned with psychological levels and higher-timeframe key zones, offering a favorable risk-to-reward setup.
As long as price holds above the breakout area, bullish continuation remains the preferred bias.
✅ Support this analysis with a
LIKE 👍 | COMMENT 💬 | FOLLOW 🔔
It helps a lot & keeps the ideas coming!
⚠️ Disclaimer: This analysis is for educational purposes only and does not constitute financial advice. Forex trading involves high risk. Trade only with capital you can afford to lose and always do your own research.
Potential Tether Dominance in PlayStablecoin dominance in general seems to be persistently rising over the past few months.
As of now, Tether's market cap seems to be potentially approaching the last key historical resistance zone.
It may also be a possibility that the last resistance zone does not sustain and new highs may be seen (if the last resistance zone does not hold).
This may lead to further bleeding in the overall crypto market.
A potential range of 8.28% - 11.548% may be possible estimates of Tether's Dominance based on previous characters of Tether Dominance bull rallies.
However, characters are subject to change so a dynamic approach would serve crypto bulls better.
Where do you think Tether Dominance takes a break?

Good zone for sell goldI think this area is a good sales opportunity. Let's see what happens. PRICE IS EVRY THING

BTC (Bitcoin) – Bearish MarketBITSTAMP:BTCUSD
Bitcoin is currently displaying bearish price behavior, with price respecting the 75,000 resistance zone and failing to establish acceptance above this level. Recent price action suggests selling pressure remains present near higher levels.
As long as BTC trades below this resistance area, the market maintains a bearish bias, with potential downside toward the 67,000 support zone. A shift in bias would require a clear reclaim and sustained acceptance above resistance.
This outlook is based solely on technical observations and represents a personal market perspective.
Disclaimer:
This analysis is provided for educational and informational purposes only.
It does not constitute financial advice. Market conditions can change at any time.
Always conduct your own analysis and apply proper risk management.

USDCHF - The Breakdown You Can’t Afford to IgnoreHello Traders! 👋
What are your thoughts on USDCHF?
This chart shows a bearish technical analysis for the USD/CHF (US Dollar vs. Swiss Franc) currency pair on a daily timeframe.
The overall sentiment is that the pair has broken below long-term support and is now showing signs of further weakness.
Key Takeaways
Bearish Breakdown: The price has fallen significantly below a long-standing consolidation range (the blue support zone around 0.7850).
Role Reversal: The previous "Support" (blue zone) is now acting as "Resistance." The red arrow indicates a "retest" of this level—a common technical pattern where price returns to a broken level before continuing lower.
Descending Trend: The purple lines highlight a series of "Lower Highs," indicating a sustained downward trend over the past several months.
Don’t forget to like and share your thoughts in the comments! ❤️

RKT road to 22$After a downtrend price is trying to stay above Fib 0.5 level. A close above $20 will push thé Price to 21-22$ in aprox 3 weeks.
NFA

BTCUSDsell now
dump it to 20k
1% risk on this trade
i will send more sells all month to add on
game time
i seen enough
listen to me
GOLD BREAKOUT - UPSIDE OR DOWNSIDE?Price is compressing near the trendline + technical bounce zone, indicating an impulsive move is coming. Watch for confirmation.
Bullish Breakout
• Buy above: 153,600 (above falling trendline)
• T1 157,800 - T2160,000
• Invalidation - below 152,000
Rejection & Breakdown
• Sell below: 152,000( Failure to hold technical bounce zone)
• Targets: 150,200 / 148,500 /146,800
• Invalidation reclaim above 153,600
Note: This is a decision zone. Trade only after confirmation. Volatility expansion likely in the next few candles.

You will ask, "how did he know Btc would crash to $60K"?On Saturday January 31st I suggested that Btc would crash (from current price at $78,716) to $60K (+/- $2K). This target at $60K (T2) was hit today.
I expect a significant bounce from here, as I often see when long term WTs are hit. There is another WT target just below at $52,683 (+/- $2K). This target may get hit on this dump, or possibly after a significant pump first. As always, I'm not trying to predict time, but these targets are accurate.
Congrats to everyone that set buy orders at T2, as Btc is already up 8% in the last hour, and we are safely under the trade with stops at break even. If T3 gets hit I'm going in even heavier.
May the trends be with you.

SilverXAGUSD
- Change of Characteristics
- Fair Value Gap
- Demand Zone
- Completed " 12345 " Impulsive Waves and " ABC " Corrective Waves
- Fibonacci Level - 78.60%

Bitcoin buying opportunity Bitcoin nearly 50% from its lows is running into 2021-2022 previous major weekly swing highs which should offer major support. Buying the panic in BTC.

BTCUSDT Strong Support ZoneBTCUSDT clear chart showing the weekly strong support zone based on fibonacci clusters .
Good LUck

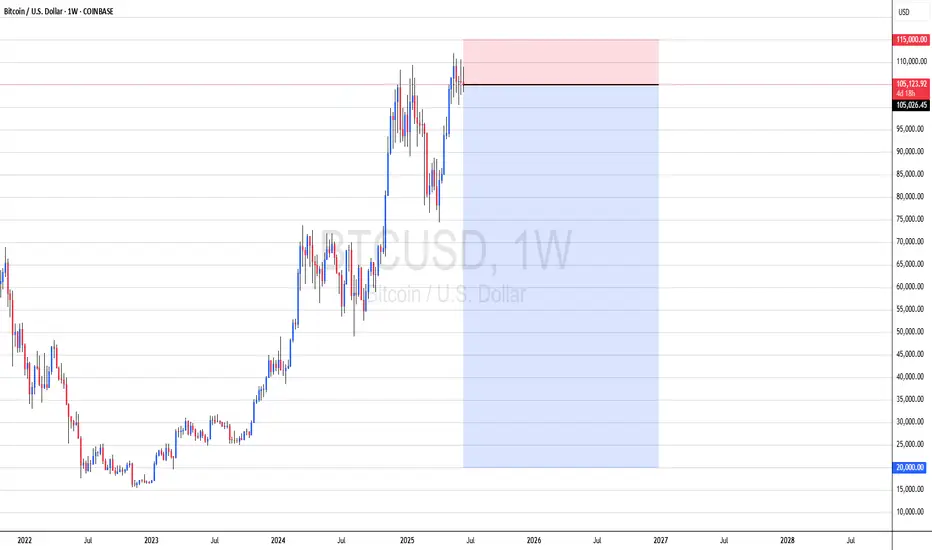
Bitcoin in a corrective phase after the euphoriaOn this weekly BTC/USD chart, we observe a reversal structure following a strong uptrend in 2024–2025, marked by the break of the ascending channel and a clear rejection below the previous highs around $110,000–$120,000.
The price has now returned to test a key support zone around $62,000–$66,000, formerly an accumulation area and market pivot, making it a decisive level for the next moves. As long as this support holds, a technical rebound toward $75,000 remains possible, corresponding to a former intermediate resistance.
Conversely, a clear break of this zone would open the way to a deeper correction toward major lower supports around $30,000, or even the extreme zone near $18,000, corresponding to the previous cycle’s lows.
The current dynamics remain fragile: the market has moved from a phase of euphoria to a corrective phase, and only a sustained reclaim of $75,000–$80,000 would restore a medium-term bullish bias, while below $62,000, the bearish scenario would clearly dominate for the coming months.


BTCUSD Intraday Long — Contextual ExpectationWithin the daily composite framework and considering the current intensity of market buying, I’m expecting a continuation of the upside move toward the nearest area of friction.
Key zone of interest:
SP 68,700 – 69,150
Current context:
-sustained market buyer pressure
-divergence in the dynamic volume component
-supportive local structure
-liquidity and liquidation-related factors
Taken together, these elements increase the probability of a move toward the outlined zone in the near term.
Idea invalidation:
Acceptance and consolidation below 64,400.
This is a counter-trend perspective, therefore risk remains elevated. Execution, if any, will be strictly conditional and aligned with my system and risk parameters.

ETH - Liquidity Based SetupCrypto continues in capitulation mode.
ETH has now crossed the red significant 200 week moving average.
Notice how there have been quite a few bullish downside shakeouts through the MA.
But, important to remember that those bounces where in the more bullish phase of the market, and now we're into the more dangerous bearish phase.
For that reason we might not see quite the same reaction.
But yet, the 200MA is a significant liquidity structure and the bots game is to weave through such structures, even in impulsive areas.
Also notice that there is a cluster of supports slightly below current price.
I think if ETH can slump all the way through I may pick some up as a short term bounce play.
And perhaps it may be possible to hold for longer, but I would probably have a smaller percentage in mind - in and out for quick profit.
The obvious liquidity based trade (similar to CRWV) would be to buy below the lowest support and then sell @ the 200MA for a quick 20% trade.
A more aggressive trade would be to buy now looking for a bounce back above the 200MA, but thats not what I am doing (for now) 🧐.

Bitcoin Long Term ViewBTC has retraced 50% from it's all time high and is currently in the 'Golden Pocket' zone. The golden pocket refers to a key Fibonacci retracement zone between the 61.8% and 50% levels, often indicating potential reversal points in trading.
Additionally, we are at the bottom of a regression channel which has historically acted as support. Using Fibonacci time extensions based on previous highs it looks plausible that a new high could be reached towards the end of the year or early next year.
We first need to see a reversal of the recent downtrend on the daily chart to confirm this reversal area.

BTC Major level to hold.BTC Major level to hold. Huge level we are testing. Needs to hold or going lower.

USDCHF Sell side trade ideaSells very appealing if the white line is touched.
This line represents an upside show of strength and if bears are able to get back down to touch its low, I am confident that we may see some downside momentum.
Trend : long term trend is down (in my opinion). Wouldnt be surprised if we visit the 0.70 level in the coming years.
Retail traders : Majority have a Bullish sentiment on this pair. = a bearish sign.
Targets : levels clearly defined as good structural levels. The lower you target, the lower the overall winrate..runners might be a good idea here.
Stops : Idea would be to use ones own plan to find ideal stop positions on the 4H or lower. The highs above 0.78 represent a good level for stop loss setting. Consider trailing stops as per your systems.
Entries : Aggressive sell stop on line/ break and retest for the more conservative.
This is primarily for me as a reference in the future.
For educational purposes only

Great spot to buy btcWe should most likely get a relief rally from these areas and possibly a wick down to 58k so playing it safe
