USNAS100 / Fed Caution and Earnings Weigh on MomentumUSNAS100 – MARKET OUTLOOK | Futures Stall Near Highs as Fed Turns Cautious 🇺🇸
Wall Street futures held near record levels after the Fed’s 25bps rate cut, as traders weighed Powell’s cautious tone, Big Tech earnings, and a new U.S.–China trade deal.
🔽 Below 26,170: Bearish momentum toward 26,050 → 25,890 → 25,700.
🔼 Above 26,180: Trend turns bullish toward 26,500 → 26,850.
Pivot: 26,170
Support: 26,050 · 25,890 · 25,700
Resistance: 26,300 · 26,500 · 26,850
USNAS100 remains bearish while below 26,170, though strong tech earnings could trigger short-term upside volatility.
Trend Lines

SPX500 | Consolidation Phase Before BreakoutSPX500 – MARKET OUTLOOK | Consolidation Phase Before Breakout 🇺🇸
The S&P 500 is consolidating between 6,918 and 6,879, as traders await the next breakout following recent Fed guidance and earnings results.
Above 6,918: Bullish continuation toward 6,941 → 6,991.
Below 6,879: Opens correction toward 6,842 → 6,770.
Pivot: 6,918
Support: 6,879 · 6,843 · 6,770
Resistance: 6,941 · 6,991
SPX500 remains range-bound, but a breakout from this zone will define the next trend direction.

Gold bulls are strong; is 4100 still far away?
News:
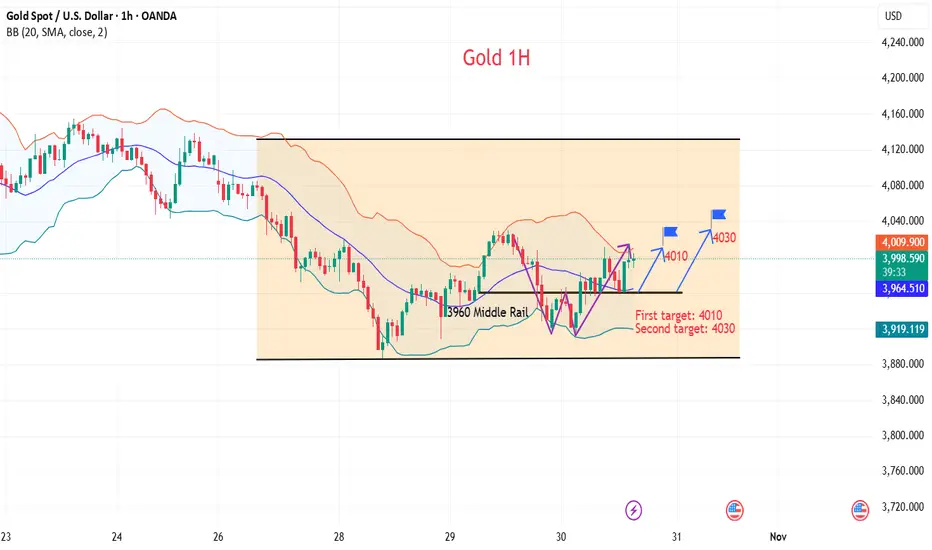
Gold rallied after testing the 3915 area again, breaking through resistance levels at 3975-80 and 4030 throughout the day, closing with a large bullish candlestick and forming a bullish engulfing pattern.
This morning, it rose to around 4046 before falling back and breaking below the key support/resistance level of 4005-10.
Technology manifestation:
From the 1-hour chart, the current short-term resistance level to watch is 4035-4030, with a key resistance level at 4060-4055. If this area is broken, the gold price may reach 4100. The short-term support level to watch is 3960. The recommended strategy is to buy on dips, and to observe more and trade less in the middle, avoiding chasing the market and patiently waiting for key entry points.
I will provide specific operational strategies in the channel, so please pay attention.
Trading strategy:
Buy:3989-3986, SL: 3975, TP: 4010-4020-4030

Gold has not fallen below the $4,000 mark, so what's next?
News:
The Federal Reserve cut interest rates by 25 basis points as expected on Wednesday. However, to the market's surprise, Powell released an extremely hawkish signal, stating that a December rate cut is "far from a certainty," which directly caused a market crash. US stocks fell from their highs, the dollar rose, and gold and silver markets plummeted. The Fed also postponed the pause in its balance sheet reduction program until December.
This has temporarily tightened market expectations for a December rate cut, meaning that the expectation of a rate cut has temporarily failed to materialize. However, there is still more than a month until mid-December, and with fluctuations in data, expectations are likely to rise again.
Specifically:
Gold hourly chart: Today's price action was relatively volatile, with poor continuity and high deceptiveness. For example, the large bearish candle at 11:00 AM led many to believe a breakdown and weakness, following the overnight decline. However, a small W-shaped rally broke through the morning's opening price level.
Trading strategy:
Buy:3965-3960, SL: 3950, TP: 3980-4010-4030
BITCOIN RALLY STARTEDI believe now after bitcoin re-tested the trendline which is a great support, the rally for November & December is on the way

CHF/JPY: Confirmed Intraday Bullish SignalI spotted an additional instance aligning with my breakout trading strategy.
The 📈CHFJPY pair showed a decisive violation and close above a significant intraday horizontal resistance level.
Following this, the price retested the broken structure and subsequently breached the resistance line of a falling parallel channel on an hourly timeframe.
This indicates a strong buying interest.
We can now anticipate an upward movement, with a minimum target of 192.66.

Ethereum confirmation of breakout, downside targetEthereum confirmed a breakout below the 4050–4100 zone, completing the double top pattern. The price stays under the 50 and 100 EMA, showing continued bearish pressure. Priority remains on short positions during pullbacks.
Nearest downside targets: 3463 (Target 1) and 3007 (Target 2). A move above 4100 would cancel the bearish scenario.
Amid expectations of the Fed’s rate decision and rising bond yields, risk assets remain under pressure. Inflows to crypto funds are declining, increasing the downside risks for ETH. In the short term, correction may continue until new bullish catalysts appear.
ETHUSD remains in a bearish setup. Downside targets — 3460 and 3000. Long positions should be considered only after a confirmed move above 4100.

US30 Eyes 47,200 for Potential BounceHey Traders, in today’s trading session we’re monitoring US30 for a potential buying opportunity around the 47,200 zone.
The Dow Jones continues to trade in a broader uptrend, and price action is currently in a correction phase, approaching the 47,200 support and resistance confluence area — a key zone where buyers may look to step back in.
Watching for a bullish reaction at this level to confirm continuation of the prevailing trend.
Share your view below — do you think US30 holds this zone or breaks lower?
Trade safe,
Joe.

Gold is Trading Under The Pressure of a Strong Dollar!!Hey Traders, in today's trading session we are monitoring XAUUSD for a selling opportunity around 4,020 zone, Gold is trading in a downtrend and currently is in a correction phase in which it is approaching the trend at 4,020 support and resistance area.
Trade safe, Joe.

NZDUSD: Trendline Breakout, Just As Predicted.Hi everyone,
NZDUSD have fulfilled my earlier analysis, by breaking down the higher highs and higher lows ascending channel. we can see that clearly in the chart structure, giving more opportunities for the sellers. extending its downward movement to our previous at 0.8684.
Key points;
The price eyes 0.8684, which remains the next anticipated target.
Happy weekend
Thanks for reading.

USDJPY → Attempt to break through trend resistance FX:USDJPY breaks through the resistance of the bullish pattern and attempts to remain in the long zone. There is a possibility of price growth against the backdrop of the dollar's rise following Powell's speech.
The dollar is recovering after the Fed meeting, and against this backdrop, the Japanese yen is losing ground, breaking through resistance at 153.23. The currency pair is trying to capitalize on the chance for growth.
The Japanese yen is forming a breakout of the resistance of a bullish pattern: an ascending triangle + consolidation on a bullish trend.
If buyers keep the price above 153.23, the market will have a chance to grow to 154.7.
Resistance levels: 153.23, 154.7
Support levels: 151.85, 152.37
On D1, the currency pair is trying to overcome the resistance of a multi-month downward correction. Locally, on H1, there is a breakout of the bullish pattern structure, which indicates interest from buyers. The chances of growth from 153 will appear if the price consolidates above the specified level.
Best regards, R. Linda!

Gold Technical Outlook: From Reaction Zone to RallyStructure and Trendline Break
Gold on the H1 timeframe shows a clear breakout from the descending trendline, signaling a structural shift from bearish to potential bullish continuation. The breakout is supported by the formation of a higher low, suggesting growing buying pressure.
ABC Pattern and Key Retracement Zone
After the first bullish impulse from 3887 to 4045, price is now in a corrective phase (wave B), pulling back into the Fibonacci retracement zone:
0.618 (3993) to 0.786 (3978) marks the PRIMARY REACTION ZONE, where buyers are likely to step back in.
A strong bullish reaction from this zone would confirm the start of wave C.
Fibonacci Extension Targets
If the bullish continuation (wave C) unfolds as projected:
1.618 extension at 4117 → short-term bullish target.
2.618 extension at 4259 → main bullish projection, mirroring the prior impulsive move.
As long as price holds above the 3950–3980 support range, the bullish structure remains intact.
Trading Bias & Summary
Bias: Bullish (while above 3980)
Ideal Entry: Buy limit around 3980–3995 (Primary Reaction Zone)
Invalidation: Break below 3950 (signals potential deeper correction)
Targets: 4117 and 4259

USDHUF - (3 Month) Potential EngulfingUSDHUF - Is obviously going to have engulfing it already happened 5 times #Positiontrade

EURUSD downside target: 1.140On the daily chart, EURUSD has formed a head and shoulders pattern, indicating short-term bearish dominance. Currently, the price is trading below the downtrend line. Intraday, watch for opportunities to short on rallies around 1.160. Support is currently around 1.154; a break below this level would target 1.140.

XAUUSD Bearish📉 XAUUSD Short Setup
EMA rejection
Trendline break
Structure shift to the downside
4H bearish rejection confirmation

Griffain is looking goodGriffain is looking good, with a huge potential of 40% returns. Right now it is trading in a descending triangle. Being a low supply token, it can easily jump to the target.
Not a Financial Advice

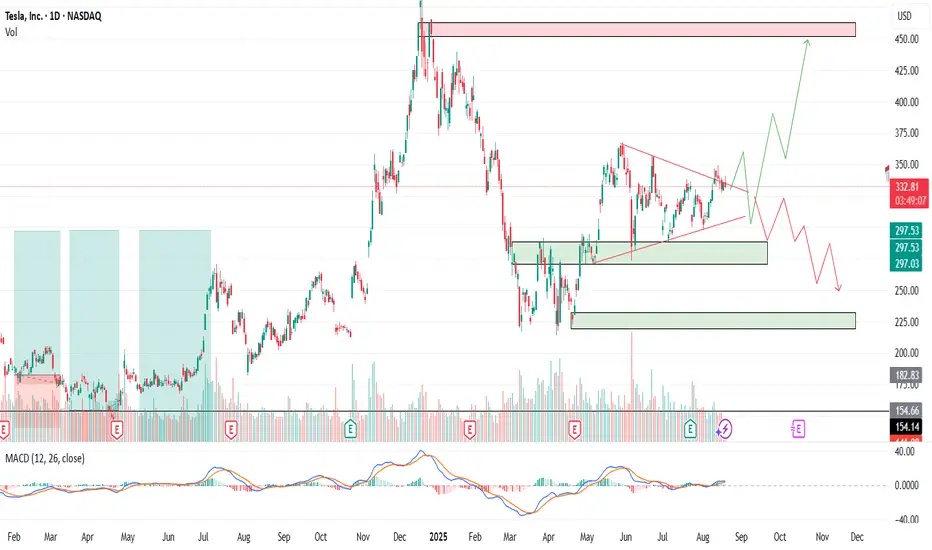
TSLA – Buy the Fear or Wait for the Setup?Tesla (TSLA) is once again in the spotlight. Between robo-taxi hype, new product launches, and ongoing political noise around Elon Musk, the stock has become one of the hottest trading stories on the market. But as always the chart tells us where to act.
Entry Levels
$330 – First line of defense, early buyers may step in here
$295 – Stronger support, better reward-to-risk zone
$255 – Deep pullback level, only triggered on market weakness
🎯 Profit Targets
TP1: ~$345 → ~5% move from $330 entry
TP2: ~$370–$380 → 12–15% move depending on entry
TP3: ~$400–$420 → 18–20% move on a sustained breakout
Tesla remains a trader’s stock: volatile, narrative-driven, and technically reactive. If it holds the $330 zone, momentum traders could see a quick bounce. If we dip to $295 or even $255, that could be the bigger opportunity for those with patience.
No one knows which path the market chooses, but the plan is set. Trade the structure, not the noise.
⚠️ Disclaimer: This is not financial advice. I’m sharing my personal analysis and trade levels. Always do your own research and manage risk responsibly.
ASX SPI futures test key uptrend as bears circleAustralian ASX 200 SPI futures look vulnerable, with bearish signals continuing to pile up on the charts.
On the left-hand side, we can see price trading beneath the 50-day moving average, a level it bounced from strongly when tested earlier in the year. Having closed beneath it on Thursday, another bounce was seen in overnight trade where volumes are typically far lower than the day session. However, so far, the rally was sold into, leaving price dangling just above uptrend support.
While it comes with the disclaimer that price action around month-end always needs to be treated with caution, unless we see a solid bounce during the day session, the unconvincing price action over the past week may be enough to encourage bears to seek out lower levels.
The momentum picture has turned noticeably over recent weeks, with RSI (14) trending lower and now beneath 50, indicating pressure is swinging to the downside. MACD also points to waning topside pressure, having crossed the signal line before moving sharply lower towards negative territory. At the very least, it suggests momentum is turning, increasing the probability of bearish setups playing out.
On the weekly timeframe on the right, as things currently stand, we’re staring at a bearish engulfing candle—another warning sign that downside may be looming. It’s obviously not completed yet, but without a meaningful rally on Friday, it may not be lost on other traders, especially given how poor price action has been recently.
If we see a break and close beneath the May uptrend, shorts could be established below the level with a stop above for protection. Possible downside levels to target include 8830, 8750 or 8600, depending on desired risk-reward from the trade.
Should price continue to hold the uptrend and bounce back above the 50DMA and close there, the setup could be flipped, with longs established above the moving average and a stop beneath the uptrend. A break above minor resistance at 8950 could open the door for a potential run back towards the record highs.
Good luck!
DS

Great OJ opportunity at 135If OJ hit's 135, it's a good opportunity to buy! OJ is currently following the all commodity downtrend.
Good luck!

Xrp SellAfter forming the final push to the upside, price failed to create a new Higher High and instead broke below the previous Higher Low (HL), confirming a shift into a bearish phase. Price is now in the Correction phase, retracing back into the prior accumulation zone that has now flipped to potential resistance. This breakout level is expected to act as my supply area, with downside targets set toward recent lows.
Although price quickly re-entered the zone—suggesting a possible liquidity grab—the absence of strong rejection wicks and the current market structure bias continue to support a bearish outlook
Entry: 2.64850
Stop Loss: 2.67350
Take Profit: 2.34000

GBP/USD Plunges to Six-Month Low Post-FedSterling plunging through confluent support in the wake of the Fed yesterday with the decline extended more than 3% off the October. The bears are now testing a key pivot zone into the monthly close- risk for inflection off this mark in the days ahead.
Initial weekly support rests at 1.3140/43- a region defined by the May and July lows, the 2023 swing high, and the 38.2% retracement of the yearly range. Confluent support sits just lower at the 100% extension of the June decline and the 52-week moving average at 1.3080/88. Look for a larger reaction there IF reached with a break / weekly close below exposing the 50% retracement at 1.2944. Note that the 25% parallel converges on this threshold early next month, making it an area of interest for potential downside exhaustion / price inflection.
Weekly resistance stands back at the July low-week close (LWC) at 1.3280 and is backed closely by the median-line. Broader bearish invalidation is now lowered to the 2024 swing high / September high-week close (HWC) at 1.3434/69- strength beyond this threshold would be needed to suggest a more significant low is in place / threaten resumption of the broader uptrend. Subsequent resistance objectives eyed at the yearly HWC at 1.3648.
Bottom line: Sterling broke below the October opening-range lows yesterday and while the decline does threaten a deeper pullback, the immediate focus is on a reaction off this support pivot into the monthly cross. From a trading standpoint, a good zone to reduce portions of short-exposure / lower protective stops- rallies should be limited to the median-line IF price is heading lower on this stretch with a close below 1.3080 needed to fuel the next major leg of this decline
-MB

Market volatility, why I dare to be bullish on BTC#BTCUSD BITSTAMP:BTCUSD BINANCE:BTCUSDT
The BTC market has been declining since yesterday's US session, with a sharp drop following Powell's hawkish comments, hitting a low of around 106,500. Institutional trading activity has decreased in the short term, suggesting a deliberate wait-and-see approach, anticipating further price corrections before re-entering the market. Therefore, do not blindly participate in trading in the short term.
The current BTC market may seem bustling, but it is actually rife with undercurrents. A new direction will only be established when sentiment reaches its peak and volatility subsides. Perhaps the next real starting point will not be in the current clamor, but after the cheers of retail investors subside. Pay attention to the performance of the downward channel support level of 160,000-104,500. If it pulls back to this range, you can consider establishing a small long position.

HIMS to $76HIMS is incredibly profitable and also a highly shorted stock (33%). It might tap support here, but if not just below the trend line seems like a nice entry.
Good luck!
