GBPUSD is testing a major support levelGBPUSD is testing a major support level currently and previous tests as indicated on the chart pushed the price high indicating a possible long trade targeting 1.3335
Trend Lines

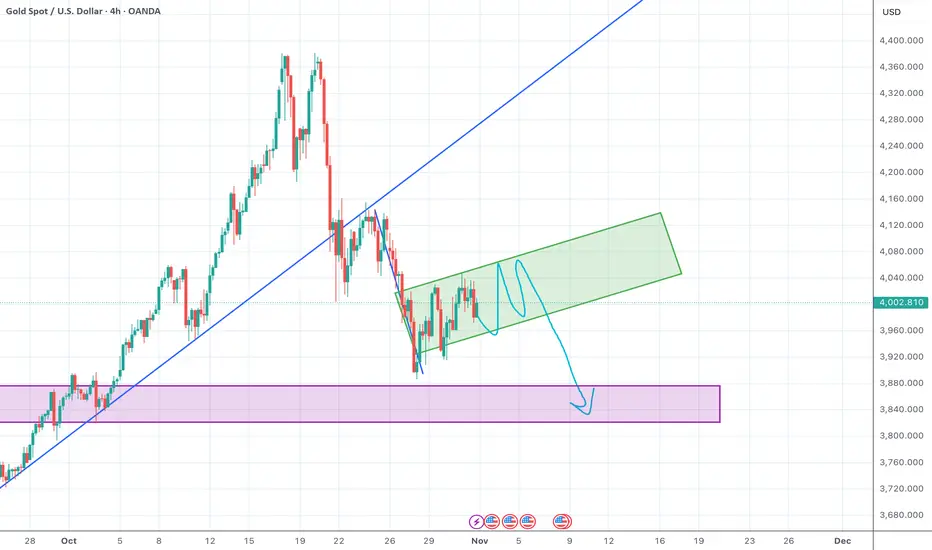
Gold is forming a flag patternGold is forming a flag pattern which is interpreted as a sign of further down movement targeting the area of 3850 as a first target.
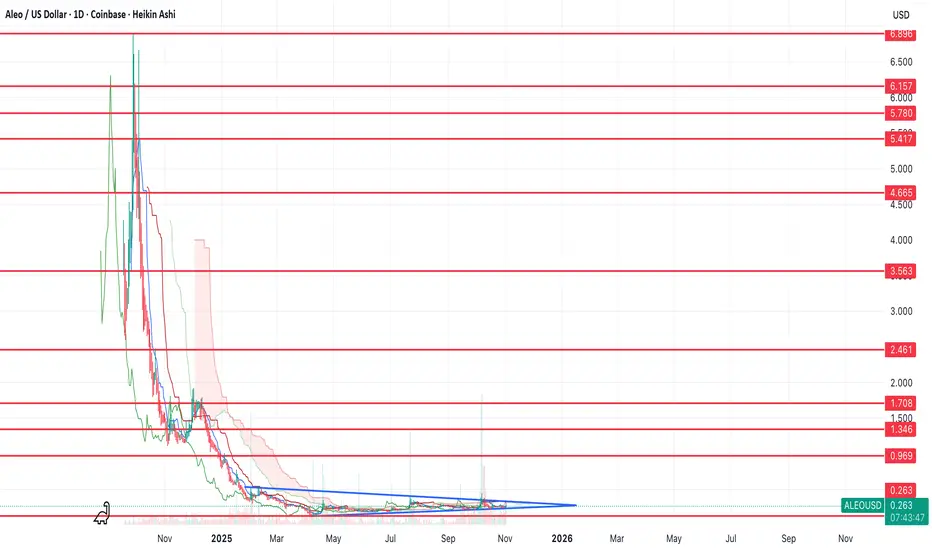
$ALEO bottom in?After correcting from September until now, it looks like ALEO is forming a bottom here and is ready for a reversal.
If we can break out to the upside, then I think we could see a move to one of the upper resistance levels for a 3x+ gain.
Let's see how it plays out over the comings weeks/months.
Long_Federal BankHi traders,
Currently FB is trading @ ATH with Bullish breakout.
This month gains is biggest since 2020.
Long until it breaks previous month low.

Xauusd weekly analysis Weekly CLS: Weekly close target zone.
• Model 1 TP: First take-profit area.
• Liquidity: Stops resting here — price may grab them.
• CIOF: Bullish structure shift confirmed.
• Retest: Low-risk buy entry zone.
• Key Level: Major support — watch for break or bounce.

ADAUSDTBINANCE:ADAUSDT is wait for breakout trendline for start bullish trend so we wait for this breakout and ADA give best signal for buy.

Hawkish Fed Tone Caps EURUSD Near 1.1580!!Hey Traders, in today’s trading session we’re monitoring EURUSD for a potential selling opportunity around the 1.15800 zone.
The pair remains in a downtrend, and the current correction phase is bringing price back toward the 1.15800 resistance area, aligning with the broader bearish structure.
On the fundamental side, the recent U.S.–China deal combined with Powell’s hawkish tone has reduced the odds of a December rate cut — a setup that continues to favor USD strength and weigh on EURUSD.
Watching for rejection signs near 1.15800 for possible continuation to the downside.
Trade safe,
Joe.

TWLO - Downtrend line BROKEN!TWLO - CURRENT PRICE : 134.88
The chart shared here is the weekly chart, where TWLO broke above its downtrend line with strong volume — a signal of growing bullish momentum. On the daily chart, TWLO formed a rising window (gap-up) last Friday — a bullish signal that often indicates strong buying momentum and potential continuation of the uptrend.
From a pattern analysis perspective, some traders may interpret the current setup as a bullish symmetrical triangle, indicating potential continuation to the upside. Next target will be 154.00 and 174.00. Support level is 114.73 (the low of window area based on daily chart).
ENTRY PRICE : 132.00 - 135.00
FIRST TARGET : 154.00
SECOND TARGET : 174.00
SUPPORT : 114.73 (CUTLOSS below this level on closing basis)

ETHEREUM: $4,250 Target in Sight Amid Wide Consolidation 📈ETHEREUM is currently undergoing a consolidation phase.
The price is stuck within a wide horizontal channel on the 4-hour timeframe.
We see a strong positive bullish reaction at its support level, leading to a bounce and the formation of a minor resistance.
The violation of this minor resistance indicates a change of character, suggesting a high probability of local buyer dominance.
Our target is at 4250 range resistance.

Manausdt buy opportunityMANAUSDT is gaining strength with price rebounding toward the bottom trendline and pushing upward. Momentum favors a continued rise toward the $0.65–$0.80 supply zone, a key level that previously triggered strong sell-offs. A successful breakout above this zone could unlock significant bullish momentum, with eyes set on the $2.70 region as the final setup target. Let price action lead, this could unfold swiftly.

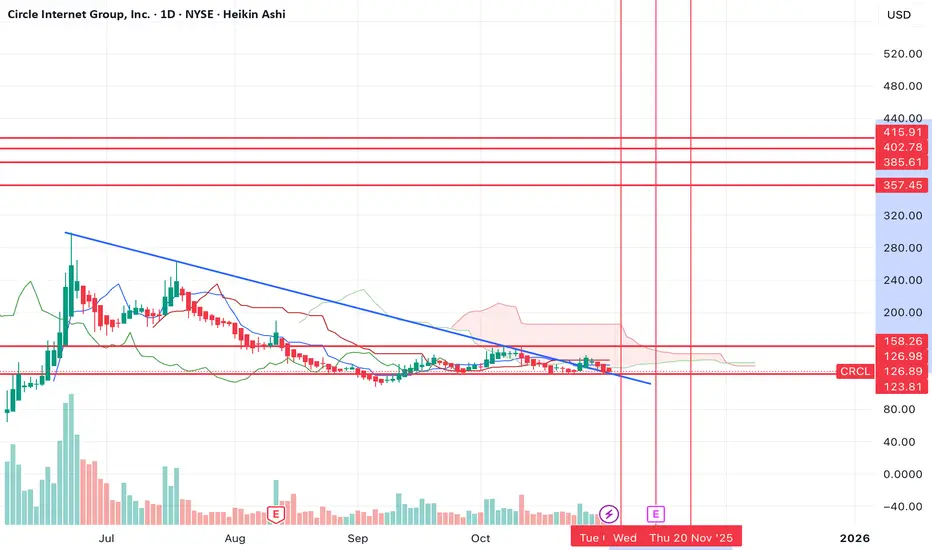
$CRCL set for a 150%+ move?Circle has broken out of a long term downtrend downtrend and has just retested the support. I think we're looking at a large move to the upside from here.
Would also coincide with similarities I'm seeing in altcoin charts.
I think the bullish move can take us to one of the upper resistances over the coming weeks.
Let's see how it plays out.
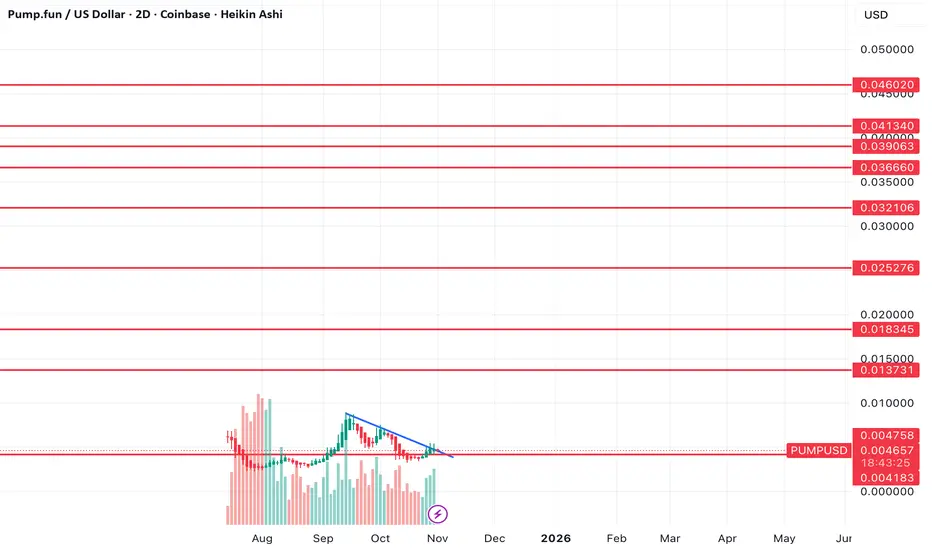
Is pump about to pump to new highs?Since September, Pump has corrected, however now it looks like we've broken and retested the downtrend and it looks set to move higher from here.
I've marked off key resistance levels on the way up.
Think we could see a pretty large move if this really gets going.
KERNEX buy setupKERNEX buy setup : I take position in weekly candle basis. hold for 2-3-5 months until the trend is reversing. Please Note: This template is for informational purposes only and is not a substitute for professional legal advice.

rappid valves buy setuprappid valves buy setup: I take position in weekly candle basis. hold for 2-3-5 months until the trend is reversing. Please Note: This template is for informational purposes only and is not a substitute for professional legal advice.

nbcc weekly position takenI take position in weekly candle basis. hold for 2-3-5 months until the trend is reversing. Please Note: This template is for informational purposes only and is not a substitute for professional legal advice. #nbcc

GBPUSD is in the Buying DirectionHello Traders
In This Chart GBPUSD HOURLY Forex Forecast By FOREX PLANET
today GBPUSD analysis 👆
🟢This Chart includes_ (GBPUSD market update)
🟢What is The Next Opportunity on GBPUSD Market
🟢how to Enter to the Valid Entry With Assurance Profit
This CHART is For Trader's that Want to Improve Their Technical Analysis Skills and Their Trading By Understanding How To Analyze The Market Using Multiple Timeframes and Understanding The Bigger Picture on the Charts

EURNZD Long From SupportHello Traders
In This Chart EURNZD 4 HOURLY Forex Forecast By FOREX PLANET
today EURNZD analysis 👆
🟢This Chart includes EURNZD market update)
🟢What is The Next Opportunity on EURNZD Market
🟢how to Enter to the Valid Entry With Assurance Profit
This CHART is For Trader's that Want to Improve Their Technical Analysis Skills and Their Trading By Understanding How To Analyze The Market Using Multiple Timeframes and Understanding The Bigger Picture on the Charts

Silver is in the Bullish directionHello Traders
In This Chart XAGUSD HOURLY Forex Forecast By FOREX PLANET
today XAGUSD analysis 👆
🟢This Chart includes_ (XAGUSD market update)
🟢What is The Next Opportunity on XAGUSD Market
🟢how to Enter to the Valid Entry With Assurance Profit
This CHART is For Trader's that Want to Improve Their Technical Analysis Skills and Their Trading By Understanding How To Analyze The Market Using Multiple Timeframes and Understanding The Bigger Picture on the Charts

NZDJPY near one of the major buy zonesThe NZD/JPY is currently approaching the previously breached trendline resistance, which has now transitioned into a key support level. This retest of the former resistance-turned-support presents a favorable opportunity to consider long positions. We will initiate a long trade within this support zone and define our profit target accordingly.
DISCLAIMER: ((trade based on your own decision))
<<press like👍 if you enjoy💚

AXSUSDT and SLPUSDT are next 10X do not lose it Both AXS and SLP are fundamentally robust tokens with strong interlinked utilities. From a technical perspective, they are currently trading at a historically significant support zone, suggesting a potential market bottom. This convergence of positive fundamentals and oversold technical conditions presents a compelling case for a substantial upward revaluation. A significant price appreciation, potentially reaching a 10X return, is a plausible scenario upon a market resurgence.
DISCLAIMER: ((trade based on your own decision))
<<press like👍 if you enjoy💚

EURJPY -400pips dump coming Technical analysis indicates that the 178.00 level represents a significant technical resistance for EUR/JPY, further reinforced by a converging trendline. A bearish rejection from this resistance confluence could precipitate a corrective decline. We anticipate a potential downward movement of at least 400 pips upon a confirmed rejection at this level.
DISCLAIMER: ((trade based on your own decision))
<<press like👍 if you enjoy💚

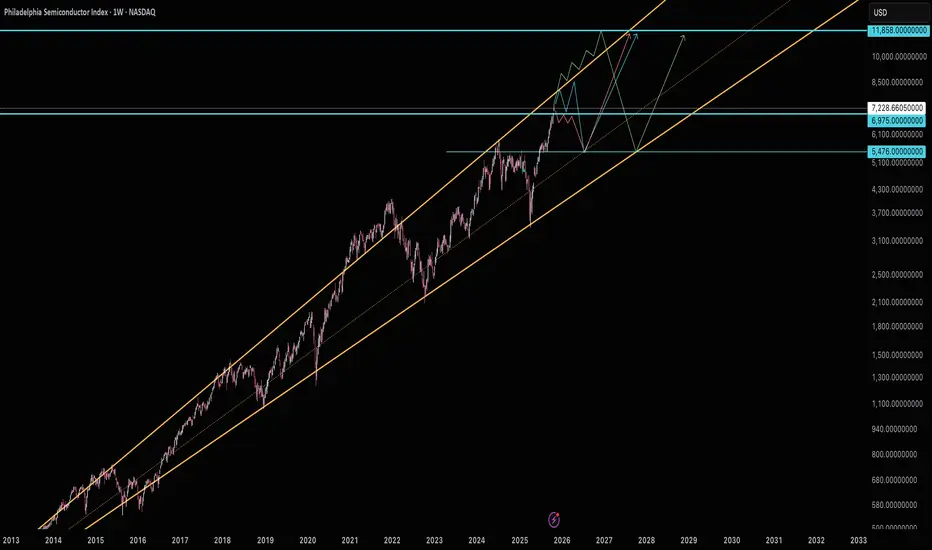
Possible SOX OutcomesSemiconductors are well off their long term trend line and quickly approaching the upper/faster trend. I'm quite positive this is the warning Michael Burry was talking about in his recent twitter post.
I'm speculating the green path is actually more likely than not and if semiconductors take that that path, then we're in for an extremely large drop similar to 2022. The S&P Technology sector index (S5INFT) is currently well above it's fast trend line similar to post covid.
*If* the major resistance at 6975 takes over this could lead to a more reasonable trend and avoid such a large downtrend later.
I'm noticing that below current prices there hasn't been really any support made since 5478 in August, which is why I'm noting that as an important area that *if* there's a pullback that will likely be a smart area to buy.
Ultimately, like Burry is speculating there's a bubble, I'm also concerned about the eventual drop to that lower trend line. Currently because brokers margin account levels hasn't shown any real acceleration (like it did post-covid) I'd be inclined to speculate the bubble is just starting and the more extreme move is going to occur (the green path). Also hits of the lower trend line tend to be spaced out over many years. However it plays out, I'm inclined to save most of my capital for when semiconductors hit that lower trend line.
AVHOL/USDTRY 90% potentialreversal from bottom of the range. on the watch for conservative entry on the downtrend resistance retest. no entry unless the reversal is confirmed 🚫.
stop below daily region close
take profits at upper range & stops to entry.
close position at rectangle target.
⚠️ not a financial advice - DYOR
