GBPUSD Correction Could Trigger Fresh Longs at 1.31200Hey Traders,
In today’s trading session we are monitoring GBPUSD for a potential buying opportunity around the 1.31200 zone.
The pair remains in a clear uptrend, and price is currently in a corrective phase, retracing back toward the 1.31200 support–resistance confluence aligned with the ascending structure.
This level has acted as a key reaction zone in previous swings, and a bullish response here could open the door for continuation toward recent highs.
Trade safe,
Joe.
Trend Lines

EURUSD Breakout and Potential RetraceHey Traders, in today's trading session we are monitoring EURUSD for a buying opportunity around 1.15700 zone, EURUSD was trading in a downtrend and successfully managed to break it out. Currently is in a correction phase in which it is approaching the retrace area at 1.15700 support and resistance area.
Trade safe, Joe.

GOLD 5 elliot waves complete, whats next?Gold Analysis – Key Levels and Potential Scenarios
Yesterday, gold rallied from the lower boundary of the channel up to the midline, completing what appears to be a full 5-wave Elliott sequence. Price is now sitting at a strong resistance level that has been rejected multiple times in the past.
Additionally, the market seems to be forming a potential Head and Shoulders pattern, which is a classic bearish reversal structure. If this pattern plays out, I expect a pullback toward the 4,040 zone, where liquidity and structural support align.
However, if gold breaks above the current resistance, invalidating the H&S pattern, the next objective would be the upper boundary of the ascending channel, opening the door for further bullish continuation.

$BTCUSD Long Term chartBITSTAMP:BTCUSD : This is one possible long term count. The 2017-2018 top-bottom marked a high degree Wave {1}, {2}. We've been in Wave {3} since that bottom.
The 2021-2022 top-bottom completed Wave and . Wave started from that bottom.
The $126K top has a 1.618 Fib ratio with Wave . If Wave topped here, then Wave cannot drop below Wave top, which is $69K. The yellow trend line may be the place to mark Wave , which is around $78K. A drop to $78K would mark a 40% pullback.
However, Wave = 1.618 Wave is a minimum length for Wave . I do expect Wave to go higher.
The channel is still holding. $89K area could be the bottom. If that's the case, Wave has not completed yet.
My position
I'm long. If BTC recovers, I'd be looking to de-risk but won't sell all. If BTC drops to $78K area, I will add.

Bitcoin back below my fair value trend lineWhen BTC value falls below this trend line, I generally declare that it is a good time to buy Bitcoin.

GBPCHF → Countertrend correction. Retest of resistance FX:GBPCHF is testing key resistance at 1.0515 as part of a countertrend correction. Bears are behaving quite aggressively in the current market...
The global trend is downward. After retesting the local bottom, the currency pair is forming a correction to the previously broken consolidation border.
The key area of interest is 1.0515, and bears are trying to hold it. The battle for the zone has been going on for several hours. In extreme cases, a retest of 1.054 is possible before a decline.
A false breakout of resistance (consolidation border) is forming as part of a countertrend movement...
Resistance levels: 1.0515, 1.0542
Support levels: 1.0486, 1.0443
If the bears keep the price below 1.0515, completing the reversal pattern, this could trigger a further decline. Otherwise, the currency pair may form a short squeeze and test 1.0542 before declining...
Best regards, R. Linda!

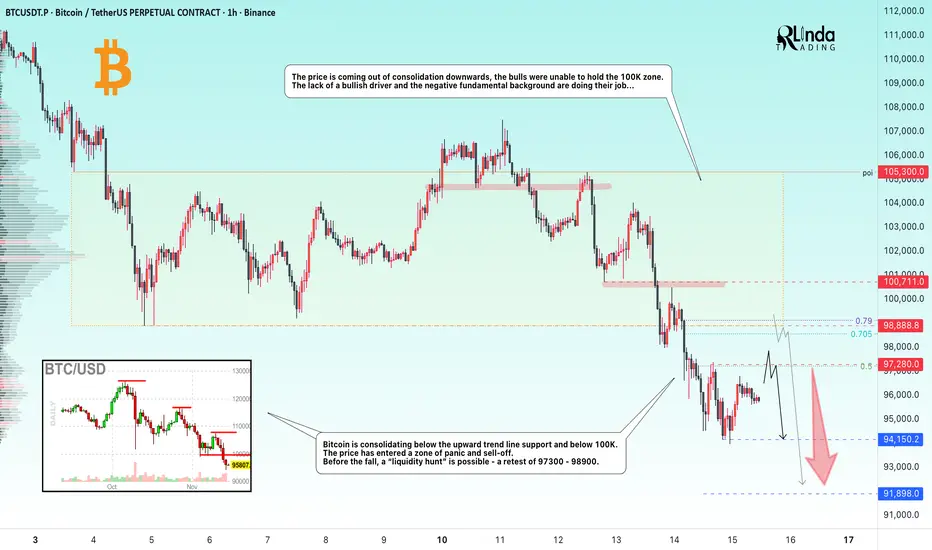
BITCOIN → 100K broken. Consolidation in the short zone...BINANCE:BTCUSDT.P broke through the 100K support level and is consolidating within the local range of 94,150 - 97,280. The decline may continue if the market does not receive support (news or other bullish drivers).
Bitcoin is consolidating below the upward trend line of support and below 100K. The price has entered a zone of panic and sell-off. Before the fall, a “liquidity hunt” is possible - a retest of 97300 - 98900.
The price is coming out of consolidation downwards, the bulls were unable to hold the 100K zone. The lack of a bullish driver and the negative fundamental background are doing their job...
Resistance levels: 97280, 98900, 100700
Support levels: 94150, 91900
Before further decline, the market may test the previously broken support zone relative to the upward lower trend line. Focus on the 97280 - 98990 zone. A false breakout and lack of bullish momentum could form a reversal pattern and trigger a decline to 94150 - 91900.
Best regards, R. Linda!
BTC Ending Diagonal? Is btc in an ending diagonal? is that why we also see other assets like BNB and ETH also in ending diagonals? I dont see impulsive 5 wave moves for the 5th wave. Just ABCS on the weekly. DARE I SAY IT HIGHER?
Comment your thoughts below frfr , lets get to the bottom of it right now.

OUTLOOK XAUUSD 15m Analysis (19th November 2025)Hey Guys, this is just a trade idea and not a financial advise.
BUY/SELL SCENARIOS:
BUYS:
1) Body Candle Close above the 4078.34 level.
2) Retest the 15m Bullish CHOCH at the 4078.34 level.
3) Create a 3/5m Bullish Engulfing Candle to capitalise on BUYS towards the 4145.00 level.
SELLS:
1) Body candle close below the 4059.57 level.
2) Retest the 15m Bearish CHOCH at the 4059.57 level.
3) Create a 3/5m Bearish Engulfing Candle to capitalize on SELLS towards the 3998.00 level.
Always trade with a trading and trust the process. Cheers


Natural gas Near expiration, the spread between spots and future is about 1000 pounds, it may goes to ranges between 3.5-3 7. But near target is about 3 95

POTENTIAL BUY CONTINUATION ON USDCAD or lowerlevelsThis position on USDCAD here and if it break, we tap into the lower level for the buy.
This looks like a return to base with structure (if the next few candles present bullish opportunity)
Will keep an eye on it to see whether an opportunity present itself

AB=CD Harmonic pattern on EURJPY: CAN THE SHORT BE FOR LONG?Recent push by EURJPY into higher highs have formed a AB=CD harmonic pattern on that indicates a potential reversal. As like every trading strategy that comes with pros and cons, it is best to trade with sufficient SL as the trade is a potential interest to me

Liquidity Hunter | Smart Money PlaybookSmart Money Footprint | Market Structure & Liquidity Trader
Hunting liquidity sweeps and smart money footprints across major sessions.
I break down the market the way institutions move it:
SFP • Break of Structure • Premium/Discount • Session Timing • Fakeouts
Daily charts, scalps, and tactical explanations.
Follow if you want to trade with the real flow — not against it.
Drop a comment once at all this information 🤑🔥❤️📉

It's Clear... Isn't it? This chart lays out the cycle tops and bottoms of bitcoin going back to the halving in 2012.
What we can clearly identify is that every major cycle low started a run for 1065 days into new All time Highs.
If this is true still, we should be headed down for an entire year.
However,
like many indicators, I believe they become unusable.
Over time if something works, too many people use it to identify a trade, whether that's institutions or retail as a collective.
This chart should scream bear.
However, I love the counter trade.
Every major figurehead is screaming bear, I just don't believe that to be the case. If everyone is shorting, what happens. if everyone sold what happens.
Counter trade. Most people think they understand, until they don't.
A trade can always flip, you cannot hold conviction because you want it to go a certain way, you have to be ready to change your mind when the time is right.
I am Bullish. For now.
Run the table.
BITSTAMP:BTCUSD

Will gold prices fall again after bottoming out and rebounding?Gold Technical Analysis: Gold prices initially fell below 4000 today, but rebounded during the US session. A significant reversal in initial jobless claims data propelled gold to around 4082, reversing the overall downward trend and pushing prices back into range-bound trading. While there were intraday rebounds, gold ultimately met resistance and fell, with higher highs continuing to decline, indicating a clear overall weakness. As I repeatedly emphasized yesterday, gold was poised for a drop, and I stressed the 4100 resistance level. I also repeatedly highlighted the strategy of selling on rallies. The key resistance level to watch is the 4080-4100 range, which was the sideways trading area at the end of yesterday's session.
Currently, the bears still have the upper hand. The short-term effective support is in the 4000-3990 range, while the resistance has been emphasized in the 4080-4100 area. If this area is touched again, another short position can be taken. In short, today's theme is still a weak downward trend with fluctuations. In terms of operation, you can wait for entry based on the above support or resistance levels. The slowdown in the fluctuation pace has extended the market cycle, so every entry requires sufficient patience.

tradingview is faggots posted idea at 102k and they made it hidden.
Freedom of speak. Constitution rules not you.

BTC USd still down trend Btc hadn’t is still in downtrend it make bullish divergence but it only plays for lower highs also perfectly respected trend line

Short first, then long; perfectly grasping the market rhythm.On Tuesday, the bottoming strategy suggested that gold should pay attention to the 4000 level for a rebound and correction. As expected, it rebounded to around 4040. After the opening, a short position was arranged at 4052, which reached the profit target of 4030 as expected. Then, a long position was arranged at 4000, which was closed at 4015. The intraday strategy was to first short and then long, reaping a profit of 37 pips!
Gold prices continued their weak opening on Tuesday, with selling pressure emerging after breaking below short-term moving averages yesterday. Although delayed data such as the September non-farm payrolls will be released this week, the results may reinforce the Federal Reserve's stance of holding rates steady, putting continued pressure on gold prices. Overall, gold prices are likely to adjust this week. With no major data releases today, the market focus is on speeches by Federal Reserve officials and changes in expectations for interest rate cuts.
Gold's technical outlook remains bearish. The hourly chart is still within a standard downward channel. After rebounding to around 4055 at the open, it fell back again, indicating a weak corrective structure. No effective reversal signal has been seen in the short term. The strength or weakness of the European session will be the key observation point for today's trend. The watershed above is still the 4045-4070 area. As long as the price continues to be pressured below this range, the bearish structure is likely to continue. The first support level to watch is the 4000 mark. If it breaks down effectively, the bearish target will continue to be around 3980. In terms of trading strategy, if there is a rebound to the 4045-4070 area before or after the European session, consider shorting gold in batches, following the channel structure. The overall outlook remains bearish.

$ETH Macro planI made this CRYPTOCAP:ETH cheatsheet. I'm looking to bid 2900-2700 area. As you can see we lost the level on weekly timeframe. And retesting it this week. A close below means we will likely go to my marked area.

IREN on $48 Support Target $98IREN looks to be holding support still even with all the flood of fear through the market. I've never seen so much talk of a bubble when there's zero signs of a bubble. This would lead me to suspect IREN will hold the green trend line and follow the course up from here. But it's important to keep in mind that red trend is it's long term trend.

A rebound after hitting bottom is bound to face pressure again.#XAUUSD OANDA:XAUUSD TVC:GOLD
Gold rebounded after falling to around 3997, forming a V-shaped pattern and has now largely recovered its Asian session losses. However, judging from the timeline, the mid-term correction is not yet completely over. During the NY session, we should continue to pay attention to the 4000-3980 range. Only a break below this level can open up further downside potential. Similarly, as I mentioned before, the market is expected to remain volatile before the data release, so the short-term upside resistance level to watch is 4055-4060, and the key resistance level is 4080-4090. If gold prices first touch 4055-4060 and encounter resistance during the NY session, consider shorting gold with a small position.
Gold: Watching for a Short Squeeze Into 4100 SupplyGold is trading inside an ascending micro-channel and building pressure for a potential short squeeze into the major supply zone between 4085–4100.
This zone lines up with:
HTF supply
Channel resistance
Liquidity resting above previous highs
Session timing confluence (afternoon reversal window)
My Plan:
Expecting a possible final squeeze into 4100 followed by a sharp fade/sell-off into the afternoon session. This would create a high RR A+ reversal setup if price rejects the supply zone with clean structure.
Why This Matters
Momentum is still bullish intraday, making the squeeze likely
But macro levels above are stacked with sellers
Perfect scenario for liquidity grab → reversal
Levels to Watch
🔼 4085–4100 (sell zone / squeeze target)
🔻 4050
🔻 4025
🔻 4000 (major intraday target if rejection is strong)
Bias: Bearish after the squeeze completes.
Invalidation: Strong breakout + acceptance above 4105.
