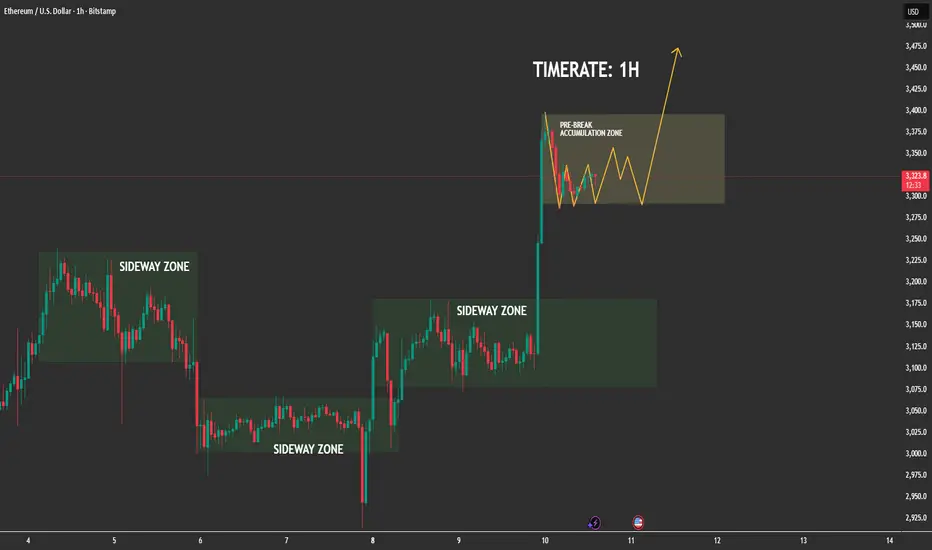
Ethereum Has Entered Its Pre-Expansion Accumulation📊 (1) MARKET STRUCTURE — CLEAN SIDEWAY → BREAKOUT → RE-ACCUMULATION
The chart shows a repeating pattern:
✔ Phase 1: Sideway Zone
ETH repeatedly compresses in sideways zones, forming liquidity pools and equal highs/lows.
✔ Phase 2: Breakout With Strong Momentum
Each sideways block ends with a powerful impulsive candle clear evidence of aggressive buy-side imbalance.
✔ Phase 3: Post-Break Re-Accumulation (CURRENT PHASE)
Price is now inside the highlighted pre-break accumulation zone,
moving in a tight, controlled structure a textbook bullish continuation setup.
This is the phase where institutional traders rebalance orders before the next run.
📍 (2) PRICE BEHAVIOR — BULLS IN FULL CONTROL
-No sharp rejections after the breakout
-Dips are shallow and quickly absorbed
-Market is forming higher low micro-structures
-Momentum clearly stays in the hands of buyers
This confirms the market is not distributing, but absorbing liquidity and building a base.
🌐 (3) MACRO FACTORS SUPPORTING ETH UPSIDE
✔ ETH ETF Approval Momentum (US + Asia)
Regulatory mood continues shifting positively, with multiple jurisdictions preparing Ethereum ETF products. Institutional demand keeps increasing quietly in the background.
✔ Falling US Inflation & Dovish Fed Expectations
Recent CPI and PPI reports show cooling inflation. The market widely expects 2025–2026 rate cuts, which historically push liquidity into risk assets ETH benefits directly.
✔ Ethereum Supply Shock
-Over 27% of ETH is staked
-Net supply remains deflationary under high network activity
-Reduced exchange reserves signal accumulation
This creates a tightening supply environment that amplifies price expansion.
✔ Altcoin Rotation Phase
BTC dominance stabilizing → capital increasingly flows into ETH and large-cap alts.
Macro + on-chain + liquidity flows all align with a bullish continuation.
⏳ (4) HTF CONTEXT — BULL CYCLE CONFIRMED
Higher timeframes show:
-ETH broke out of a weekly compression range
-Structure is fully bullish
-Market currently resetting before next leg
-No bearish reversal signals anywhere in sight
This supports the thesis that the current 1H accumulation is not random, it is part of a much larger bullish leg forming.
🚀 (5) EXPECTATION — HIGH PROBABILITY SCENARIO
ETH is expected to:
-Continue oscillating inside the pre-break accumulation zone
-Form a series of small higher lows as drawn
-Absorb liquidity from both sides
-Break out toward 3,400 → 3,450+
The path of least resistance remains upward.
🎯 (6) TRADING INSIGHT (Non-Signal)
Markets only explode after liquidity is collected.
ETH is doing exactly that holding strong after a breakout and compressing before expansion.
This is the signature behaviour of a healthy bullish trend.
Trend Lines
Today's market trend analysis and exclusive trading strategy.Gold continued its rollercoaster ride today, with market sentiment clearly shifting ahead of the interest rate decision, resulting in very limited overall volatility. On one hand, the market has largely priced in the rate cut expectations, with a consensus now widely believing there's an over 80% probability of a 25 basis point cut by the Fed. This "expectation fulfilled" market sentiment is unlikely to generate significant volatility unless the outcome surprises us. What truly warrants attention is not the rate cut itself, but rather the post-decision guidance on the interest rate path, including the latest dot plot, economic projections, and Powell's remarks at the press conference. These signals will directly influence the market's assessment of the future pace of rate cuts, especially the policy path in 2026, which will be crucial in shaping the next gold price trend. In this market environment, everyone must maintain a steady pace and avoid greed. With unclear direction and limited volatility, caution with funds is crucial. This type of market is most prone to losses from emotional trading. In the current situation, pay close attention to the bottom and avoid making trades you're not confident in, or taking unnecessary risks. If a clear structure and direction emerge later, I will notify everyone immediately so you can follow the trend. Market opportunities can wait, but risks never wait. Staying calm, seeing clearly, and then acting is the true path to profit.

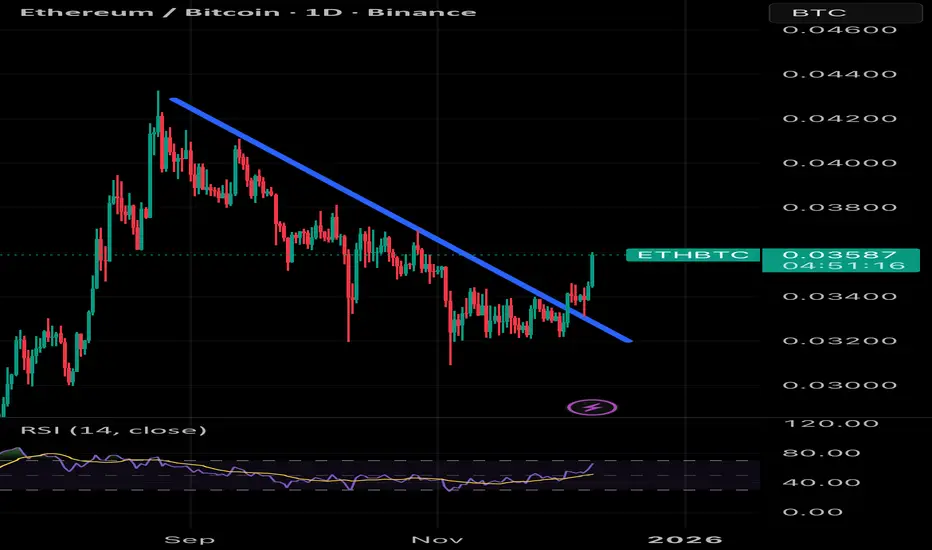
$ETH / $BTC Breakout on Daily TimeframeETH/BTC has appeared to breakout on the daily timeframe, with a successful backtest and continuation higher. This is a great sign for alts in general, but remaining cautious with all the volatility that comes with FOMC decisions. Would like to see this hold and have a strong weekly close to give a clearer picture on mid term direction!

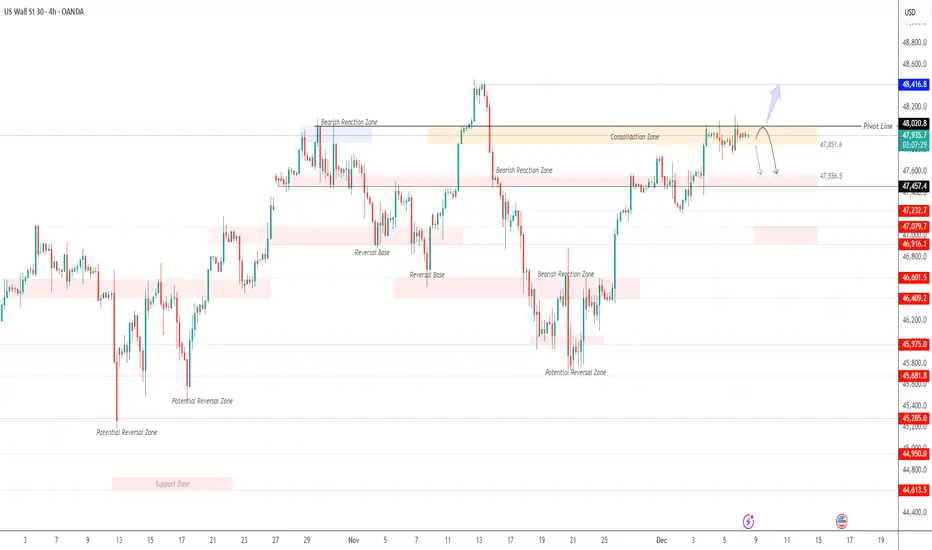
US30 | Markets Brace for Fed Rate Cut DecisionUS30 – Technical Overview
Wall Street futures edged higher on Monday as traders prepared for one of the most closely watched—and divisive—Federal Reserve meetings in recent years.
Markets widely expect the Fed to deliver its long-awaited interest rate cut this week.
Last week’s delayed data showed moderate growth in consumer spending late in Q3, further boosting confidence that policymakers may prioritize supporting the labor market and reducing borrowing costs.
Technical Analysis
US30 continues to trade below 48020, indicating that bearish momentum remains in control.
As long as price stays under this level, the index is expected to move toward 47770 and 47460, with 47560 acting as an intermediate support.
A bullish reversal requires a 1H candle close above 48020, which would confirm a shift in momentum and open the way toward 48410 and potentially the ATH region.
Key Levels
Pivot Line: 48020
Support: 47770 · 47560 · 47460
Resistance: 48300 · 48410
USD/CAD Pair structure and forecast.USD/CAD – Market Structure & Forecast
USD/CAD has completed a strong bearish leg, breaking structure (BOS) on the way down and forming a clear demand zone near support. Price has recently shown signs of accumulation, including internal CHoCH signals indicating a potential shift from bearish to bullish order flow.
Current structure shows:
Multiple CHoCH signals around the low, suggesting buyers are stepping in.
A corrective push upward followed by a pullback into a POI (Point of Interest).
The POI aligns with a small demand zone inside the larger support area.
A bullish BOS above this POI supports continuation to the upside.
Projection:
If price respects the POI and maintains bullish structure, USD/CAD may expand upward toward the major resistance zone above 1.39600.
Bias: Bullish (as long as support and POI hold)
Key Levels:
Support: Demand zone at the bottom of the chart
POI: Minor demand where the pullback is expected
Target: Higher resistance block above 1.3960
What you think about USD/CAD, write in the comment section.

XAUUSD NEWEST TODAY 11, DEC 🔹 MARKET BRIEFING – XAU/USD
Market State:
– Price has bounced strongly from the demand zone and is now holding above the support zone, showing clear bullish momentum.
Key Levels:
– Support Zone: 4218
– Target 1: 4236
– Target 2: 4247
– Target 3: 4259
Next Move:
– Bullish bias remains dominant; a retest of the 4218 support zone could trigger the next upward leg toward 4236 → 4247 → 4259.

EUR/USD Is Compressing — A Breakout Is Getting Close📊 (1) MARKET STRUCTURE
NZD/USD is moving inside a well-defined descending channel, creating:
Lower Highs
Lower Lows
However, the most recent bearish swings are shorter and losing momentum —
a signal that the downtrend is weakening.
📉 (2) PRICE REACTION
Every touch of the channel’s lower boundary triggers a visible reaction upward.
Recent candles show:
Smaller bearish bodies
Wicks rejecting the lows
Early signs of micro higher lows
These elements indicate absorption of sell pressure.
⏳ (3) HTF CONTEXT
On the H1 structure:
Price is sitting at the oversold edge of the channel
Momentum is compressing
The market is forming a tight consolidation zone
This compression phase often precedes a bullish breakout.
📐 (4) EXPECTATION
High-probability scenario:
Price may dip slightly to retest 0.5960 – 0.5965
A new higher low forms
Breakout of the upper channel line
Price extends toward 0.6025 – 0.6040
This is a textbook reversal from the channel floor.
🎯 (5) TRADING SIGNAL
BUY SETUP
Entry: 0.5960 – 0.5965
Stop Loss: Below 0.5940
Take Profit:
TP1: 0.5990
TP2: 0.6015
TP3: 0.6038 (breakout target)
Key Advantages
Weakening bearish momentum
Clean reactions from channel support
Tight compression before breakout
High R:R opportunity with controlled risk

EURUSD Will Rise After BreakoutHello Traders
In This Chart EURUSD HOURLY Forex Forecast By FOREX PLANET
today EURUSD analysis 👆
🟢This Chart includes_ (EURUSD market update)
🟢What is The Next Opportunity on EURUSD Market
🟢how to Enter to the Valid Entry With Assurance Profit
This CHART is For Trader's that Want to Improve Their Technical Analysis Skills and Their Trading By Understanding How To Analyze The Market Using Multiple Timeframes and Understanding The Bigger Picture on the Charts

BNBUSDT the resistance Broke wait for volume and pumpAs observed on the chart, BNBUSDT has executed a decisive breakout above its descending channel, indicating a potential trend reversal. The price is now consolidating in a range, which is typical behavior following a significant breakout as the market digests the move and builds a new support base. We anticipate the next upward impulse to begin upon an increase in trading volume, which would confirm buyer commitment and likely propel price toward higher resistance targets.
DISCLAIMER: ((trade based on your own decision))
<<press like👍 if you enjoy💚

The market is dead unless the 0.000014$ breakThe technical structure for SHIB presents a high-potential setup, with a measured growth projection of 5x to 7x from the current price of $0.000008. However, this bullish scenario is contingent upon a decisive breakout above the two key descending trendlines, with a confirmed move beyond the $0.000014 resistance level required to validate the reversal and initiate the next upward phase.
DISCLAIMER: ((trade based on your own decision))
<<press like👍 if you enjoy💚

BTC/USD - LongBTC/USD is in upward trend on daily timeframe. Following are crucial support and resistance levels.
Support 1 - 91500
Support 2 - 90720
Support 1 - 85440
Support 1 - 83680
Strong Resistance - 94115
Target 1 - 98126
Target 2 - 100607
Keep an eye on these levels. Breakout or Breakdown can happen on 94115. Strong green candle need to be closed above this level and shall sustain for a day or two.
Hoping to see crossing 100000 level before new year.

Bitcoin to $100kBitcoin is ready to push one more time to reach a very important resistance area at $100k

PDD shortDowntrend + Flag (continuation pattern ), trendline break + retest
Looks like ABC Pattern.
Estimate: Quick drop after consolidation in downtrend.
Stop 120,
Short entry 116
Target 96
Risk management is much more important than a good entry point.
I am not a PRO trader.
In my trading plan, the Max Risk of each short term trade should be less than 1% of an account.

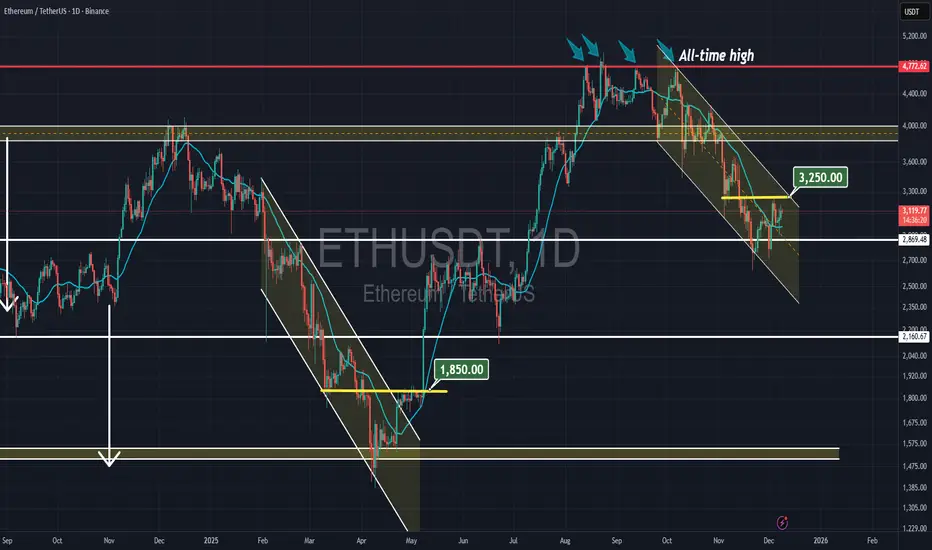
Ethereum Wave Analysis – 9 December 2025- Ethereum broke daily down channel
- Likely to rise to resistance level 3600.00
Ethereum cryptocurrency recently broke the resistance zone between the resistance level 3200.00 (which stopped the previous impulse wave 1) and the resistance trendline of the daily down channel from October.
The breakout of this resistance zone accelerated the active impulse wave 3 of the sharp intermediate impulse wave (C) from November.
Given the bullish sentiment seen across the crypto markets today, Ethereum cryptocurrency can be expected to rise to the next resistance level 3600.00.

USD/JPY Surge Targets Yearly Open- Fed to Dictate BreakoutUSD/JPY broke out of the late-November downtrend this week with a three-day rally now extending nearly 1.7% off the December low. The rally is trading within the confines of a tight channel formation, with the upper parallel highlighting upcoming resistance at the 78.6% retracement / 2025 yearly open at 157.14/19 and the 2025 high-day close (HDC) / November high at 157.70/90. A breach / daily close above this threshold would be needed to fuel the next major leg of the USD/JPY advance with subsequent resistance objectives eyed at the yearly high at 158.88 and the 2024 April high at 160.22.
Monthly open support rests at 156.18 and is backed by the weekly open at 155.36. Losses below the 155-handle would suggest a more significant high is in place and a larger correction is underway towards with the 23.6% retracement of the April rally at 153.65. Look for a larger reaction there IF reached.
Bottom line: USD/JPY is approaching confluent resistance into the 2025 yearly open and a breakout of the initial December opening-range keeps the near-term focus higher for now. From a trading standpoint, losses should be limited to 155.36 IF price is heading for a breakout on this stretch with a close above 157.90 ultimately needed to mark resumption of the broader uptrend.
-MB

XAUUSD Bullish Trend in Play — Path Open Toward 4,300 TargetHello traders! Here’s my technical outlook on XAU/USD (Gold) based on the current market structure. Gold remains in a broader bullish trend, supported by a clearly defined rising Trend Line that has guided price action since the beginning of the impulsive move. After the initial breakout from the Support Level, the market formed a well-structured range, followed by a corrective pullback and another consolidation phase, confirming healthy bullish rotation. Price is currently trading above the key Support Level near 4,140, while attempting to stabilize above the rising Support Line, which keeps buyers in control of the short-term structure. The recent breakout from the second range indicates renewed bullish momentum, with price now approaching the major Resistance Level around 4,260–4,270. As long as Gold holds above the support zone and respects the ascending trendline, the bullish scenario remains valid. The structure suggests continued pressure toward the upside, with TP1 positioned near 4,300, which aligns with the next key resistance area. A clean breakout above this level could open the door for further trend continuation and higher upside targets. However, a failure to hold the Support Line could lead to a deeper pullback toward the lower support zone. For now, the technical structure favors the buyers, with bulls aiming for a retest and breakout of the 4,260–4,300 resistance zone. Please share this idea with your friends and click Boost 🚀

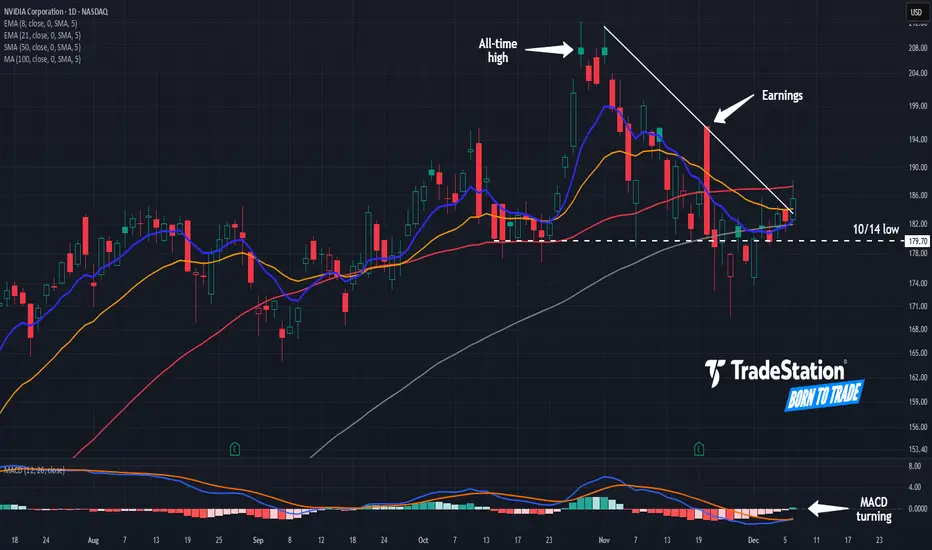
Is Nvidia’s Next Up Leg Coming?Nvidia has paused after a rally, and some traders may think the next up leg is coming.
The first pattern on today’s chart is the series of lower highs since November 3. The AI chip giant closed above that falling trendline yesterday, which could mean that the short-term resistance is fading.
Second is the failed rally on November 20 after earnings and revenue beat estimates. MACD was falling at the time, which prevented the shares from holding their gains. But now the oscillator has turned up, which may suggest that momentum has grown more favorable.
Third, prices have consolidated around their 50- and 100-day simple moving averages. That could reflect a bullish long-term trend.
Next, the 8-day exponential moving average (EMA) is rising toward the 21-day EMA. Crossing above may signal bullishness in the short term.
Finally, NVDA is a highly active underlier in the options market. (Its average daily volume of 3.6 million contracts ranks first in the S&P 500, according to TradeStation data.) That may help traders take positions with calls and puts.
TradeStation has, for decades, advanced the trading industry, providing access to stocks, options and futures. If you're born to trade, we could be for you. See our Overview for more.
Past performance, whether actual or indicated by historical tests of strategies, is no guarantee of future performance or success. There is a possibility that you may sustain a loss equal to or greater than your entire investment regardless of which asset class you trade (equities, options or futures); therefore, you should not invest or risk money that you cannot afford to lose. Online trading is not suitable for all investors. View the document titled Characteristics and Risks of Standardized Options at www.TradeStation.com . Before trading any asset class, customers must read the relevant risk disclosure statements on www.TradeStation.com . System access and trade placement and execution may be delayed or fail due to market volatility and volume, quote delays, system and software errors, Internet traffic, outages and other factors.
Securities and futures trading is offered to self-directed customers by TradeStation Securities, Inc., a broker-dealer registered with the Securities and Exchange Commission and a futures commission merchant licensed with the Commodity Futures Trading Commission). TradeStation Securities is a member of the Financial Industry Regulatory Authority, the National Futures Association, and a number of exchanges.
Options trading is not suitable for all investors. Your TradeStation Securities’ account application to trade options will be considered and approved or disapproved based on all relevant factors, including your trading experience. See www.TradeStation.com . Visit www.TradeStation.com for full details on the costs and fees associated with options.
Margin trading involves risks, and it is important that you fully understand those risks before trading on margin. The Margin Disclosure Statement outlines many of those risks, including that you can lose more funds than you deposit in your margin account; your brokerage firm can force the sale of securities in your account; your brokerage firm can sell your securities without contacting you; and you are not entitled to an extension of time on a margin call. Review the Margin Disclosure Statement at www.TradeStation.com .
TradeStation Securities, Inc. and TradeStation Technologies, Inc. are each wholly owned subsidiaries of TradeStation Group, Inc., both operating, and providing products and services, under the TradeStation brand and trademark. When applying for, or purchasing, accounts, subscriptions, products and services, it is important that you know which company you will be dealing with. Visit www.TradeStation.com for further important information explaining what this means.
XAUUSD Set for Surge? Safe-Haven Demand and Fed Cut Bets AlignHey Traders,
In today’s session we are monitoring XAUUSD for a potential buying opportunity around the 4,200 zone. Gold remains in a strong uptrend, and the current correction is bringing price back toward the key 4,200 support–resistance area, which could offer a favorable entry.
Fundamentally, GOLD should continue to benefit from the ongoing weakening of the U.S. Dollar, driven by expectations of a 25bps rate cut. As we head into Wednesday’s FOMC, markets are likely to keep front-running the event, which typically pressures the dollar lower.
Just be cautious—if we see too much front-running, the classic “buy the rumor, sell the fact” reaction could hit once the decision is officially announced.
Additionally, rising geopolitical tensions between Venezuela and the United States are increasing safe-haven demand, which further supports upside for Gold.
Trade safe,
Joe.

GOLD – Liquidity Build-Up Ahead of Fed DecisionGOLD – Technical Overview
Gold is entering a high-tension phase as markets position ahead of the upcoming interest-rate decision by the
With a 25 bps cut nearly guaranteed, traders are shifting focus away from the decision itself and toward how the market reacts to it, especially in the hours surrounding the announcement.
Unlike earlier this year, the market is showing signs of pre-event positioning, where price stalls inside a broad range while liquidity builds on both sides. This type of structure often precedes a sharp directional break, but not before a sweep of the weaker stop-zones.
Additional pressure is coming from renewed tariff threats by
Donald Trump, which have weakened the
US Dollar Index and created a supportive backdrop for gold.
Market participants are also preparing for the delayed JOLTS job-openings report, which historically triggers a spike in intraday volatility. In previous cycles, gold has tended to dip into deeper support before recovering during the first 24–48 hours after a rate cut.
Overall, the current structure suggests a market that is coiling, waiting for enough liquidity to be collected before the next major move.
Technical Outlook – Liquidity Concept Added
Gold is now approaching 4198, a key intraday liquidity zone.
A 15min or 1H close below 4198 will unlock the bearish continuation toward
→ 4181 (liquidity pool)
→ 4152 (deep liquidity + strong demand zone)
These levels align with typical pre-FOMC liquidity grabs.
While above 4198, gold will consolidate between 4198 and 4218 until the next break.
A break and 1H close above 4218 will activate bullish momentum toward: 4237
→ Higher extensions if volatility expands post-data.
Pivot Line: 4204
Support: 4198 · 4181 · 4152
Resistance: 4218 · 4237

ETHEREUM is about to EXPLODEEthereum is doing similar thing it did in April 2025 :
- Falling channel
- Breaking resistance
- Rise again
GBP/USD: Very Bullish PatternThe GBPUSD pair is currently trading in a long term bullish trend.
Earlier this month, the market established a new higher high, subsequently initiating a corrective movement.
A bullish flag pattern has formed, within which a minor bearish trend has been established.
Yesterday, the pair began to appreciate, with buyers successfully violating the resistance level of the flag.
This development may potentially instigate a trend-following movement.
The next objective is 1.3385.

EURUSD: Bullish Push to 1.174?As the previous analysis worked exactly as predicted, FX:EURUSD is eyeing a bullish breakout on the 4-hour chart , with price forming a series of lower highs and higher lows in a contraction pattern near resistance and support zones, converging with a potential entry area that could ignite upside momentum if buyers break the downtrend line amid recent consolidation. This setup suggests a reversal opportunity after the pullback, targeting higher levels with strong risk-reward.🔥
Entry between 1.1591–1.1617 for a long position (entry at current levels with proper risk management is recommended). Target at 1.1742 . Set a stop loss at a daily close below 1.1582 , yielding a risk-reward ratio of approximately 1:4. Monitor for confirmation via a bullish candle close above entry with rising volume, leveraging the pair's potential recovery.🌟
Fundamentally , EURUSD is trading around 1.167 in early December 2025, with key events this week potentially influencing direction. For the Eurozone, Tuesday's Flash CPI (YoY: Forecast 2.1%) and Core CPI (YoY: 2.4%) could support EUR if inflation holds steady, signaling ECB policy stability, while Friday's final Q3 GDP (QoQ: 0.2%) may reinforce modest growth. Thursday's Retail Sales (MoM: Actual 0%, Forecast 0.1%; YoY: Actual 1.5%, Forecast 1.3%) showed mixed results, with stronger YoY potentially bolstering consumer demand views but flat MoM raising softness concerns. For the US, Monday's ISM Manufacturing PMI (Forecast 49.0) and Fed Chair Powell's speech could weaken USD if dovish, amid rate cut hopes; Wednesday's ADP Nonfarm (Forecast 19K) and ISM Non-Manufacturing (Forecast 52.0) may pressure USD further on weak data; Thursday's Initial Jobless Claims (Actual 191K, Forecast 220K) beat expectations, suggesting labor resilience that might limit USD weakness; and Friday's Michigan Consumer Sentiment (Forecast 52) could weigh on USD if softer. Overall, disappointing US labor stats (e.g., recent rises pushing EURUSD up 0.40% to 1.1668) and Fed cut optimism could favor EUR strength, though resilient claims may cap gains. 💡
📝 Trade Setup
🎯 Entry (Long):
1.1591 – 1.1617
(Entry at current levels is acceptable with proper risk management.)
🎯 Target:
1.1742
❌ Stop Loss:
Daily close below 1.1582
⚖️ Risk-to-Reward:
≈ 1:3+
💡 Your take?
Does EURUSD break the downtrend and push toward 1.1742, or does USD resilience slow the breakout?
