SOL holds up wellCRYPTOCAP:SOL Price continues lower in the channel, a textbook ABC correction so far.
Wave 1 ended with a wedge throw-over. Price has found support above the Fibonacci golden pocket and High Volume Node at the channel's lower boundary. The probability is a continuation to the downside with a target of $140.
📈 Daily RSI tapped oversold with no divergence to suggest a bottom
👉 Continued downside brings up the $112 target, a great buy opportunity
Safe trading
Trend Lines

HBAR back in the channel!CRYPTOCAP:HBAR Price is back in the descending range after dropping below during the flash crash, which can be viewed as an anomaly.
Wave 2 appears complete at the golden pocket Fibonacci retracement. Price was rejected at the daily 200EMA and channel upper boundary and has lost the daily pivot and High Volume Node, suggesting further downside is to come.
📈 Daily RSI reached oversold and has printed hidden bullish divergence, which is bullish
👉 Continued downside has a target of the $0.13 High Volume Node
Safe trading

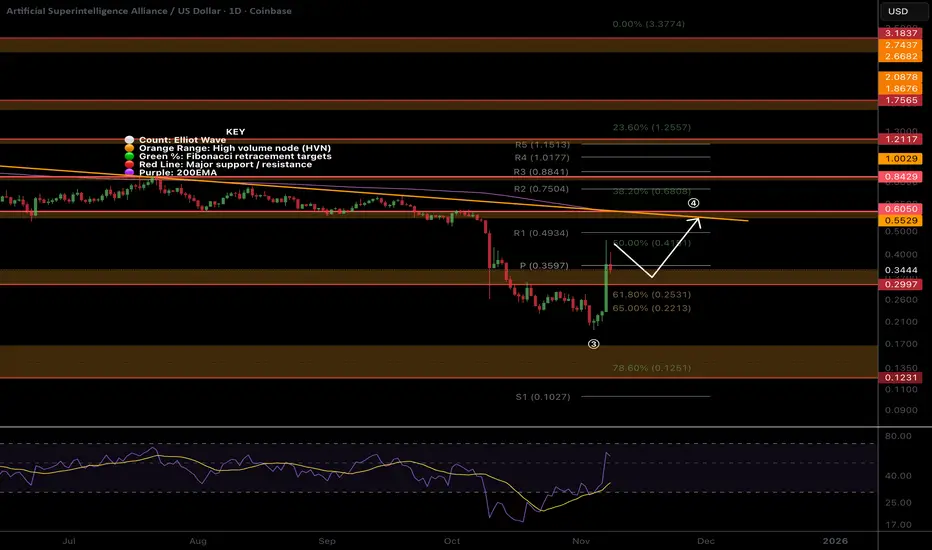
FET, Pump and dump?NYSE:FET Price bounced with a one day candle of 70% recovering the High Volume Node resistance and daily pivot from the golden pocket Fibonacci retracement.
Chasing candles higher is what’s on the cards of naive investors now. Greed and FOMO immediately took over socials with much gloating. This is a recipe for lower, humbling them.
📈 Daily RSI went too high, too fast, and now has bearish divergence in a bear market, a strong signal.
👉 Continued upside has a target of the daily 200EMA and High Volume Node resistance at $0.6.
Safe trading
ETH at critical level around 200SMALast time ETH hovered around it, it acted as a resistance to the price action. after ETH broke up from it they were far apart until now, if ETH hold around and above it, it is going back to the 4K USD in no time. Also it looks like ETH respects the 50% Fibonacci level. Im buying BMNR!


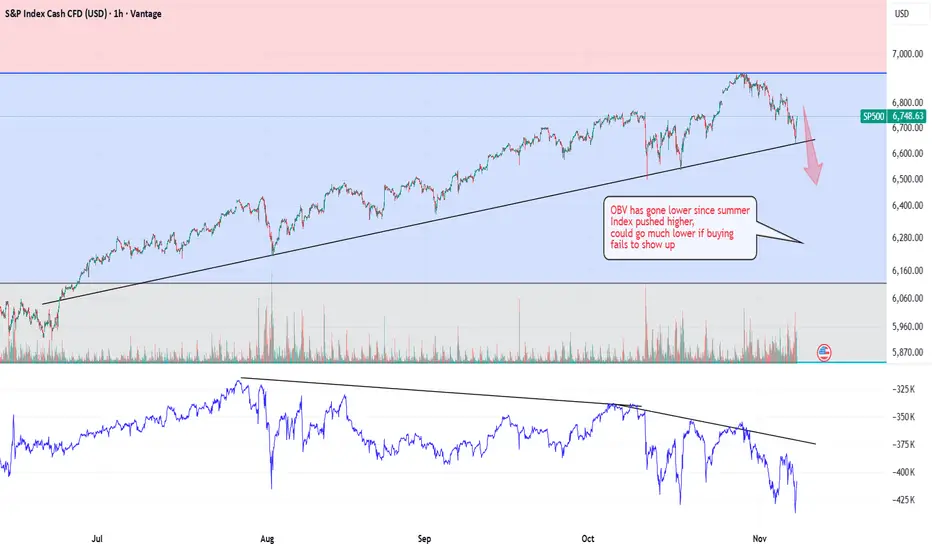
SP500 is weak about to drop through trend line Fib 1.618 madeBearish set up, (following on from my other post where the price at the top of the market hit a fix 1.618 extension of the prior recent down move almost to the tick, which I told people about before it happened as a great potential inflection point) Yes I am short.
The trendline must hold for the bulls,
The OBV on balance volume suggests weakness in the index
Suggesting the trend line will not hold for long, unless buying comes in
Next stop back will be lower, most likely with bear market rallies
I think we will test 4800 again between now and end of next year.
If a sell off starts it could be extreme, the market is weak.
There are hardly any bears left, mutual funds have minimal cash on side lines left to buy.
Government shutdown in USA has woken people up to having not everything in the markets and need cash on hand to pay bills if they dont get paid by Government.
We are only down 4% from a potential top, imagine selling the top within 4% in a few years time that will be acceptable for most traders. Even as a hedge and to bank some of those gains.
If it turns out to be a top, just sell a few contacts each few until you build up a nice sized position. Watch out for bear market rallies. Ifs a bear they will be super sharp upside, and then you can sell them at size. Look back historically to see how much these bear market rallies rise,
I notice that you can draw a nice downside trend line in a bear market and just sell every time the price hits that trend line to be very well off if it turns out to be a bear. not advice only fictional trading, of those that work hard at trading to make theirs and others dreams come true. Be grateful that you saw this now and took the time to understand the risks and potential gains because it could change your life
USDJPY Eyes 153.000 Support as Hawkish Fed Keeps Dollar Bid!Hey Traders,
In the coming week, we’re monitoring USDJPY for a buying opportunity around the 153.000 zone. The pair remains in a clear uptrend and is currently in a correction phase, approaching a key support and resistance area at 153.000.
Fundamentally, the Fed’s recent hawkish tone emphasizing stronger than expected labor data and pushing back against December rate cut bets continues to support USD strength, keeping upward pressure on the pair.
A sustained reaction at 153.000 could signal the next leg higher.
Trade safe,
Joe.

AUDUSD Potential DownsidesHey Traders, in today's trading session we are monitoring AUDUSD for a selling opportunity around 0.65100 zone, AUDUSD is trading in a downtrend and currently is in a correction phase in which it is approaching the trend at 0.65100 support and resistance area.
Trade safe, Joe.

ESPR 1W: cholesterol therapy for patients and investors alikeEsperion Therapeutics (ESPR) has broken its long descending trendline and retested the $2.4–$2.6 support area, forming a solid triple bottom with rising volume. The stock is now holding above key moving averages, signaling accumulation. While above $2.5, the technical setup points to a move toward $6.4, aligning with major resistance and the 200-week MA.
Fundamentally, the company enters one of its strongest phases in years. Following earlier liquidity struggles, Esperion has stabilized its operations and regained investor confidence. The core growth driver is Nexletol (bempedoic acid), a non-statin cholesterol-lowering therapy for patients intolerant to statins. In 2025, combined Nexletol and Nexlizet sales jumped over 45% year-on-year, surpassing $170 million for the first nine months. Recent safety data were positive, leading to new approvals across Europe and Japan - expanding partnerships and licensing revenues. Cash position strengthened via milestone payments from Daiichi Sankyo and Viatris, reducing debt and supporting R&D without new dilution. Challenges remain: profitability is still out of reach, as marketing and development expenses stay high, though liquidity provides breathing room. The broader biotech sector’s rebound amid rate-cut expectations adds tailwind to revenue-backed small caps like Esperion.
Tactically, holding above $2.5 keeps the bullish trajectory intact toward $6.4. A weekly close below $2.3 would negate the setup and re-test lower support, though current accumulation favors the upside.
Esperion helps reduce cholesterol - ironic that its chart still raises investors’ heart rate.

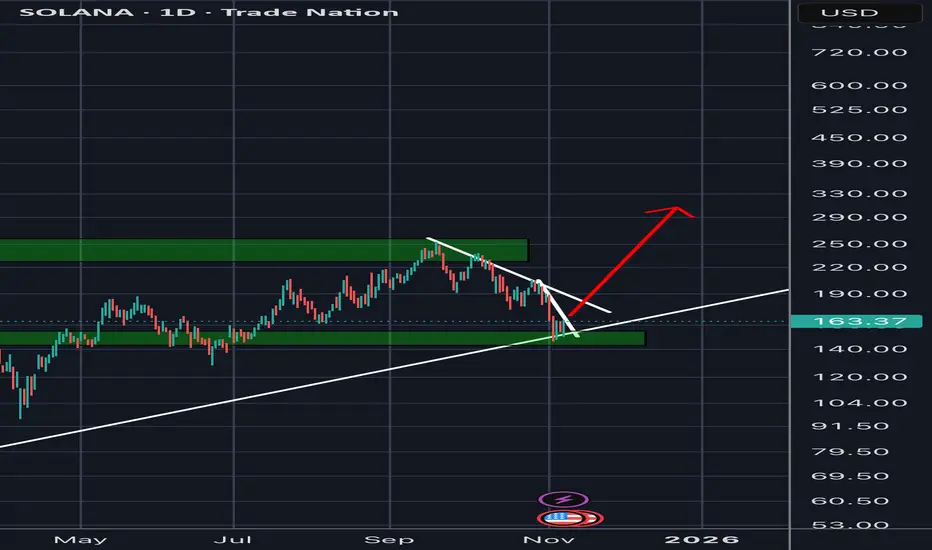
SOL aint looking that goodYes, the market structure isn't really broken and it hasn't lost any major support
Yes, it can go higher, a lot higher,
and yes it's been one of the best performers of this cycle .
Which makes it rather risky to short it. But it doesn't change the fact that it:
- Failed to beat critical levels
- By being one of the best performers, retail is loving it.
- Everyone is too comfy in longs.
The level i had for SOL back in last year happened to be the exact bottom, so I'm being cautious here.

Nasdaq Short: Peak Confirmed; Bear Market ConfirmedIt is now clear that the bull market ended on 30th Oct and that we have already seen the first completed wave down for Nasdaq that unfolded in clear 5-wave structure. The sub-waves also showed clear 5-wave structure themselves.
We are currently in a wave 2 retracement that is facing the first real support-turned-resistance. However, take note that wave 2 can technically go all the way up to the start of wave 1 without invalidating the idea. So look out for reversal signal or confirmation before you short.

#EDUUSDT #1D (ByBit) Descending trendline breakout and retestOpen Campus is pulling back to 100EMA regained support where it seems likely to bounce and recover midterm.
⚡️⚡️ #EDU/USDT ⚡️⚡️
Exchanges: ByBit USDT
Signal Type: Regular (Long)
Leverage: Isolated (1.0X)
Amount: 5.1%
Current Price:
0.1598
Entry Targets:
1) 0.1587
Take-Profit Targets:
1) 0.3456
Stop Targets:
1) 0.0963
Published By: @Zblaba
NYSE:EDU BYBIT:EDUUSDT.P #1D #OpenCampus #Education opencampus.xyz
Risk/Reward= 1:3.0
Expected Profit= +117.8%
Possible Loss= -39.3%
Estimated Gaintime= 2-3 months

The continuous short positions in gold have ended perfectly!Whether gold can break through resistance levels in the near term depends on the convergence of three factors: First, whether the US dollar and US Treasury yields experience a more sustained decline, creating room for discounting; second, whether risk appetite strengthens the "insurance demand" for gold due to equity volatility and increased macroeconomic uncertainty; and third, whether net inflows of funds continue, especially whether passive funds and longer-term allocation funds enter the market simultaneously. If these three factors fail to move in tandem, the price will likely continue to consolidate within the $3930-$4000-$4050 range. If they move in unison, the resistance above these round numbers will weaken more smoothly. It's worth noting that the People's Bank of China suspended its 18-month gold purchase program in May 2024 but resumed it in November of the same year. The market currently expects a 67% probability of a Fed rate cut in December, up from around 60% the previous trading day. The Fed just cut rates last week, and Powell stated that this may be the last rate cut this year. The market's current focus is on macroeconomic data and when the US government shutdown will end—which is also driving safe-haven demand for gold. The congressional gridlock led to the longest government shutdown in U.S. history, forcing investors and the data-dependent Federal Reserve to rely on private economic indicators. Since gold does not generate interest income, it typically performs well in low-interest-rate environments and periods of economic uncertainty.
Gold Technical Analysis: With the non-farm payroll data still pending, gold prices are likely to fluctuate little tonight, mainly consolidating. The battle between bulls and bears continues throughout the day. During the US session, gold rebounded to around 4027. We had already positioned short positions at 4015 and 4025, which subsequently fell back as expected, resulting in a profitable trade. This week's trading session has concluded perfectly, and we will not participate in the late-session trading. Our strategy remains to short below 4030.
From a technical analysis perspective, key resistance and support levels need to be monitored. The upper resistance level to watch is the 4020-4030 area. If gold prices can break through this range and hold, the upward trend may continue in the short term, potentially challenging higher levels. Before this breakout, we have consistently emphasized against chasing highs and have provided a strategy and analysis for shorting in batches around the 4015-4030 area. Those who follow me should have seen this. Gold faces significant upward pressure, and unless there is a major positive news event to stimulate a breakout, we will continue to maintain a strategy of selling on rallies. Due to the lack of non-farm payroll data, gold prices will continue to be treated as oscillating. The lower support level is seen in the 3975-3960 area. If this support level is effectively broken, it may trigger a new round of declines, potentially opening up further downside potential.

GOLD → The battle for the $4,000 zone. Are the bulls here?FX:XAUUSD is gradually recovering. The price is breaking through $4,000 and trying to stay above the key psychological level. Focus on 4,030–4,050...
Weak employment data, namely a sharp increase in layoffs in October, has heightened fears of an economic slowdown, a decline in government bond yields, and the ongoing correction of AI assets is fueling demand for safe havens.
The probability of a Fed rate cut in December has risen to 69%. The situation is stabilizing somewhat, there is no strong news today, and the market may try to maintain the current backdrop...
Gold retains its upside potential while macro risks remain. The $4000 level is currently acting as key support. Closing the week above this mark will open the way to test $4050.
Resistance levels: 4030 - 4050
Support levels: 4000, 3975, 3956
The dollar and gold are rising, and the inverse correlation is decreasing, indicating that bulls are still trying to keep the market from falling sharply. However, given the lack of drivers, strong news, and a clear fundamental backdrop, I would say that gold is not yet ready to break out of its current range. Consolidation above 4K could lead to a retest of 4030-4050, which in turn could trigger a pullback to local support.
Best regards, R. Linda!

Gold Upholds Trendline Support, Targeting 4010Gold price is following an upward trendline, holding above the support zone near 3984. The next target is set at 4010 if bullish momentum continues.

Bullish trend reversal with divergence & Double bottomIn a 1H chart, AUDJPY is showing a "Bullish divergence" and "Double bottom" that may reverse the trend to be bullish soon...
Entry can be initiated once the neckline is broken at around 99.6

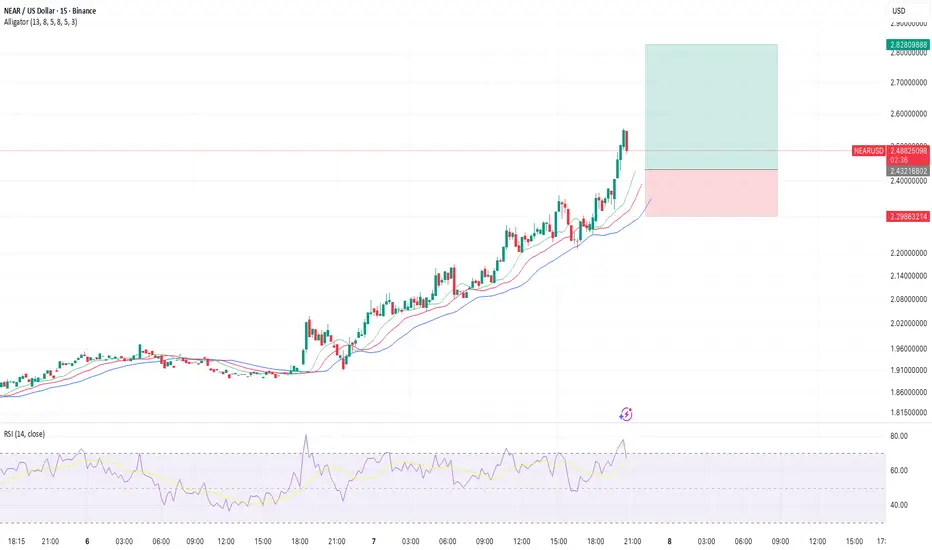
NEARUSD, 1H, 1:3 RRRUsing FVG (Fair Value Gap), it would reap a RR of 1:3. Entry point 2.432, SL 2.298, and TP around 2.828
Will gold's rebound be followed by another decline?It's hard to explain in a few words. By Friday, the market was still fluctuating and oscillating. Gold had just reached a very critical juncture. Is there anything strange about the current position? No, not really. We've seen 4000 points multiple times since Monday, but the candlestick patterns and their arrangement have gradually turned 4000 into a significant resistance level. Two trend lines are evidence of this. First, there's the downtrend line at the top, which is right around 4000. I know it broke down, but does breaking down mean it has stabilized? We definitely shouldn't rush to make a decision.
Moreover, the upward trend line at the bottom is clearly over, and the expected resistance level is exactly the same as yesterday's level around 4020. If you look at it this way, it's a perfect double top pattern. I don't need to say what this pattern should do, it's definitely bearish. You can also put the stop loss above 4030, a loss of only about 10 US dollars, which is quite cost-effective. If it can break through 4030, then there's no need to trade anymore, just in case gold goes crazy. It's quite comfortable like it is now.
Finally, there's the issue of targets. I'm actually struggling with this too. Today is the last trading day of the week, and holding positions over the weekend isn't ideal. However, assuming 4018 really did top out and the price actually fell, exiting midway would be a huge loss, and it might be difficult to find a good entry point later. Regardless of how much it could fall, at least after this double top pattern formed, gold breaking below 3960 shouldn't be a major problem. Conservatively speaking, I'd suggest aiming for 3980, depending on whether you're a short-term trader.
Since the price of 3960 has encountered support and rebounded multiple times this week, there's no need to set a target at 3960. In other words, if it really drops to 3960, it might go down, resulting in a profit of about $40. Let's just see if it reaches 3980. As for whether to go long again later, I still suggest avoiding unnecessary trading. Everyone keeps saying they want to see the US government reopen, but it's been two days since Trump suggested ending the lengthy debates, and there's been no new information, not even news of a vote.
After such a long closure, and the second time the non-farm payrolls report was missed, even inflation statistics are being compiled, so why isn't employment data being collected? If I were to speculate maliciously, I'd say it's because employment is simply unsustainable. Just think about how long the closure lasted in October; aside from everything else, how much of the workforce has been lost officially? Not to mention the current situation where businesses have low demand. Previously, layoffs were slow and hiring was gradual, but now layoffs are being accelerated and hiring is being reduced. I really don't know how shocking the non-farm payrolls report will be. This is why I expect the market to fall at the open and then rise. The data is too uncertain, and it doesn't look like good news no matter how you look at it. Let's wait and see. I'm actually hoping that the market will break through this level starting from the opening.

NAS100 Bullish divergence on 1HNAS100 is showing a Bullish divergence in RSI in a 1H chart. This can be confirmed if the neckline breaks the LH at around 25270 points.

Market volatility, trade steadily.#XAUUSD TVC:GOLD OANDA:XAUUSD
As mentioned last night, gold prices failed to break below the important short-term support level of 3965, so we maintain our bullish view. Although the intraday volatility was not high, the consolidation process can be seen as gold accumulating positions in the short term. Market breakout requires patience. Currently, the daily MA5 and MA10 moving averages are converging around 3980, which is also where the 4-hour middle band is located. The key resistance level in the short term is in the 4015-4030 area. A break above this level could lead to further gains towards 4050-4080.
It's important to be cautious given the recent volatile market with poor continuity. Therefore, even if a breakout occurs today, it is not advisable to rush to buy. Instead, wait for a pullback before entering the market to avoid being trapped by blindly chasing highs. The 3980-3965range remains the ideal entry point for bulls. Maintaining patience is always a key element in trading.

Nifty Analysis EOD – November 7, 2025 – Friday🟢 Nifty Analysis EOD – November 7, 2025 – Friday 🔴
Bulls fight back from the edge — but can they hold the ground?
🗞 Nifty Summary
Nifty opened with a sharp 77-point gap down and extended losses by another 128 points, testing the important support zone early in the session. After forming the day’s low, the index stayed range-bound between 25,318 ~ 25,383 till 11:10 AM, when a strong breakout lifted it above the IB High cum Day High, reaching 25,460 with confidence.
This level acted as a crucial resistance, triggering a mild pullback as price began forming a narrow upward-sloping channel, reflecting indecision. The battle between bulls and bears was clearly visible in these mid-session candles.
At 13:25 PM, Nifty again broke the PDL and climbed toward the 25,550 resistance, where both the horizontal resistance and the longer-timeframe trendline converged — pushing the index back to 25,460. Another breakout attempt failed at the trendline, and the index finally closed at 25,509.70, just 9 points below the previous day’s close.
Despite the flat finish, bulls celebrated a 192-point intraday recovery — a sign of returning confidence after multiple bearish sessions. For this momentum to sustain, Nifty must hold the 25,440 ~ 25,460 zone in the upcoming session.
As noted in yesterday’s commentary, bias remains bearish below 25,640 — hence, a decisive close above this level will be crucial to confirm a short-term shift in sentiment.
🛡 5 Min Intraday Chart with Levels
📉 Daily Time Frame Chart with Intraday Levels
🕯 Daily Candle Breakdown
Open: 25,433.80
High: 25,551.25
Low: 25,318.45
Close: 25,492.30
Change: −17.40 (−0.07%)
🏗️ Structure Breakdown
Type: Doji-like candle with a narrow body and long wicks on both ends.
Range (High–Low): 232.8 points → volatile, yet ended with indecision.
Body: ≈ 58.5 points → minor directional conviction.
Upper Wick: ≈ 58.95 points
Lower Wick: ≈ 173.85 points → strong intraday buying from lows.
📚 Interpretation
Nifty opened lower, slipped toward 25,320, but strong buying emerged from this support zone, driving prices higher through the morning and midday sessions. The recovery above 25,490 signals that bulls are defending crucial zones but still lack follow-through conviction. The long lower wick underscores short-term exhaustion of selling pressure, though the flat close reflects hesitation at overhead resistance.
🕯Candle Type
This session forms a Long-Lower-Wick Doji, typically seen near short-term supports. It hints at the possibility of a base-building phase, but confirmation will depend on a strong follow-up candle next session.
🛡 5 Min Intraday Chart
⚔️ Gladiator Strategy Update
ATR: 204.31
IB Range: 128.65 → Medium
Market Structure: ImBalanced
Trade Highlights:
11:10 – Long Trade → Target Achieved (R:R 1:3.27)
12:50 – Long Trade → Target Achieved (R:R 1:2.58)
📌 Support & Resistance Levels
Resistance Zones:
25,550
25,585
25,615 ~ 25,635
Support Zones:
25,460 ~ 25,440
25,380
25,340
25,310 ~ 25,290
💡 Final Thoughts
After a streak of weak closes, today’s long-lower-wick candle shows visible buying interest near critical supports. Bulls defended the base well, but they must now prove strength through sustained follow-through above 25,640. For traders, the focus should stay on structure — as long as 25,440 holds, this rebound attempt remains valid.
“The first bounce doesn’t confirm reversal — it only tells you the bears have finally met resistance.”
✏️ Disclaimer
This is just my personal viewpoint. Always consult your financial advisor before taking any action.

GBPUSD: trend broken, channel breakout — sellers stay in controlFor a long time the pair was moving inside an ascending channel, with the upper boundary acting as resistance. Now we see a trendline breakdown and a confirmed exit from the channel. Price is below EMA 50 / EMA 100 / EMA 200, confirming bearish structure. After a strong impulse down, price is pulling back into the Fibonacci zone 0.382–0.705 (1.3330–1.3165) — this is a potential area to look for a short entry. Main target remains 1.2740, which aligns with the next strong support zone. Strategy: waiting for a pullback → weakness confirmation → entering short on price action signal. Invalidation = breakout and consolidation above 1.3520.
BOE remains dovish, rate cut expectations for 2026 are rising. USD remains supported by stronger macro data and higher yields, while divergence between monetary policies continues. As long as this divergence persists, GBPUSD bias stays bearish.
Charts don’t care about hopes. Wait for a pullback, stick to the plan, execute the setup — not the emotions.
