QXO. It doesn't get better than this. Not IF but WHEN!I want to start by saying upfront - even though this video has a confident title, nobody truly knows what the market is going to do next. All any of us can do is interpret the story the chart is telling and share our perspective. So this is not financial advice — please do your own research, especially with a company like this, which has a unique history and is led by one of the most impressive American operators in Brad Jacobs.
I’ve talked before about the fundamentals here and the broader business potential. The analyst coverage is strong - 12 Buy ratings (100% Buy) with an average price target of $32 (range: $27 to $50) . And there’s plenty of great content online if you want to go deeper - interviews and podcasts featuring Brad and the leadership team.
Operationally, they're executing extremely well. Their first major acquisition - Beacon Roofing Supply - is performing, and the company has stated very clearly that they expect to make multiple acquisitions over the next few years. Their long-term goal? To build this into a $50B revenue business within the decade. Ambitious, yes. But realistic if you know Brad’s track record.
But you probably already know that part. You're here for the technicals.
So let’s talk about the story of this chart.
The video walks through this in detail, but the key takeaway is this: we’re currently seeing the exact same liquidity build that formed during the previous breakout from $12 → $24. The same behavior. The same algorithmic demand building. The same storytelling structure in price.
This is where trading gets interesting - because if we structure our plan across short-term, mid-term, and long-term targets, we give ourselves a real edge.
Hope you enjoy the breakdown. I genuinely had fun putting it together.
Happy Trading All!
Trend Lines

USD/CAD Reversal from Channel Resistance ContinuesUSD/CAD rates are continuing their reversal lower within their multi-month uptrend following last week’s Canadian jobs figures. Stronger than expected jobs growth in Canada has helped tamp down Bank of Canada (BoC) rate cut odds through the end of the year, while the prospect of Trump’s tariffs being struck down by the Supreme Court have likewise emboldened the Loonie. In the options market, Canadian Dollar futures are currently in the 48th percentile for volatility over the past year, highest among major USD-pairs.
In the above chart, USD/CAD rates have backed away from rising channel resistance, marked by the February 2025 swing low near 1.4151. The reversal in recent sessions is pushing the pair back into the area between the 20-day exponential moving average (EMA) and 50-day EMA, which proved itself as support at the end of October. A drop below the 100-day EMA would produce a break of the rising channel in motion since mid-June. At first blush, dip buyers may be in play closer to 1.3900 on a continued pullback.


Long on Silver FuturesThis is an update on the long-term bull trend in silver as reflected in the futures market. First, the uptrend channel was reentered after a short breakout. This correction is good. It is strong as the heart line has not been broken and is seeking higher levels to break back out of the channel for the parabolic run. I am looking at a 49.80 USD marker to signal a true run back into price discovery.

USD/CAD Rally Stalls into Trend Resistance at Seven-Month HighsThe Canadian Dollar is getting reprieve today with USD/CAD snapping a six-day rally to seven-month highs. Stronger-than-expected Canadian employment figures amplified today’s decline with a reversal off uptrend resistance now threatening a deeper correction within the July uptrend. The immediate focus is on this pullback in the days ahead with the November opening-range taking shape above the median-line.
Initial support rests with the October high close at 1.4055 and is backed by the monthly open / May high at 1.4011/17- note that the medina-line converges on this threshold next week. Ultimately a break / close below the 2022 high / 61.8% retracement of the recent advance at 1.3977/85 is needed to suggest a more significant high is in place / a larger reversal is underway. Subsequent support rests with the 200-day moving average at (currently at 1.3940) with broader bearish invalidation steady at 1.3881/99- a region defined by the 2022 high-close and the 2023 swing high.
Initial resistance now eyed with the monthly high-close at 1.4115 and is backed by the 50% retracement of the yearly range / November high at 1.4167/78. A breach / close above this threshold would threaten another accelerated advance with subsequent top-side objectives eyed at the March low at 1.4235 and the 61.8% retracement at 1.4315.
Bottom line: USD/CAD has responded to uptrend resistance and the risk now rises for a deeper pullback within the broader July advance. From a trading standpoint, losses would need to be limited to 1.3978 IF price is heading higher on this stretch with a close above 1.4178 needed to fuel the next major leg of the rally.
-MB

Euro Testing September Downtrend- Breakout to Offer GuidanceEuro is responding to downtrend resistance at the upper parallel of the descending pitchfork we have been tracking off the yearly high. The monthly opening-range is taking shape just below and the focus is on a potential breakout over the next few days. Initial support rests at the October swing low and the monthly open at 1.1537/42. A break / close below the 75% parallel is ultimately needed to mark downtrend resumption with subsequent support objectives seen at the 1.15-handle and the monthly low at 1.1469- look for a larger reaction there IF reached.
Initial resistance remains with the upper parallel and is backed by the Fed-day reversal close at 1.1601. Ultimately a breach / close above 1.1641/45 is needed to suggest a more significant low is in place / a larger reversal is underway.
Bottom line: Euro is responding to downtrend resistance with the weekly / monthly opening-range taking shape just below. From a trading standpoint, rallies should be limited to 1.16 IF price is heading lower on this stretch with a close below 1.1469 needed to fuel the next leg of this decline.
-MB

DOGEUSDT weekly support hold strong wait for more pumpAs observed on the chart, the major weekly support for DOGEUSDT at $0.15 has demonstrated significant resilience, establishing a robust foundation for the asset. The subsequent bullish momentum we anticipated has indeed commenced, indicating a potential shift in market structure.
The critical technical level to monitor is the primary descending trendline resistance. A decisive and high-volume breakout above this resistance would serve as a strong confirmation of bullish strength, potentially invalidating the prior downtrend. Such a validated breakout could initiate a new bullish phase, with the potential to challenge previous cycle highs and establish new all-time highs on the chart.
DISCLAIMER: ((trade based on your own decision))
<<press like👍 if you enjoy💚

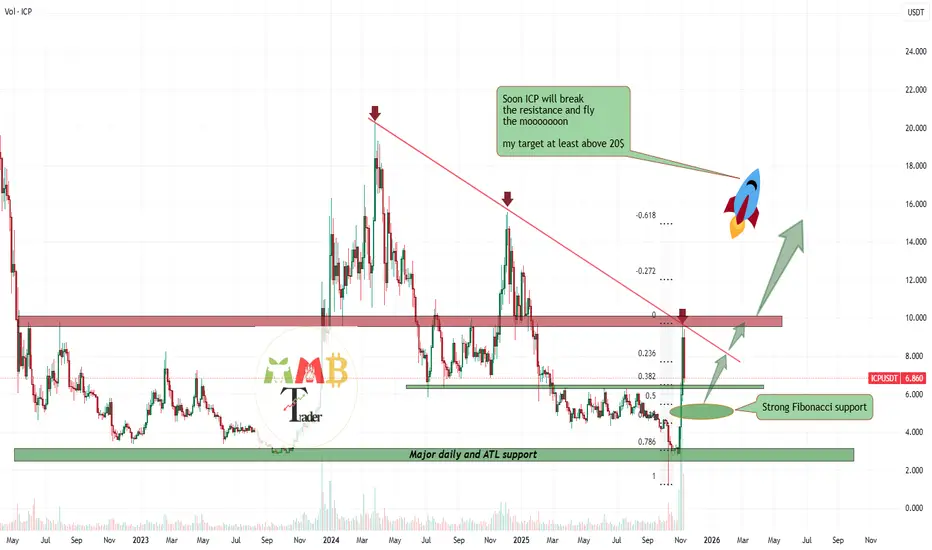
ICPUSDT targeting 20$ at least!!!!After an extended period of consolidation and underperformance following its all-time high, ICPUSDT has established a significant base and is demonstrating a strong recovery from its historic lows. The price is currently encountering a primary test at the key descending trendline resistance on the daily chart.
The technical structure suggests that the asset is accumulating strength for a potential breakout. A decisive and sustained move above this trendline could signify a major shift in market structure, potentially initiating a powerful bullish impulse. Based on the scale of the prior accumulation phase, such a breakout could project an initial upward move toward the $20.00 level, representing a potential appreciation of several hundred percent from current levels and even more pump after that may happen.
DISCLAIMER: ((trade based on your own decision))
<<press like👍 if you enjoy💚
SHIBUSDT soon two major resistance will break and then pump As observed on the SHIBUSDT chart, the price is undergoing a significant correction, consistently facing rejection at two distinct descending trendline resistance levels. Each test of these dynamic resistances has resulted in a sell-off.
However, the current technical structure suggests a potential for an upside breakout. The primary scenario is a decisive break above the first, more immediate trendline. This initial breakout would project a move toward the second, higher trendline as the initial technical target. Following a potential consolidation period, a subsequent breakout above the second trendline would signal a much stronger bullish trend activation, potentially initiating a sustained and significant upward movement.
DISCLAIMER: ((trade based on your own decision))
<<press like👍 if you enjoy💚

BTC/USDT: Lower Highs Hold as Price Stalls Below 109K ResistBTC/USDT fulfilled the prior move and is now struggling below the 109,000 resistance after rebounding from 99,000. Price remains in a descending channel, approaching a key confluence zone near 109,200 where upward and downward trendlines intersect.
If this level holds, a decline toward 102,250 support remains likely. The bearish bias stays intact as long as the lower high structure persists.
❗️ Risks:
– Break above 109,800 may trigger short covering.
– Dovish Fed or soft inflation data could lift sentiment.
– ETF inflows may drive renewed spot demand.

EUR/USD: Rebounding Off 1.15 as Buyers Eye Short-Term RecoveryEUR/USD is bouncing from the 1.15 psychological support after a fake breakdown of October’s low. Price is forming a short-term reversal inside a rising channel, hinting at a corrective bullish move.
If the pair holds above 1.1530, a push toward 1.1620 resistance is likely. Momentum supports a short-term bullish bias before the broader downtrend resumes.
❗️ Risks:
– A strong U.S. CPI print could trigger a sharp USD rally.
– Dovish ECB commentary may cap euro strength.
– Falling below 1.1520 invalidates the recovery setup.

GBPCHF: Wait For Breakthrough Then Swing BuyGBPCHF has been accumulating and currently all time low, we can see price distributing in soon time, however, before it does we need a stronger confirmation in form of breakthrough of the trend line. Once price has breached the trend line we can enter when price does the reconfirmation, this will give us enough confidence to enter swing buy position with strict risk management. If you like the idea then do consider liking and commenting our ideas.
good luck and trade safe!
Team Setupsfx_❤️🚀

DPZ - The market is setting up for something...The formations of "Cup & handles" as well as "Head & shoulders" are just visual ways to describe what the market is doing to be efficient.
The market's efficiency of course runs on the basic concept of supply & demand - but in order for that to happen efficiently, we need to constantly fight it out on multiple time frames to remove a certain side and then replenish at lower and higher levels.
In DPZ's case, we are looking to shake off buyers (built up at the $400 support level) in order to re-introduce newer and larger buyers at lower levels - subsequently replenishing buyers while also 'trapping' sellers.
This constant game of cat and mouse happens throughout all time frames - and is a big reason why most traders feel like they are constantly losing and that the market is against them - because it is!
Enough of the lesson - my thesis here is the market is intentionally building a large support base in order to break through, lose buyers (stopped out), trap sellers, and give the opportunity to big money to enter positions at attractive prices.
Target Entry: $380
Target Exit (Short term): $450
Target Exit (Long Term): $530
Happy Trading :)

The gold price trend is clear; opportunities lie in the timing!At the start of the week, the gold price chose a clear upward direction, breaking through key resistance levels at 4030 and 4050, reaching a high near 4095. From the overall trend structure, the bullish momentum remains strong, and the short-term trend is still robust. However, the upside potential is gradually being limited. The biggest mistake in trend trading is chasing emotions. I personally prefer to focus on resistance signals in the 4100-4120 area. If signs of resistance appear, consider shorting at higher levels. If the price retraces to the 4050-4030 area and stabilizes, that would be a more stable entry point for long positions. After the breakout, the pace accelerates. The key now lies in entry points and execution. Avoid chasing highs and blindly shorting; steadily follow the rhythm and wait for market confirmation. True stability lies not in prediction, but in the unity of execution and rhythm.

Double top after ascending triangle: 163$ will be retestedDouble top occurred at COINBASE:BTCUSD and at $COINBASE:SOLUSD. 163$ will be retested. I think we will see a bounce from there.

Nokia:Inverted Head and Shoulders Structure + Retest of BreakoutOn the weekly chart of Nokia, a classic Inverted Head and Shoulders reversal pattern has formed. The breakout above the neckline occurred with increased volume, confirming the strength of the move. Currently, the price is undergoing a standard technical retest of the neckline from above — a typical phase before a potential continuation higher.
The structure remains active: the projected height (H) points to an initial target at $5.48, based on the distance from the neckline to the head. If momentum continues, Fibonacci extension targets are located at $6.18 (1.272), $6.55 (1.414), and $7.08 (1.618).
Technical view: the retest of the neckline is happening on declining volume, strengthening the probability of a bullish reversal. EMA 50/100/200 are beginning to align in a bullish crossover. The ascending channel structure also supports the upward movement.
Fundamentals: Nokia is progressing with its strategic programs in 5G and upcoming 6G network technologies, reinforcing its long-term growth prospects. Improved financial performance and the recovery in demand for telecommunications infrastructure amid global digitalization trends continue to support investor interest in the stock.
The Inverted Head and Shoulders pattern is confirmed by the breakout and current retest. As long as the price holds above the neckline, the bullish scenario toward $5.48 and beyond remains intact. This is a medium-term trend reversal structure — strong setups like this form the foundation for major moves. Don’t miss them.

Joby Aviation Rally Ahead ? Be Mindful of this potential Trap
In this video I recap the original video before looking into what we can expect looking forward .
With the original idea still at play I see the potential for a push back into 18$ zone which would give a 30/40% rally .
I use some historical price action to demonstrate how this rally could lead to a trap or a reclaim of the 18$ level could be a sign of strength.

BULL outlook and necessary reversal confirmationsBULL is a tempting name for many being that it's traditionally compared to Robinhood in its' function. However, as a must younger company, they have ways to go in order to prove they are worthy of the attention Robinhood has received this year.
In this video, I outline the path necessary for BULL to prove a shift in control from sellers to buyers in the HTF picture. We can say that we are in a HTF bullish liquidity building structure (white) however in order to prove that, we need to see LTF confirmations.
Don't jump the gun too heavily on this one without the necessary confirmations!
Happy Trading :)

GOLD | Daily Analysis #5 - 10 November 2025Hello and Welcome back to DP,
Technical Analysis:
🟩 Demand Zones (Support Areas)
$4,025 – $4,060
This is the primary demand zone
Formed after a strong bullish impulse that broke previous structure highs.
Multiple bullish candles emerged from this zone with increasing volume — clear institutional buying footprint.
Acts as immediate support if price retraces.
A sustained hold above $4,060 keeps short-term buyers in control.
🟥 Supply Zones (Resistance Areas)
$4,108 – $4,148
Prior distribution area before the sharp drop in late October.
Sellers previously defended this level twice (confirmed by the red arrows).
Expect profit-taking or short setups on the first retest — this is major resistance in the short term.
First rejection likely near $4,120; a 2H close above $4,150 would invalidate the bearish pressure here.
$4,366 – $4,370 (black line above)
Upper-level supply and major swing high from October.
Would become the next upside target if price breaks and holds above $4,150.
SO, After forming a higher low near $3,760, price shifted bullish, breaking successive minor structure highs. Current move is an impulsive leg approaching the first strong supply zone ($4,108–$4,148).
The market is bullish in the short term, but approaching key overhead supply.
Disclaimer:
This content is for informational purposes only and does not constitute financial or investment advice. © DIBAPRISM
Amir D.Kohn

Gold contacted daily supply zone Those who followed last week gold set up are happy right now...
GOLD is inside DAILY SUPPLY ZONE.Downside pressure is expected

SPX | Daily Analysis #12 - 10 November 2025Hello and Welcome Back to DP,
Review and News:
Last week was quite eventful. The index plunged toward the 6,640 area before a sharp rebound—helped in part by a series of market-friendly statements and tweets from former President Trump, which appeared to lift sentiment. Despite trading down more than 1.3% intraday, the market recovered impressively and ultimately closed the session in the green.
This week, investors will be watching closely to see whether Trump continues to influence sentiment with further comments or appearances that could help fuel market volatility and optimism. The shutdown remains at the center of U.S. politics. The Senate has advanced a temporary funding bill extending federal funding through January and reversing some layoffs, but final approval by the House and the President’s signature is still pending. Until a resolution is reached, uncertainty will linger across markets and public services.
The October Consumer Price Index (CPI) report—typically one of the most closely watched inflation indicators—is likely to be delayed due to the ongoing federal government shutdown. The lack of fresh data is creating a “data fog” for policymakers and traders alike.
Technical Analysis:
🟩 Demand Zones (Support Areas)
6,735 – 6,748 region
Multiple touches and strong buying reaction.
Large bullish candles emerged after price retested this area → indicates strong institutional demand.
It’s the nearest demand and acts as immediate support.
If broken, next possible downside continuation zone would be near 6,700 – 6,710.
Lower demand extension (6,730 – 6,740)
Good confluence with volume spike at lows → buyers defended this region before a sharp move up.
🟥 Supply Zones (Resistance Areas)
6,813 – 6,834 region
Clear previous consolidation before a breakdown.
This area now acts as a major supply / resistance zone.
Expect sellers to step in if price retests this zone — first test may trigger rejection.
It’s aligned with a local structure high; several long upper wicks in the past confirm supply pressure.
Above 6,834 → potential next supply
Around 6,850 – 6,860 (top of previous distribution).
Disclaimer:
This content is for informational purposes only and does not constitute financial or investment advice. © DIBAPRISM
Amir D.Kohn

CRUDE OIL (WTI): Strong Selling Imbalance
Look at a large selling imbalance candle that was formed
on an hourly time frame after a test of falling trend line on a daily.
I think that there is a high chance that WTI Crude Oil will
continue falling now.
Goal - 59.6
❤️Please, support my work with like, thank you!❤️
I am part of Trade Nation's Influencer program and receive a monthly fee for using their TradingView charts in my analysis.

BTC AnalysisAfter breaking out its uptrend line, Bitcoin is completing the pullback to its trend line, while with the formation of an increasing angle pattern in the same direction with the main trend, we are witnessing fatigue in the trend. There is a possibility that the price will drop to the range of 41 to 43 thousand dollars.
