AUDUSD BUYAUD/USD is currently moving down to seek liquidity near the lower boundary of the ascending channel, after rejecting the mid-channel zone.
I’ll be looking for buy opportunities around the 0.6470 area, expecting a potential rebound toward the upper side of the channel.
Technical Outlook:
The pair remains within a well-defined ascending channel, maintaining a short-term bullish market structure.
A liquidity sweep or stop-hunt near 0.6470 could provide an ideal entry zone for a long setup.
A bullish reaction (rejection wick, break of structure, or bullish divergence) from that area would confirm buyers stepping in again.
Fundamental Context:
The Australian dollar is supported by improved risk sentiment and stabilization in commodity prices (especially iron ore and copper).
The U.S. dollar has recently eased as Treasury yields pulled back, which can give AUD/USD room to recover.
Additionally, markets are anticipating that the Reserve Bank of Australia (RBA) will remain relatively firm on policy compared to other central banks, providing further support for the Aussie.
Summary:
Waiting for a possible liquidity grab near 0.6470 to position long, targeting a move back to the upper boundary of the ascending channel.
Bias remains bullish as long as price holds above the lower channel support.
Trend Lines

SPX500 | Futures Steady Near Highs, Key Level 6,877 in FocusSPX500 – MARKET OUTLOOK | Futures Edge Higher as Earnings Season Heats Up 🇺🇸
U.S. stock futures inched higher on the first trading day of the month, as traders focus on a busy week of earnings across major sectors.
🔽 Below 6,877: Bearish momentum toward 6,842 → 6,800 → 6,770.
🔼 Above 6,888: Bullish reversal toward 6,918 → 6,941.
Pivot: 6,877
Support: 6,843 · 6,800 · 6,770
Resistance: 6,918 · 6,941
SPX500 remains bearish while below 6,877, though earnings results could trigger short-term volatility or a potential breakout.

GOLD → Consolidation is narrowing... Price is weakening FX:XAUUSD is trading near $4,000, consolidating after the Fed's statements and awaiting new macro data. The trading range has narrowed to $3,886–4,046, forming a symmetrical triangle (unpredictability)
Fed caution: Powell ruled out guarantees of a rate cut in December, which supported the dollar and limited gold's growth.
US shutdown: Could become the longest in history, causing economic concerns, but is expected to end this week.
Weak data: ISM Manufacturing PMI (48.7) pointed to contraction in the sector, which is holding back the dollar's strengthening.
This week, attention is focused on ADP and ISM Services — assessing the impact on Fed rates.
NFP (if published) — a key benchmark for the labor market.
Accordingly, gold is in wait-and-see mode. Clear signals from the data or the Fed will be needed to break out of the range. The $4000 level remains a psychological equilibrium point.
Resistance levels: 4000, 4030, 4050
Support levels: 3956, 3915, 3900
At the moment, the price is far from the key consolidation boundaries, and the market is uncertain. In this case, we are considering trading within the channel. I expect to see a retest of the flat resistance or the triangle boundary and a rebound.
Best regards, R. Linda!

TRUMP Token Ecosystem Expanding – Real Utility Incoming(+30%)?The Official Trump ( BINANCE:TRUMPUSDT ) token has recently shown strong resilience and even outperformed the broader crypto market — and there are several interconnected reasons behind this momentum :
1. Whale Accumulation and Investor Confidence
Large holders have increased their TRUMP balances from roughly 3.97M to 4.88M tokens. This accumulation suggests renewed confidence and long-term positioning by influential investors, providing a strong base of support.
2. Expansion of the Trump Crypto Ecosystem
The ecosystem around Trump-linked assets is growing:
World Liberty Financial, connected to the Trump family, announced a distribution of 8.4M WLFI tokens to users of its USD1 stablecoin on the Enso blockchain.
This strengthens cross-project connectivity and gives TRUMP indirect exposure to new on-chain activity and liquidity.
3. Strategic Business Moves
The TRUMP token issuer, Fight Fight Fight LLC, is reportedly in talks to acquire the U.S. operations of Republic, a regulated investment and crowdfunding platform.
If completed, this deal could:
Add real utility to TRUMP (e.g., payments, fundraising, platform fees).
Expand adoption beyond speculation.
Reinforce the token’s legitimacy within U.S. financial infrastructure.
Summary
While the broader crypto market has dipped, TRUMP is supported by:
Whale accumulation,
Expanding ecosystem ties,
A potential acquisition bringing real-world utility, and
These factors together explain why the TRUMP token could continue to rise — or at least remain relatively strong — even in a weakening crypto environment.
-------------------------------------------------------
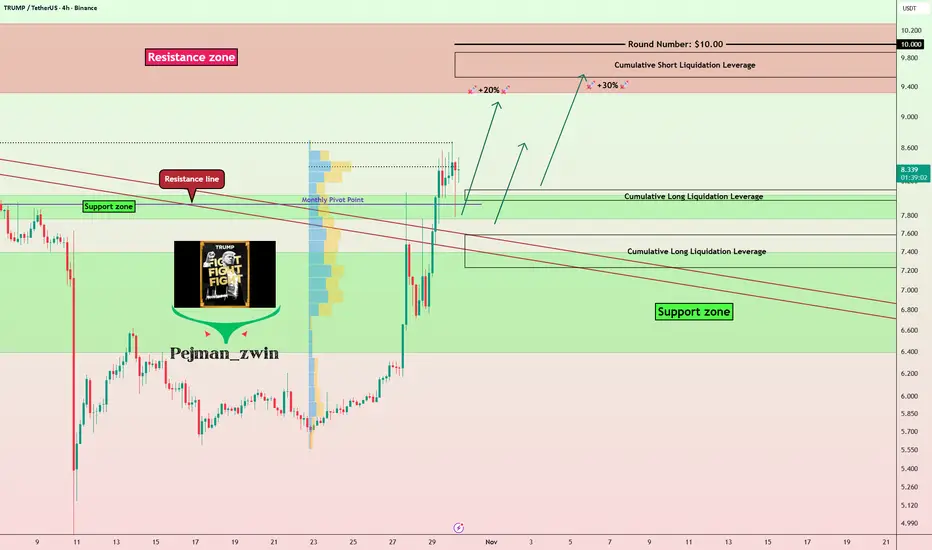
After reviewing the recent news around the TRUMP token , let's take a look at its 4-hour time frame chart.
Currently, the TRUMP token has successfully broken through its Resistance lines with strong momentum and is now moving near a Support zone($8.30-$7.76) and a Cumulative Long Liquidation Leverage($8.10-$7.97) .
I expect that even if the crypto market and Bitcoin ( BINANCE:BTCUSDT ) experience some decline, the TRUMP token might be able to hold its ground thanks to the positive news and the strong momentum it showed when breaking those resistance lines. We could see it potentially rise another +20%/+30% and reach its next Resistance zone($10.30-$9.32) .
Note: A key price level to watch for TRUMP is around $8.70, which has served as both strong support and resistance over the past few months and has been notable in terms of trading volume.
Stop Loss(SL): $7.19(Worst)
Cumulative Long Liquidation Leverage: $7.58-$7.23
Cumulative Short Liquidation Leverage: $9.88-$9.53
Please respect each other's ideas and express them politely if you agree or disagree.
OFFICIAL TRUMP Analyze (TRUMPUSDT), 4-hour time frame.
Be sure to follow the updated ideas.
Do not forget to put a Stop loss for your positions (For every position you want to open).
Please follow your strategy and updates; this is just my Idea, and I will gladly see your ideas in this post.
Please do not forget the ✅' like '✅ button 🙏😊 & Share it with your friends; thanks, and Trade safe.
BTCUSD: A bullish channel might be formedHello Traders!
Considering the next few days, we might see a buy opportunity for the king of the Cryptos!
General long-term is bullish,
Mid-term is bearish,
we are around a zone,
a week bearish trend seen breakable.
We would trade the possible channel after reaching the activation line.
If SL hit before the activation line, we'll cancel the trade .

BTC faces a crash, can it hold the $100000 mark?#BTCUSD BITSTAMP:BTCUSD BINANCE:BTCUSDT BITSTAMP:BTCUSD BINANCE:BTCUSDT
Affected by market news, BTC's hourly chart showed a large bearish candlestick, falling to a low of around 104000. Currently, regardless of the time frame, BTC has reached the lower Bollinger Band area, and all moving averages across different timeframes are trending downwards in tandem, with the MACD indicator showing a bearish crossover and increasing volume. There are no signs of a technical reversal yet, and in the short term, BTC still has room for further downward correction.
If 104000 is breached again, BTC may further decline to 102000-101000, or even the psychological level of 100000. It's only a matter of time, and the bulls will temporarily back down.
Therefore, if BTC rebounds to 105500-106500 in the short term, shorting BTC can be considered.

NZDUSD: Downtrend, Expecting Bullish Retracement.NZDUSD has been on momentum move of lower lows and lower highs. the pair is in descending channel, and have persistently moving with a clear confirmation of support and resistance, in respect to the chart formation.
We can spot that the price is currently at the lower low.
Key points;
A confirmed reversal, would keep the pair in its continuous trend with a target above.
However a plain breakdown below the trendline would set off downward move to 0.5514 as next potential support.
Thanks for reading.

EURUSD downside target: 1.139-1.146On the daily chart, EURUSD is trending downwards, with the bears in control. Currently, the price is trading below the downtrend line. Intraday, watch for resistance around 1.1540; a rebound encountering resistance could present a shorting opportunity, with support levels at the 1.139-1.146 area.

NZDJPY-1H Short Setup/RiskyChartLiquidity Taken: The 4-Day LQ above 88.80 got swept — institutions likely filled sell orders there.
CHoCH: Price flipped structure below 88.30 confirming intraday bearish intent.
BOS: Previous 1H BOS supports downside continuation.
Targets:
PMH → PWH → PDL liquidity zones aligned near 87.60 and 87.40
Expect price to rebalance the inefficiency (gray zone) before continuation.
Invalidation: A sustained break above 88.90 (4D LQ area) invalidates bearish bias.

EURCHF Break out.Another possible break out. Wait to break the zone retest/reject it and then entry. Good luck to everyone.

EURUSD Break out.Another possible break out. Wait break the zone retest/reject it and then entry it. Good luck to everyone.

HUNTING USD THIS WEEKOn NZDUSD we can see a possible break out or the price will continue rise. Wait to see how the price will react on the zones. Goodluck to everyone

Bear Market or Healthy Flush? What MOST People Are MissingEvery time Bitcoin dips, the same old debate comes up: is this the start of a bear market or just a healthy correction?
Here's a scenario that MAY play out, and is one that MOST retail traders aren’t watching.
This isn’t a prediction, but a rather a keen observation. Right now, the charts are giving mixed signals, and that’s exactly why it deserves a closer look.
🔹 What’s Really Happening
After three pushes into the highs, Bitcoin’s daily chart is showing a clear bearish RSI divergence. That usually hints at fading momentum.
At the same time, price fell below the 50 EMA band (1 standard deviation) and got rejected right at the EMA line.
This setup looks almost identical to what happened in May, and back then it led to a solid mid-teens pullback before the trend recovered.
So far, this move from $115K down to the $96K–$98K zone is roughly a 15–17% correction. That’s painful, but still normal inside a bullish cycle.
To call it a bear market, BTC would need to break below that 2024 trendline and print lower lows. That has not happened.
🧭 Why It Matters
This is where traders often get it wrong.
Corrections like this are meant to reset sentiment, clear leverage, and test conviction.
They are not always trend reversals. Sometimes, they are the fuel for the next move up.
If BTC reaches that 2024 trendline with RSI oversold and a bullish divergence forming, that could mark the next major long setup to watch.
📊 Key Zones
Resistance: 50 EMA band (~$115K)
Support: $96K–$98K
Trigger to watch: RSI divergence + trendline retest
Until Bitcoin reclaims the 50 EMA zone, the near-term bias stays cautious.
But this still looks like a healthy flush, not a bear turn.
🪽 Stay sharp, trade smart, and let the charts guide you, not your emotions.

Can gold prices go long amid a narrow stalemate?#XAUUSD TVC:GOLD OANDA:XAUUSD
Gold prices continued to fluctuate narrowly throughout the evening⚖️, with the hourly and 2-hour moving averages converging in the 4010-4005 range, as both bulls and bears awaited a clear directional decision from the market.📊
However, from a technical perspective, gold prices have failed to break below the 4-hour moving average support at 3995 and the daily MA5 at 3985📈. These are crucial short-term support levels🚀, and the fact that gold prices haven't broken them confirms strong buying support below💪. This suggests that any short-term decline should be viewed as a technical correction rather than a market reversal.🤔
Therefore, although the short-term direction is not yet clear, considering the support formed by the 4-hour moving average and the daily MA5, I remain bullish and await a breakout from the consolidation pattern in gold prices🐂.
There may not be much clear information tonight, so let's take a look at the performance of gold prices in the Asian session👀. In summary, the current trend is still in an upward channel. As long as the 3995-3985 level holds, I will maintain a bullish view. On the upside, pay attention to the short-term resistance at 4020-4030🤩.

$USDT.D Cycle Top Indicator HIT !A THIRD CYCLE TOP INDICATOR HAS FLASHED ⚠️
YES this chart is complete chicken scratch, and my mad scientist approach to viewing different trends in USDT Dominance.
I’ve had this November 3rd intersection mapped out for years now.
NO, I do not believe we are anywhere close to the top (see pinned tweet).
Bulls REALLY need to step up big this week with a rally.
We cannot afford two consecutive weeks above 5.5%

$SHOP: A 4-Year Pattern Breakout Before EarningsWith the AI bubble looking frothy, investors are hunting for the next big rotation. The consumer holiday play looks like the perfect switch, and all eyes are on $SHOP.
This is looking like a clean breakout from a massive 4-year rounding bottom—a pattern this big is a major deal.
The setup couldn't be more critical:
• Catalyst: Earnings are tomorrow (Nov 4) pre-market.
• Sector: AMZN just hit a record high. The e-commerce holiday season is the clear narrative right now.
• History: SHOP has a strong track record of beating revenue estimates for the last two years.
• Momentum: The stock is already up over 60% YTD and the RSI is high, showing strong buying interest.
• High Beta: The stock's beta is over 3.5. This thing is built to move on a catalyst.
You have a long-term technical break, a major sector rotation, and a huge earnings catalyst all hitting at the same time. This is a powerful combination. Watching this one very, very closely today.

Bearish Setup – Rejection from Supply ZonePrice recently swept the previous liquidity near the recent low, confirming that internal liquidity has been collected. Now, the market is showing a potential move back toward the rejection area / order block (OB) above.
Here’s the plan:
Waiting for price to retrace into the rejection area (OB) around 4,038–4,040.
Once we see bearish confirmation on the 1-minute timeframe, we’ll look to enter short.
This zone represents a strong supply area where price previously showed rejection.
After liquidity sweep and retracement, expecting a continuation to the downside targeting new lows.
Key Notes:
Liquidity below recent lows has already been taken.
The current push upward is likely a retracement before a deeper drop.
Watch for bearish price action (engulfing, BOS, or rejection wick) before entering.
Bias: Bearish
Confirmation: 1M timeframe rejection
Targets: New structure low

PHARMA Stock @ ATH_LAURSLAbHi traders,
Currently Pharma stock closed higher with Bullish breakout with Bullflag Pattern.
Go long until it breaks previous Monthly Candle Low or Market structure.
Better time entries @ daily timeframe with Technical support and find opportunities in F&O.

My favorite long term buys... Alignment at its' finestHappens to be a day where my 4 largest holdings aligned within HTF zones that I've been awaiting for for some time now.
When I first made videos about PACS, KULR I could not imagine they'd actually come to my intended levels - both almost 50% away from where I initiated coverage.
Here we are...
Happy Trading :)

Above 4000, continue to be bullish on gold.#XAUUSD OANDA:XAUUSD TVC:GOLD
Gold prices fell after opening lower in Asian trading today, but rebounded after touching the key support zone of 3960-3950 and then entered a narrow range of fluctuation. Judging from the current trend, gold is still in an upward channel, and the price is still stabilizing above the daily MA5. Therefore, as long as it does not break below the daily MA5 of 3985, we can continue to maintain a bullish view.
Observing the 1H and 4H charts, we can see that the moving average support is basically maintained in the 4010-4000 range. If the gold price retraces to this range in the short term, we can consider going long on gold. Meanwhile, the first resistance level to watch is 4035-4045, which is both the rebound high point that gold prices repeatedly tested last Friday and the location of the daily MA10 moving average. Only by breaking through and stabilizing above this level will gold prices further test the upper resistance of 4050, or even higher.

GBP/JPY Bullish Breakout SetupGBP/JPY is forming a bullish structure above the trend line after a break of structure (BoS). Price is consolidating and showing potential for an upward move toward the marked target zones near 203.00.

BTCUSD | Consolidating Below $110K Amid Bearish Pressure ₿BTCUSD – MARKET OVERVIEW | Consolidating Below $110K Amid Bearish Pressure ₿
Bitcoin continues to show a bearish momentum, having stabilized below $110.36K, which supports the outlook for a potential move lower toward $106.20K.
For now, the price is expected to consolidate between $110.30K and $106.20K until a breakout occurs.
A confirmed 4H candle close below $106.20K would signal further bearish continuation toward $102.64K.
However, if Bitcoin closes a 4H candle above $110.37K, the structure would shift to bullish, targeting $113.80K initially.
📊 Key Technical Levels
Pivot Line: $110.36K
Support: $106.21K · $102.64K · $98.95K
Resistance: $113.80K · $116.47K · $120.60K
💡 Outlook:
BTCUSD remains bearish while below $110.36K, with potential downside toward $106.20K.
A confirmed 4H close below $106.20K would extend the correction to $102.64K,
while a 4H close above $110.37K would shift the bias to bullish toward $113.80K and beyond.

GOLD | Daily Analysis #3 - 3 November 2025Hello and Welcome Back to DP,
Reviews and News Coverage:
Last week chart represented major moves and volatility. In this Week we should expect following economic calendar events :
- Monday, Nov 3: ISM Manufacturing PMI
- Wednesday, Nov 5: ADP Non-Farm Employment Change AND ISM Services PMI
- Friday, Nov 7 (Tentative): Unemployment Rate & Average Hourly Earnings
Political Angle:
The ongoing U.S. government shutdown negotiations and fiscal uncertainty may increase safe-haven demand for gold. Any escalation or delay in funding could trigger a risk-off tone and push XAU/USD higher.
1H Technical Analysis:
Gold has broken its major downtrend line, signaling a potential shift from bearish to bullish bias on the intraday time frame. The price is currently trading around $4,016, consolidating just below a short-term resistance zone.
Immediate Resistance: $4,024, So a breakout here could open the door toward $4,046, then $4,083.
The next stop if pass 4024, aligns with markup.
Immediate Support: $3,998 → $3,970 zone.
If this support breaks, the next downside target is $3,947 – $3,915 region.
Momentum remains cautiously bullish after breaking the descending trendline.
The structure of higher lows indicates accumulation, but the $4,024–$4,046 resistance area must be cleared with strong candle closes to confirm continuation.
If gold rejects from $4,024 again, expect a retest of the trendline support near $3,970–$3,950.
Trading Plan Ideas:
Bullish bias above $4,024 → potential upside toward $4,046 → $4,083.
Bearish correction if price breaks below $3,998 → next supports $3,970 → $3,947 → $3,915.
Watch for volume confirmation at $4,024 or $3,970 before entry.
Disclaimer:
This content is for informational purposes only and does not constitute financial or investment advice. © DIBAPRISM
Amir D.Kohn
