S&P 500 Surges to Pivotal Resistance- Decision time for BullsThe S&P 500 has rallied nearly 3% off the monthly low and is approaching the first major test of the late-October downtrend. Resistance is eyed at 50% retracement of the decline at 6715 and is backed closely by the 61.8% retracement at 6764. A breach / daily close above the August trendline is needed to suggest a more significant low is in place with subsequent objectives eyed at the monthly open at 6842. Key resistance remains unchanged at 6911/986.
Support rests with the October low at 6500 and losses below this threshold would threaten resumption of the near-term downtrend with the next major technical consideration seen at 6408/21- a region defined by the 1.618% extension of the October decline and the 23.6% retracement of he yearly range. Look for a larger reaction there IF reached.
Bottom line: The S&P 500 is approaching downtrend resistance early in the week and the outlook remains tilted to the downside while within this formation. Look for a reaction into 6715 for guidance in the days ahead. From a trading standpoint, losses would need to be limited to the monthly low-day close / weekly open at 6574 IF price is heading for a breakout here with a breach above 6764 needed to fuel the next leg.
Trend Lines

Worthy Stocks Above 100M TTM RevenueTo follow up from my previous post, here's a more comprehensive list of stocks worth your attention with at least 100M revenue in the last year.
These stocks are picked for being money printers that are rewarded for R&D and buybacks.
I hope this is helpful and good luck!

USD/JPY Breakout Threatens Exhaustion Near 2025 Yearly OpenThe USD/JPY rally failed at confluent resistance last week at the 2025 high-day close (HDC) around 157.70 before pulling back. Initial support rests with the 2024 November high-close at 156.27 and is backed by the lower parallel, currently near ~155.60s. Initial resistance is eyed with the 2025 yearly open at 157.19 with a breach / close above of the monthly high needed to mark uptrend resumption towards the yearly highs at 158.88.
Bottom line: The trade remains constructive while within this formation. From a trading standpoint, losses would need to be limited to the lower parallel IF price is heading higher on this stretch with a close above 157.70 needed to fuel the next leg of the advance.
-MB

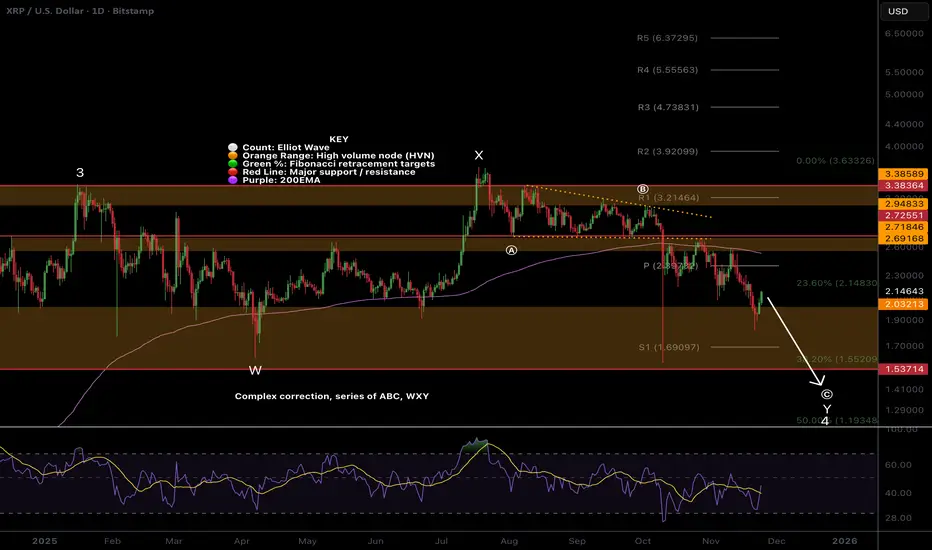
XRP count changed, wave 4 underwayPrice appears to have completed a WXY after the Oct 10th flash crash, but further downside is possible to complete wave 4.
Wave (B) completed a barrier triangle, which suggests the thrust down was the final move before reversal. Price has revisited the wick- expected price behaviour, and we are now looking for a bottom.
Price is below the daily 200EMA and pivot, which is bearish.
📈 Daily RSI reached oversold with no divergences
👉 Continued downside brings up the $1.75 High Volume Node EQ
Safe trading
SUI Dropped hard! More to come?Price accelerated in a downtrend, falling below a major High Volume Node support, invalidating the macro triangle.
Wave C of a textbook ABC correction is underway with a target of the golden pocket. and S2 pivot at $1.
📈 Daily RSI is oversold with no divergence
👉 Continued downside has a next target of $1
Safe trading

SOL looks weak, lower in wave C?Price continues lower, a textbook ABC correction so far.
Wave B ended shy of all-time high. Price lost the daily 200EMA and is testing the major High Volume Node support. The probability is a continuation to the downside.
📈 Daily RSI reached oversold with no divergence
👉 Continued downside brings up the $112 target
Safe trading

HBAR still in the channel!Price is back in the descending range after dropping below during the flash crash, which can be viewed as an anomaly.
Wave 2 appears complete at the golden pocket Fibonacci retracement. Price was rejected at the daily 200EMA and channel upper boundary and has lost the daily pivot and High Volume Node, suggesting further downside is to come.
📈 Daily RSI bounced from oversold alongside price with no divergence.
👉 Continued downside has a target of $0.07 at the next High Volume Node support and alt-coin golden pocket 0.786
Safe trading

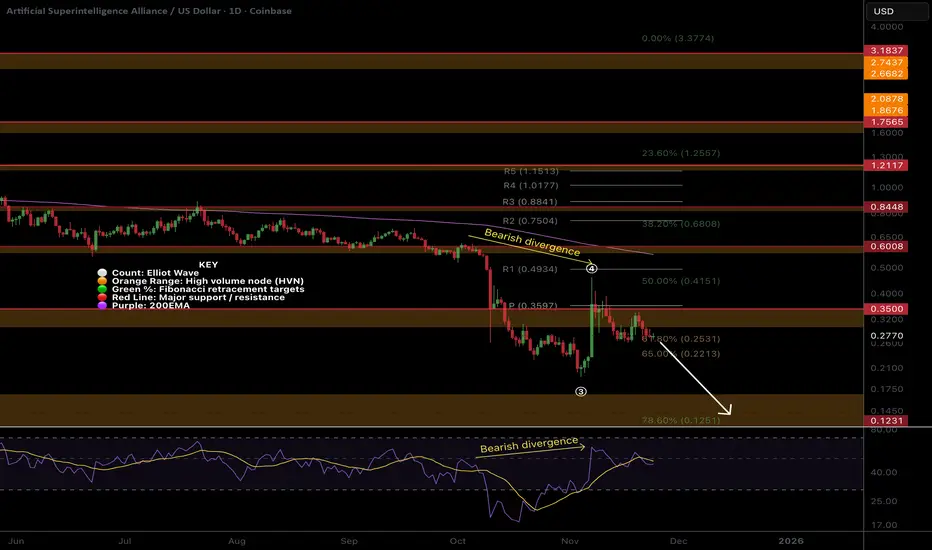
FET looks weak, more downsidePrice bounced with a one-day candle of 70% for wave (4), immediately being rejected on daily bearish divergence.
Chasing candles higher is what’s on the cards of naive investors now. Greed and FOMO immediately took over socials with much gloating, and price humbled them. This is a recipe for lower. Price has lost the High Volume Node, pivot and is well below the 200 EMA.
📈 Daily RSI went too high, too fast, and now has bearish divergence in a bear market, a strong signal.
👉 The next downside target is $0.13
Safe trading
ETH downside target hit, bottom soon?Wave 2 is taking the form of a complex WXYXZ correction broadening wedge. Ugly, hard to trade or find any entries. This will cause a lot of stress. This is also potentially a wave 4, but my preferred count is 2 for now.
Wave 2 appears complete with a swing below the boundary at the High Volume Node. Price is below the saily 200EMA. The trend is down, so we should expect more down. Wave X printed a triangle, hinting at this move down being the final move before reversal.
📈 Daily RSI has reached oversold with unconfirmed bullish divergences.
👉 Continued downside has a target of the High Volume Node $2080, where I will be adding.
Safe trading

Doge, bullish divergence on daily.Price was rejected at the daily pivot per the last report’s analysis. The downtrend is intact.
Wave (2) appears complete after the Oct 10th flash crash, just above the ‘alt-coin’ golden pocket, 0.786 Fibonacci retracement. The trend remains down, so further downside is the higher probability. Price needs to overcome the heavy resistance ahead before we can talk about being bullish long-term.
📈 Daily RSI has printed bullish divergence
👉 Continued downside has a target of the 0.618 Fibonacci retracement and High Volume Node $0.12
Safe trading

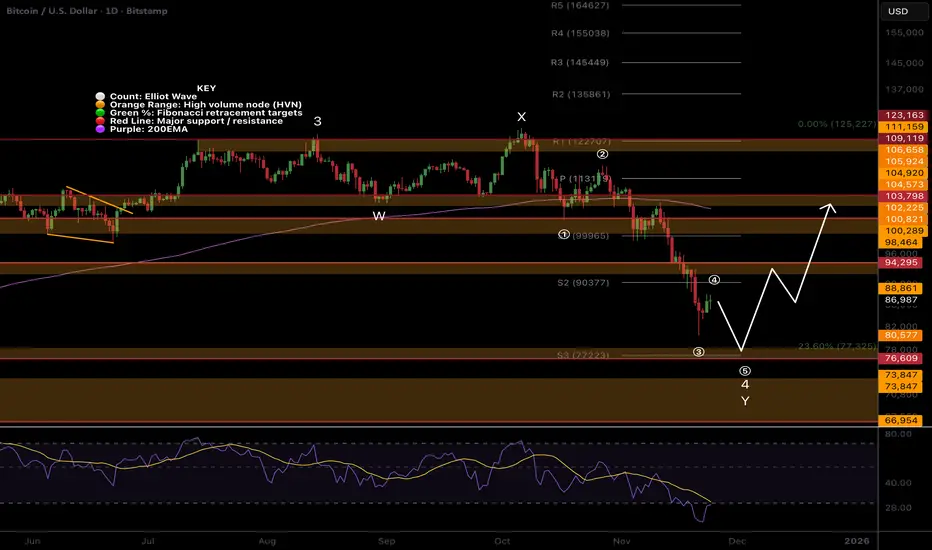
Bitcoin, one more push lower then all time highPrice dropped hard in wave Y of a flat correction, which is expected. Sentiment is at an all-time low for the longest time on record.
This complex correction looks almost complete at the S3 daily pivot, where I bought, but I am giving it room for one more push lower to complete 5 waves down for Y.
Price is well below the daily 200EMA, which will offer some resistance on the way back up. For now, the trend is down, so further downside is the higher probability.
📈 Daily RSI has reached oversold with no divergences. This is where all other ranges bottomed, and the price went on to make new highs.
👉 Continued downside brings up the next High Volume Node at $76000
Safe trading
BNB, downtrend in tact.The downtrend is intact. Price completed macro wave (3) at the R1 pivot, retraced and lost the daily 200EMA, 0.236 Fibonacci retracement and S1 pivot, but the downtrend looks exhausted.
Wave 4 appears complete with a textbook ABC correction ending at strong support and the channel bottom. The downtrend is intact, so the probability is still to the downside until the structure flips or price recovers the daily 200EMA.
📈 Daily RSI has reached oversold with no divergences
👉 Continued downside has a target of the High Volume Node at $730
Safe trading

AAVE Local, bottoming soon?Locally, price continues bearish after falling out of the wedge, completing wave (B) of the macro triangle. Price action looks ready to reverse
Wave © appears complete after the big drop, black swan event- Oct 10th. I was looking for a dip back into the long lower wick, which we have and price is finding support. This suggests we grind higher from here, but we must get through the daily 200EMA, just above the High Volume Node resistance and daily pivot. This area will be tough to crack and was rejected on the first attempt.
📈 Daily RSI has printed bullish divergence from the oversold threshold- a bottoming signal.
👉 Continued downside has a next target of $114.
Safe trading

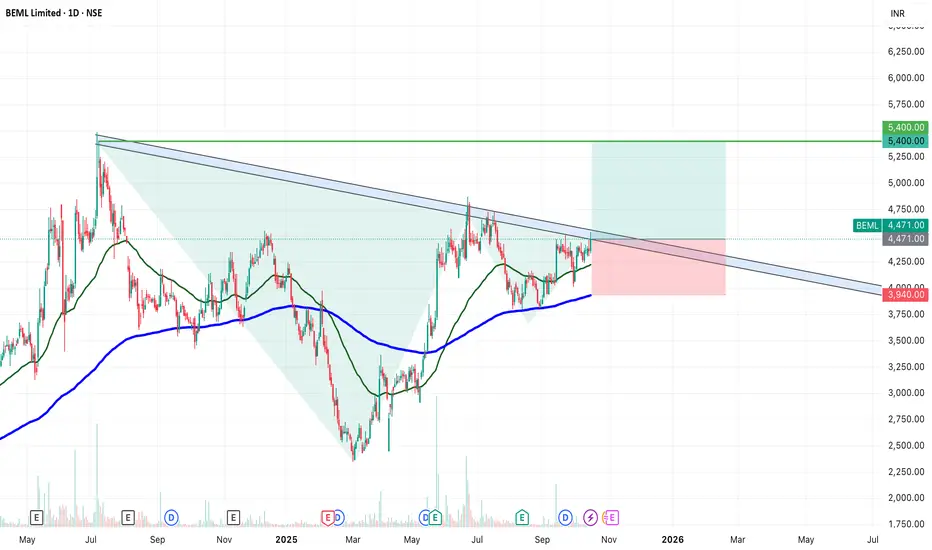
SWING IDEA - BEMLBEML Ltd , a key player in India’s defence and heavy equipment sector, is displaying a strong bullish breakout setup supported by multiple technical confirmations.
Reasons are listed below :
Breakout of a long-term trendline after multiple retests
Cup and Handle breakout, signaling continuation strength
VCP (Volatility Contraction Pattern) breakout indicating accumulation
Bullish engulfing candle on the daily timeframe confirming momentum
Higher highs and higher lows structure intact
Trading above 50 & 200 EMA, reinforcing trend strength
Target - 5400
Stoploss - daily close below 3940
DISCLAIMER -
Decisions to buy, sell, hold or trade in securities, commodities and other investments involve risk and are best made based on the advice of qualified financial professionals. Any trading in securities or other investments involves a risk of substantial losses. The practice of "Day Trading" involves particularly high risks and can cause you to lose substantial sums of money. Before undertaking any trading program, you should consult a qualified financial professional. Please consider carefully whether such trading is suitable for you in light of your financial condition and ability to bear financial risks. Under no circumstances shall we be liable for any loss or damage you or anyone else incurs as a result of any trading or investment activity that you or anyone else engages in based on any information or material you receive through TradingView or our services.
@visionary.growth.insights
ETHUSDT Last support zones now are touching As previously outlined in our technical analysis, the price zone between $2,400 and $2,500 represents the final major support level for the current market structure. A decisive breakdown below this critical support confluence would signal a transition into a confirmed bear market, potentially triggering an additional decline of 40% or more.
Conversely, a strong defensive reaction at this level—preferably with bullish reversal patterns and increasing volume—could initiate a sustained recovery. The key confirmation for a bullish scenario would be a reclaim of the $4,000 level, which would indicate a restoration of underlying demand and potentially mark the resumption of the primary uptrend.
DISCLAIMER: ((trade based on your own decision))
<<press like👍 if you enjoy💚

DOGEUSDT is near weekly support and can pump +200% nowThe market has undergone a severe correctional phase, with declines exceeding 70% from previous highs—a movement that technically qualifies as a bear market cycle rather than a simple pullback. At these oversold levels, we may anticipate a potential technical rebound or relief rally. However, such upward movements should initially be viewed as corrective within the larger bearish structure unless key resistance levels are reclaimed with strong volume and sustained momentum.
Traders should monitor for signs of market stabilization and potential reversal patterns forming on higher timeframes, while remaining cautious of false breakouts or bear market rallies—often referred to as 'dead cat bounces'—that may temporarily lift prices before the primary downtrend resumes.
DISCLAIMER: ((trade based on your own decision))
<<press like👍 if you enjoy💚

PEPEUSDT is near major weekly support also trendline retest herePEPEUSDT appears to be concluding its bearish phase, with price action having breached a significant daily support level. The asset is now undergoing a critical retest of the broken trendline a common technical phenomenon where former Resistance(Red trendline) transforms into support . A successful rejection from this level could catalyze a robust bullish reversal. Based on the magnitude of the preceding decline and the strength of this support zone, we project a potential upward movement with an estimated appreciation target of 200% upon confirmed breakout confirmation.
DISCLAIMER: ((trade based on your own decision))
<<press like👍 if you enjoy💚

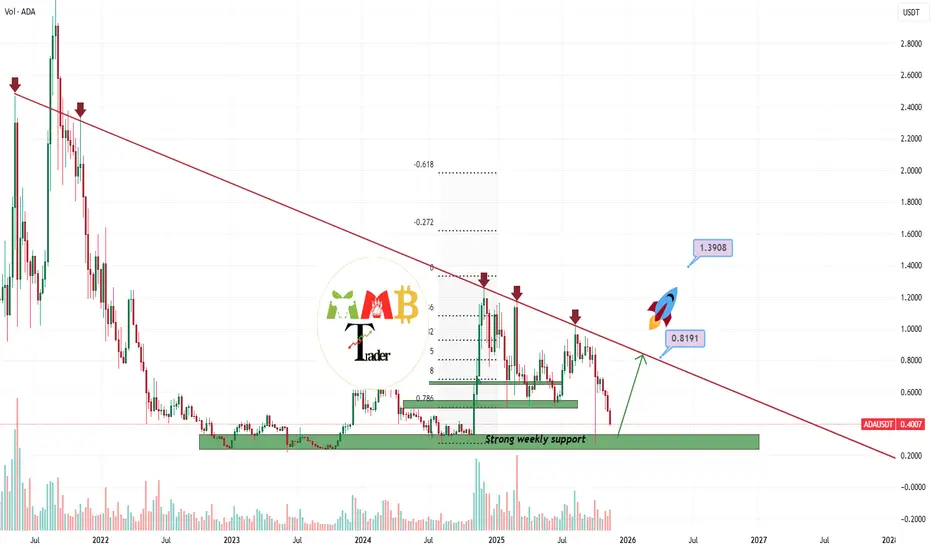
ADAUSDT first target to hit is now +100% (0.80$)ADAUSDT is currently trading within a bearish market structure, experiencing significant downward pressure. However, it's crucial to note that the asset is approaching a major weekly support level. From a technical perspective, the current price zone around $0.40 could present a potential accumulation opportunity with favorable risk-reward characteristics.
The primary scenario envisions a technical rebound toward the $0.80 level, which coincides with a key descending trendline resistance. A decisive breakout above this resistance zone with confirmed volume would be necessary to validate any sustained bullish reversal and potentially initiate further upward momentum.
DISCLAIMER: ((trade based on your own decision))
<<press like👍 if you enjoy💚
CRYPTO market see that bottom go for long The total cryptocurrency market capitalization is now testing a critical technical confluence, positioned at both a multi-week channel support and a significant historical demand zone. Following the recent market correction, this level represents a pivotal area where buyer interest has traditionally emerged. Should this support level hold, we anticipate a potential market-wide recovery that would likely catalyze upward momentum across major assets, with Bitcoin expected to lead this bullish reversal. The current price action suggests this zone may serve as the foundation for the next sustainable advance.
DISCLAIMER: ((trade based on your own decision))
<<press like👍 if you enjoy💚

Bitcoin Daily Short - Monday (11/24/2025)Bitcoin Daily Short - Monday (11/24/2025)
Resistance / break trend line
Lev: 55x
TP: 85340
EN: 86405
SL: 87367
R/R = 1

AUDJPY: +400 Pips Possible Buying Opportunity! Dear Traders,
AUDJPY is likely to continue the bullish price momentum up until 104, currently price has reversed from a critical point. You may consider buying at this moment with a proper risk management. Please use strict management while trading and use this analysis for educational purposes only.
Please like and comment for more!
Team Setupsfx_❤️🏆

Seize the opportunity to short sell at high levels.Technically, gold closed last week in a range-bound manner, and short positions once again yielded good profits. Shorting in the 4080-4100 range, focusing on selling at higher levels, offered considerable profit potential. Given the overall bearish structure on the 4-hour chart, the strategy of buying low and selling high within the lower range, relying on strong resistance and support (primarily shorting), was also favorable for those who went long. However, given the overall bearish trend, going long against the trend is generally cautious and should be avoided, especially chasing rallies in the middle. There's not much to say technically; the overall strategy remains to patiently sell on rallies. Intraday, if there's another rebound, shorting in batches within the 4080-4100 range can be considered.

MGC LongsPrice is forming a rounded double-bottom structure right on the rising trendline (blue), suggesting buyers are quietly stepping back in after multiple rejections from the lower demand zone (4,050–4,060).
We’re currently pushing into a key mid-range resistance at 4,085–4,095. This level has acted as a heavy decision zone for several sessions, so I’m watching for one of two things:
Primary Bias (Bullish)
A controlled pullback into the 4,060–4,065 demand zone
Buyers hold structure above the trendline and EMAs
Break and hold above 4,090
Then continuation toward 4,110 → 4,130 liquidity pockets
The white projection illustrates the ideal retest-and-continue scenario.
Key Notes
EMAs are beginning to curl up and tighten — early sign of momentum shift
Liquidity sits above 4,105–4,115 from prior wicks
Clean invalidation below the trendline / demand at 4,050
Overall, this is a reversal-structure forming at higher-timeframe support, with a potential push into the next major supply zone if intraday demand continues to hold.
