XAGUSD SILVER📈 Silver (XAGUSD) – Long Setup (4H)
Technical View
Price has broken out of a rectangle consolidation on the 4H chart.
Breakout is supported by bullish momentum candles.
Market structure showing higher highs (HHs) and higher lows
Trading Plan
Entry: On successful breakout retest / bullish confirmation candle.
Targets:
🎯 TP1:
🎯 TP2:
🎯 TP3:
Risk Management Rule
Once TP1 is hit, immediately move SL to entry (break-even).
Partial profits can be booked at TP1; let the rest run toward TP2 and TP3.
Trendpattern

War is a Racket | DFEN | Long at $28.00The war machine keeps turning. Profits will reign. Direxion Aerospace and Defense 3x AMEX:DFEN never fully recovered from pandemic lows, but world peace is (unfortunately) far from reach. The uptrend in the chart has commenced. Personal entry point at $28.00.
Target #1 = $37.00
Target #2 = $50.00
Target #3 = $64.00

EURUSD to return bullish as it gets closer to 1.17000EURUSD is revising the bullish trendline level and is expected to continue its bullish move from there onwards.
DXY also remain bearish despite the heavy correction.
Please watch the video and let me know your thoughts.

GBPUSD1H Short Call
GBPUSD
Support Break (which earlier was stong resistance now was acting as support on confirmation
Short trade Is valid)
Manage your risk and rewards
📊 Key Data Just Released: US UN-Employement Claims
FUNDAMENTALS:
Unemployment Claims: 231K (better than forecast 241K, and much better than 264K prior) → labor market stronger.
Philly Fed Manufacturing: 23.2 (blowout vs 1.7 forecast, -0.3 prior) → economic activity hotter.
👉 This means:
Labor market is not weak, economy looks stronger than expected.
So the 25 bps cut last night will be seen as normal easing, not aggressive.
Aggressive cut scenario is off the table for now, unless Fed signals future cuts.

LTTS: Turnaround Play for 30% Upside Potential⚡ Price Analysis:
1️⃣ Price is starting to form a higher low base formation.
2️⃣ Good strong candle formation is needed for further upside move.
3️⃣ Volume: If accompanied by rising volume, this price move confirms genuine bullish interest and possible institutional participation.
4️⃣ The marked blue zone should act as a demand zone.
✨ Key Observations:
➡️ Retest Opportunity: Retest of the ₹4,500 level can serve as an accumulation zone for bullish continuation trades.
➡️ Trade Expectation: As long as price remains above support with strong candle closes, positive bias maintained. Watch for follow-through volume and avoid chasing if there’s low volume on further breakouts.
⚠️ Disclaimer: This is NOT a buy/sell recommendation and is for educational purposes only. Please do your own due diligence before trading or investing! ⚠️
💬 Share your thoughts and insights below!
🔥 Trade Safe! ✅🚀

Double Bottom Reversal likely for GBPAUDPrice has been moving in a clear downtrend inside a descending channel. After this recent fall, notice how price seems to have formed a double bottom. This particular pattern often shows up after a big decline like so.
The neckline, is a key level to watch now, and price is starting to break above it. A strong breakout candle can confirm this pattern, but the safer play is to wait for price to come back and retest the neckline. If the old resistance now holds as support, that’s the ideal spot to join the move.
The projected target comes from measuring the height of the double bottom and adding it to the neckline. In this case, the upside target points towards the 2.0539. A stop loss can be placed either below the neckline after retest, or more conservatively below the second bottom.
The one-hour double bottom can be reliable too, but its reliability is more dependent on volatility, unexpected events, and overall market conditions. For now, if the neckline holds on a retest, and shows good rejection, there's a high probability price will be pushing higher.

EURUSD📈 EURUSD – Buy / Long Call (30m / 4H)
✨ Price has tested the 4H Trendline and created strong Bullish Momentum.
⏳ In the coming 4 days, EURUSD can reach Resistance / Target Zones.
Buystop Or Buy limt both orders Valid
⚖️ Always manage your Risk vs Reward wisely.
💵 Let the market print some $$$!

(BTCUSD) 4H Chart Analysis – Potential Bullish Continuation4H Bitcoin/USD Chart Analysis
📉 Current Price Action:
Bitcoin is currently trading around $110,956, showing a minor pullback after a recent upward push. Price is hovering just above a critical zone made up of:
⚫ Fair Value Gap (FVG)
🟫 4H Order Block (OB) around $110,413 – $110,001
📊 Technical Outlook:
📍 Retracement Expected:
The chart suggests a potential short-term retracement into the FVG and H4 OB zone. This area is a strong demand zone where buyers may step in. 📥
📈 Bullish Continuation Setup:
If price respects this zone and finds support, we can anticipate a bullish continuation 🚀 targeting the liquidity level around $113,372. This is a logical target as it's likely to attract price action (liquidity grab).
🎯 Key Levels to Watch:
Support Zone: $110,413 – $110,001 (FVG + OB) ✅
Resistance / Target: $112,960 and $113,372 🧲
Invalidation: Break below $110,001 may invalidate this setup ❌
📌 Summary:
Bitcoin looks poised for a bounce from the demand zone before making a move toward the liquidity above. Traders may look for confirmation signals (e.g., bullish candles) in the FVG/OB area for a potential long entry. 📊📈
🧠 Risk management is key—wait for confirmation!

EURCHF Testing Trend LineWe are looking to come back up fill the fvg and then go down
This is ltf trade so please only risk 0.5%
NZDJPY Break and RetestNZDJPY is looking bullish as it broke the consolidation to the upside.
We are waiting for a retest to go long

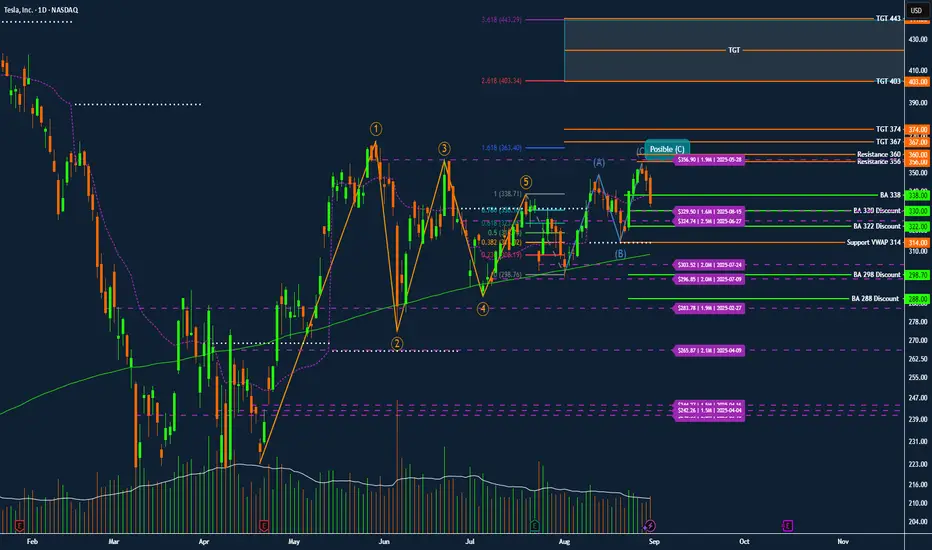
TSLA TESLA Institutional Roadmap for September Discount ZoneTesla NASDAQ:TSLA – Institutional Roadmap for September: Discount Zones, Breakout Triggers, and Squeeze Targets
Tesla continues to trade as one of the clearest institutional battlegrounds in the market. The footprints in option open interest, dark pool levels, and anchored VWAP create a very precise map for swing traders who want to follow the flow rather than fight it.
Elliott Wave Context
Tesla completed a clean 1–5 impulse wave earlier in the year. The stock has since been retracing in an A–B–C corrective structure, with wave (C) still tentative. The rejection near 348–350 matches heavy open interest and serves as a possible end of (C). However, the high-volume sell candle at 333 suggests the correction may continue lower into discount zones before the next advance.
Institutional Discount Zones
330–332: first defense level, with recent dark pool support
322: deeper discount aligned with the 0.618 retracement
314: anchored VWAP level, a frequent institutional reload zone
298–300: July dark pool activity and strong confluence support
288: extreme discount zone from February
Breakout Triggers
BA 338: first bullish-above confirmation trigger, but only valid if defended by volume
356–360: the real battleground. Massive call open interest is stacked here. A clean break above confirms institutional participation
Upside Targets
367–374: first expansion target and resistance magnet
403: Fibonacci 2.618 extension
443: Fibonacci 3.618 extension
467: Fibonacci 4.236 extreme target if momentum continues
Flow and Volume Notes
Options flow shows concentrated put open interest between 300–320, confirming institutional defense of that floor. Call interest is stacked heavily at 350–360, which explains the recent rejection zone. The latest sell-off candle came with above-average volume, reinforcing the probability of a deeper retest into 330–322 or even 314 VWAP.
Trading Roadmap
If Tesla holds 330–332, expect a potential reversal with BA 338 as confirmation.
If 330 breaks, expect a move into 322 or 314, and a flush to 298 remains possible.
If 356–360 is reclaimed with volume, the squeeze path opens toward 367–374.
Breaking above 374 accelerates directly into 403 and later 443.
Conclusion
Tesla remains a classic institutional shakeout pattern rather than a breakdown. The map is clear: watch the discount zones for accumulation, use BA 338 and the 356–360 battleground as confirmation triggers, and follow the roadmap toward 374, 403, and 443 once the breakout validates. Patience is edge. Institutions will reload near VWAP and dark pool levels, while retail chases 350. Follow the Darkpools not the noise.
Bitcoin – Short-Term Outlook at Key LevelsBitcoin – Short-Term Outlook at Key Levels
Hello traders,
BTC is consolidating around the rising trendline on the daily chart, showing a firm rejection at this level. The broader structure remains in line with the scenario I shared previously, but here’s an updated view to refine short-term opportunities.
The channel is still the main focus. Recent sideways price action has formed a key support–resistance zone, which will decide the next short-term move:
113.3k resistance: A breakout here would confirm fresh long positions.
108.8k support: A breakdown would trigger short opportunities.
Should support fail, the medium-term bias shifts to the bearish path outlined earlier, with potential downside towards the 9x region, supported by the larger timeframe structure.
That’s my current outlook for BTC in the short term. Manage risk carefully, and let’s see how price reacts at these critical levels. Share your view in the comments – do you see BTC breaking higher or lower?

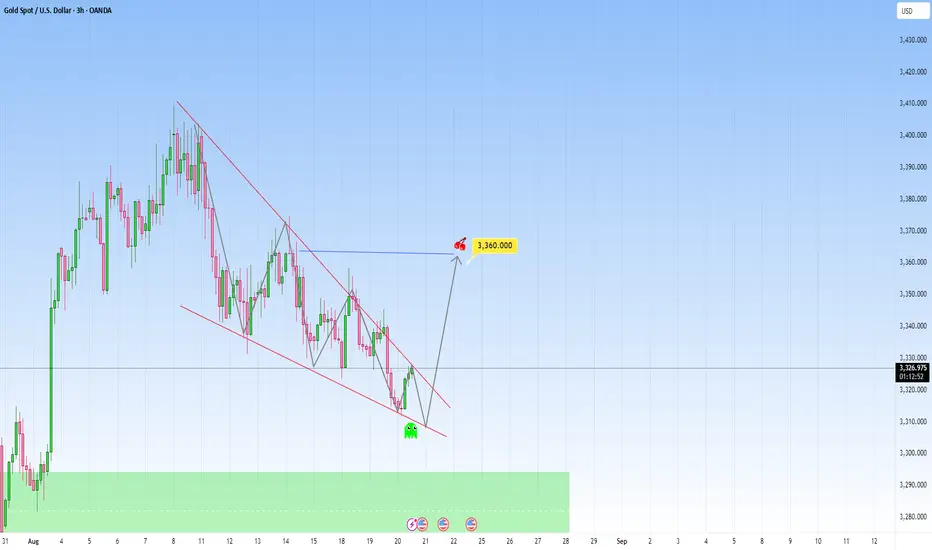
Gold in a falling wedge pattern: Ready for a strong ride upPrice on XAUUSD looks quite interesting right now, this recent has brought a new look to it, as it's forming a more optimistic pattern.
The most recent interaction here is particularly interesting, because it's already showing early signs of recovering and decreased bearish momentum. What may follow: low-volume candles suggesting exhaustion and potential upwards.
My target would be toward 3360. If this move plays out, it will make a beautiful play of a narrative that’s we've been following for Gold.
This setup is so compelling. It’s a story being shown, but still requires patience and confirmation.
Though a scenario for more downside is possible as we have a clear support zone below. Still, I am taking the side for more upside because of the pattern forming here.
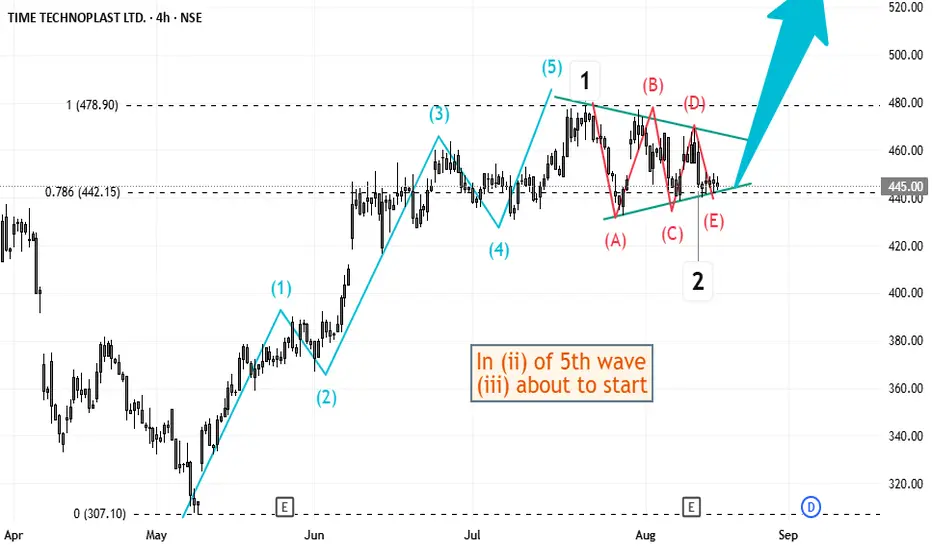
Elliott Wave Analysis of Time Technoplast TIMETECHNOThis script appears to have just completed a triangle retraction after a 5 waves move in 5th wave. This means, a next 5 waves move up might be in play on daily time-frame. But the 2nd wave did not go deep as usual, so one also needs to be cautious of the possibility of a complex retracement forming.
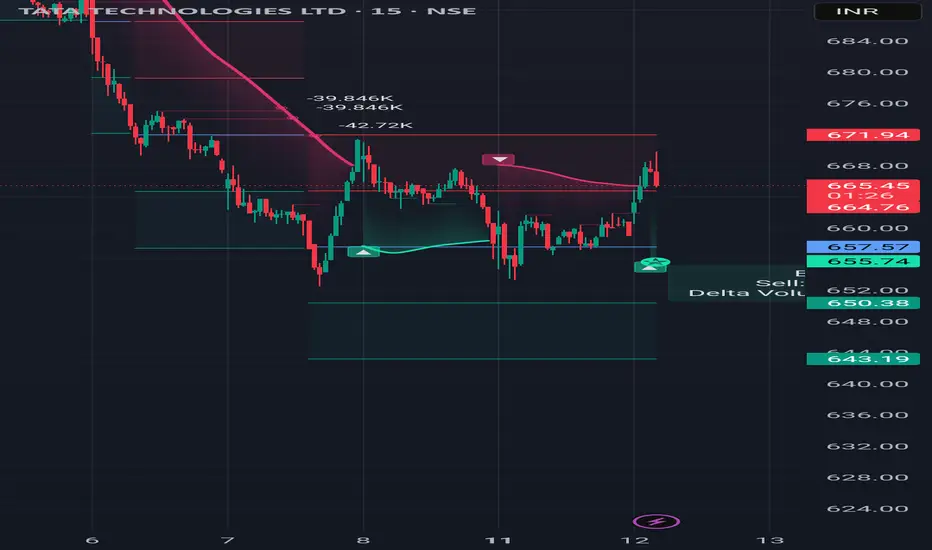
Short term Technical Idea TATATECH📢 PJV FINANCIAL – 1-2 DAYS TECHNICAL CALL 📢
🔷 SCRIPT: TATATECH
🔷 Action: BUY above ₹667.40
🔷 Stop Loss: ₹656 (📉 -1.71%)
🔷 Target: ₹688 (📈 +3.08%)
🔷 Risk–Reward Ratio: 1 : 1.80 ✅
📌 Short-term momentum trade idea – strictly follow SL.
🚀 #PJVSignals | 💼 #TechnicalCall
XAUUSD falls on easing geopolitical tensionsXAUUSD falls on easing geopolitical tensions
Gold fell below 3,380.00 on August 11 as reduced geopolitical tensions weakened its safe-haven appeal, following President Trump’s announcement of an August 15 meeting with Putin in Alaska to discuss ending the Ukraine war, potentially avoiding new U.S. sanctions on Russia. Losses may be capped by ongoing trade concerns, expected Fed rate cuts, and uncertainty over U.S. tariffs on gold bars after a recent agency ruling.
Technically, XAUUSD failed to hold an intermediate 3,380.00 level and develop a bullish momentum towards 3,440.00, which means the start of the sideways market in the asset. Next possible target is 3,000.00 level.

XAU/USD Buy Setup 1H Analysis Trendline breakout.Instrument: Gold Spot / USD
Timeframe: 1H (1 Hour)
Chart Tools Used:
Ichimoku Cloud
Trendline breakout
Target projection (highlighted in blue arrow and price levels)
Volume not shown directly but momentum is clear from breakout
---
💹 Buy Setup Analysis
✳ Current Price: $3,362.895
🔼 Entry (Buy): Around $3,363.590 (as marked on the chart)
🎯 Targets:
Target Number Price Level Approx Gain % Move
1st Target $3,393.481 ~$30 ~0.89%
2nd Target $3,433.864 ~$70 ~2.06%
🔻 Stop-Loss (Suggested): Below Ichimoku Cloud, ideally near $3,315.860 or $3,322.672
---
🧠 Strategy Logic
The chart shows a clean bullish breakout of the trendline and Ichimoku cloud.
Strong upward momentum candle confirms the breakout.
Targets are based on measured move and previous resistance zones.
Volume and sentiment look bullish, aligning with the breakout.
A pullback to the breakout zone (~$3,340–$3,350) would be healthy for re-entry.
---
📝 Summary of Buy Setup
Parameter Value
Entry $3,363.590
Target 1 $3,393.481
Target 2 $3,433.864
Stop-Loss $3,322.672–$3,315.860 (zone below cloud)
Risk-Reward ~2:1 to 3:1 based on SL/TP choice

USD/JPY 4H –analysis Buy setupUSD/JPY (U.S. Dollar / Japanese Yen)
Timeframe: 4-Hour (4H)
Trend: Bullish Trendline Support – Price is respecting a strong ascending trendline.
Indicators: Ichimoku Cloud is visible; current price is above the cloud = bullish bias.
Current Price: Around 147.95.
---
✅ Buy Entry:
Entry Zone: Between 147.90 – 148.10
(As price is bouncing from the trendline support and Ichimoku cloud.)
🎯 Buy Targets:
1. Target 1: 148.99 (Previous structure resistance)
2. Target 2: 150.50 (Next resistance level)
3. Target 3 (Swing): 152.00+ (If momentum continues)
🛑 Stop Loss:
Below trendline + Ichimoku support = 146.80 (safe zone)
---
🔖 Chart Title Suggestion:
"USD/JPY 4H – Trendline Rebound with Bullish Momentum Targeting 150+"

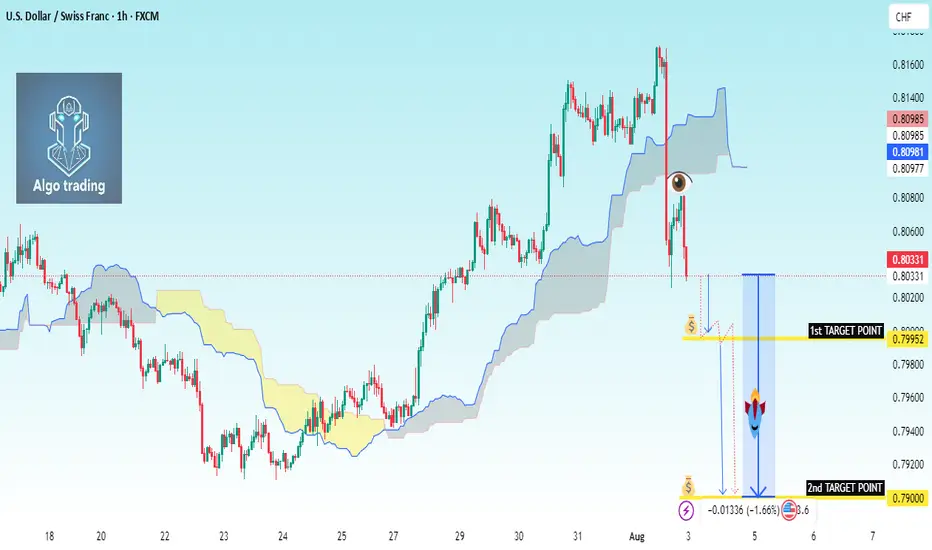
Sell Setup – USD/CHF (1H Timeframe)Chart Summary (1H – USD/CHF)
The pair was bullish, then got sharply rejected near 0.8100.
Price is now inside the Ichimoku Cloud, which means indecision.
Bearish signs:
Price failing to push back above cloud
Chikou Span (lagging line) is heading below candles
Flat Kijun-sen + bearish twist forming in the cloud
---
🔻 Sell Setup (Only Sell Focus)
📍 Sell Entry
Entry price: 0.7990
Reason: Break below Ichimoku cloud base and recent structure support
Confirmation of bearish move starting
🛑 Stop Loss
SL: 0.8055
Above the Kijun-sen and recent minor high
Protects against false breakdowns
🎯 Take Profit
TP1: 0.7950 – First nearby support
TP2: 0.7900 – Strong previous support area
---
📊 Trade Plan Summary
Component Price
Sell Entry 0.7990
Stop Loss 0.8055
Take Profit 1 0.7950
Take Profit 2 0.7900
---
✅ Entry Confirmation Checklist
Before entering the trade, confirm these:
❗ 1H candle closes below 0.7990
📉 Bearish candle shape (strong body, not a doji)
🟡 Chikou Span below price
☁ Cloud is red (future kumo bearish twisd
AUDUSD: Bearish Continuation from broken supportThe current setup is a clean example of a trend continuation play. Price recently broke decisively below a structure zone, this break and retest now flips the narrative, what once was a buy zone is now an opportunity for short entries.
Following the aggressive move down, price now began pulling back into that broken zone. The move appears corrective rather than impulsive, characterized by a slower, more rounded structure typical of pullback leg. This is classic behavior in continuation setups: fast drop, slow retrace, and then potential for the next leg lower.
The projected move targets a retest of the swing low at 0.63800. That level is significant, it's a level where prior demand reacted strongly and now it serves as the next probable magnet for price.
What makes this continuation trade high probability is the sharpness of the prior bearish impulse as it signals intent. The market seems to be in a controlled bearish sequence, where sellers dominate momentum and retracements offer fresh entries for trend followers.
The structure and zone alignment all point in the same direction continuation lower, not reversal.
Let me know in the comments what you think
Disclosure: I am part of Trade Nation's Influencer program and receive a monthly fee for using their TradingView charts in my analysis.

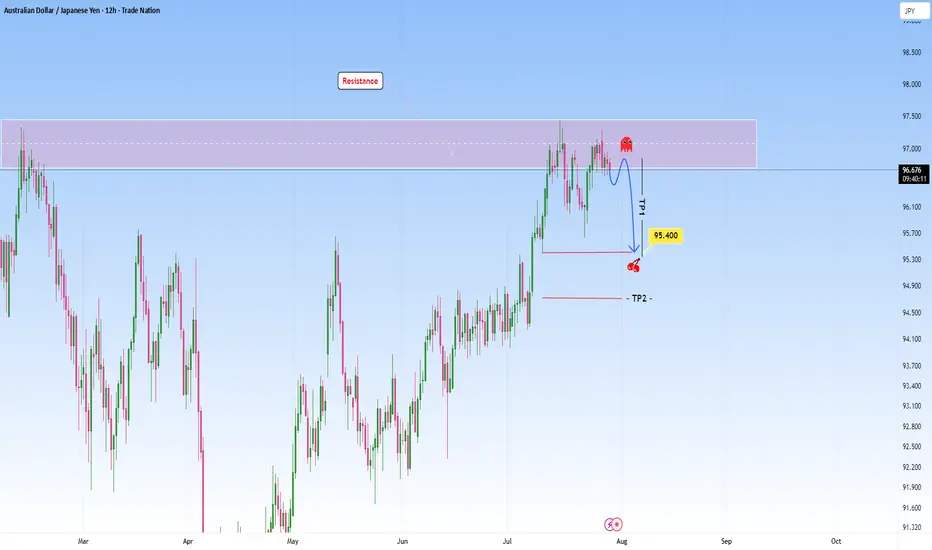
AUDJPY at Resistance: Could we see a reversal here?The market on this pair shows us a classic scenario where price presses into a resistance zone after a sustained bullish move. Price action approaching this zone appears hesitant, with smaller candles and wicks showing signs of exhaustion, meaning the possibility that buying momentum is weakening. There is a clear intention in this structure and I am anticipating a reversal here.
My first target (TP1) at 95.400 is placed just above a previous structure low and it’s a logical level for a partial exit, as price may pause or react there. The second target (TP2), placed even lower, hints at a full mean reversion idea targeting the origin of the previous bullish leg.
The setup requires patience, waiting for confirmation perhaps in the form of a strong bearish rejection before committing to the short. Overall, it’s a disciplined setup that mirrors the kind of analysis I like to gravitate toward: structured, simple and driven by high probability reversal zones.
Disclosure: I am part of Trade Nation's Influencer program and receive a monthly fee for using their TradingView charts in my analysis.
IPH 40% move coming?IPH has recently emerged from a descending wedge pattern, supported by bullish divergences in both the RSI and OBV, along with several divergences observed in shorter time frames. A pullback to the $5 level is anticipated, as the stock appears weaker on these smaller time frames. If IPH can maintain its position above the recent low of $4.40, it will indicate a structural shift, establishing higher highs and higher lows. My initial target is in the $6.50 range, followed by a potential move just above $7, representing a 40% increase. Good luck and happy trading 🍀

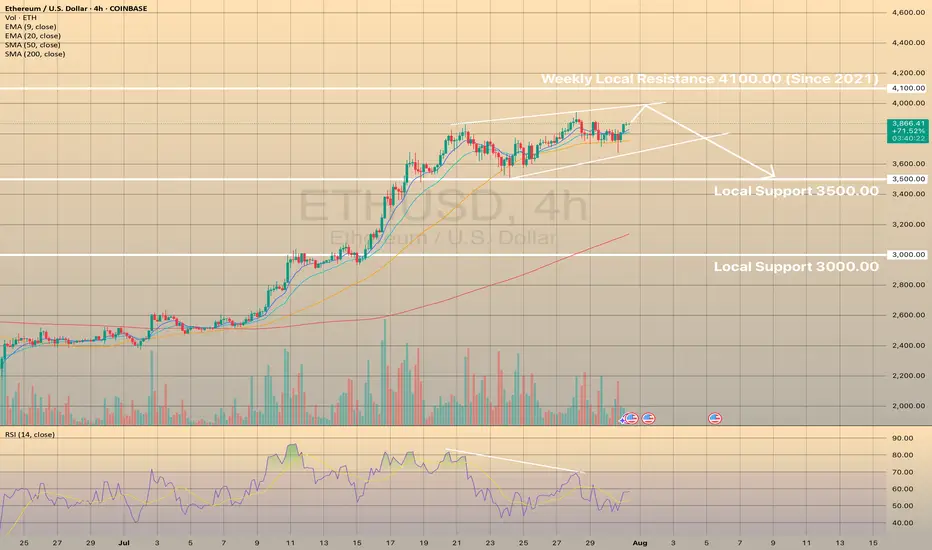
ETHUSD MAY FORM THE BEARISH WEDGE. THE PRICE IS GETTING READY TOETHUSD MAY FORM THE BEARISH WEDGE. THE PRICE IS GETTING READY TO DROP.
ETHUSD has been moving bullish since July 8. However since July 21 the price started to form the bearish wedge with bearish divergence on RSI on 4-h timeframe.
A bearish wedge is a bearish reversal pattern in an uptrend, where the price forms higher highs and higher lows within converging upward trendlines, signaling weakening bullish momentum and a potential downward reversal. To trade, identify the wedge with declining volume and confirm with RSI or divergence. Sell or short on a breakdown below the lower trendline with a volume spike. Set a stop-loss above the recent high or upper trendline. Target the wedge’s height projected downward from the breakdown or the next support level with a 1:2 risk-reward ratio.
We expect that the price will establish another bullish momentum and the price will go towards upper border of the wedge, slightly below the 4,100.00 resistance level and will decline towards 3,500.00 support level afterwards.