Simple Patterns Tutorial Part 1. Ascending TrianglesHey Traders, I am going to do a short free tutorial on Simple Patterns. This tutorial's purpose is to show you:
-How to Identify Ascending Triangles
-How to measure the move to project price targets
-Examples of how you can create a rules based Strategy around Simple Patterns.
- Psychology behind Ascending Triangles
The Ascending Triangle is a Bullish Pattern and should be traded with the trend! There are a couple things that you should consider if you decide to create a strategy based around these Patterns:
1) I have found that these Patterns are not very successful if you are using them for countertrend trades. I'm sure someone out there has a strategy that consists of these patterns to signal a counter trend trade however it personally did not work for me. I found that these Patterns are extremely accurate when you are trading with the trend and couple them with a pullback or specific candle formation after the breakout has occurred.
2) Volume should increase when price breaks out of the Ascending Triangle formation
3) These Patterns will not always be picture perfect therefore we need to look for the characteristics of the Pattern as opposed to perfect lines. The characteristics being, relatively equal highs creating a near horizontal Resistance line, and higher lows creating a rising (Ascending) Support line.
4) These Patterns tend to complete within 3/4 of the way to the APEX. I have found that these Pattern tend to be invalidated if price trades to far into the APEX.
Psychology behind an Ascending Triangle:
The top line of the Ascending Triangle (Resistance) is a price level where the sellers are able to overcome the buyers and push price down. As this pattern continues to form, you will notice that the sellers are unable to push price as low this time and this is where the Ascending Trend line begins to form. As this pattern continues, again the sellers are unable to push price as low as the most previous low and the buyers are beginning to overpower the sellers. The Psychology aspect is that every time the sellers push price down, the buyers are willing to pay a higher price for there shares (this creates the Ascending Triangle). Eventually, the buyers will pay a high enough price to overcome the sellers and break through the upper Ascending Triangle line (Resistance).
I hope this was helpful! I cannot possibly cover every aspect of every pattern so please feel free to message me or comment below with any questions you may have! I will be happy to help! Thanks Traders, make sure you do your due diligence and back test any strategy or pattern that you are attempting to create. You will also need conditions, criteria, and rules for that strategy. This will save you a lot of money and give you confidence in your trades. I have attached a live example of an Ascending Triangle below and I will periodically be posting more examples like that one as an update to this tutorial.
Triangle

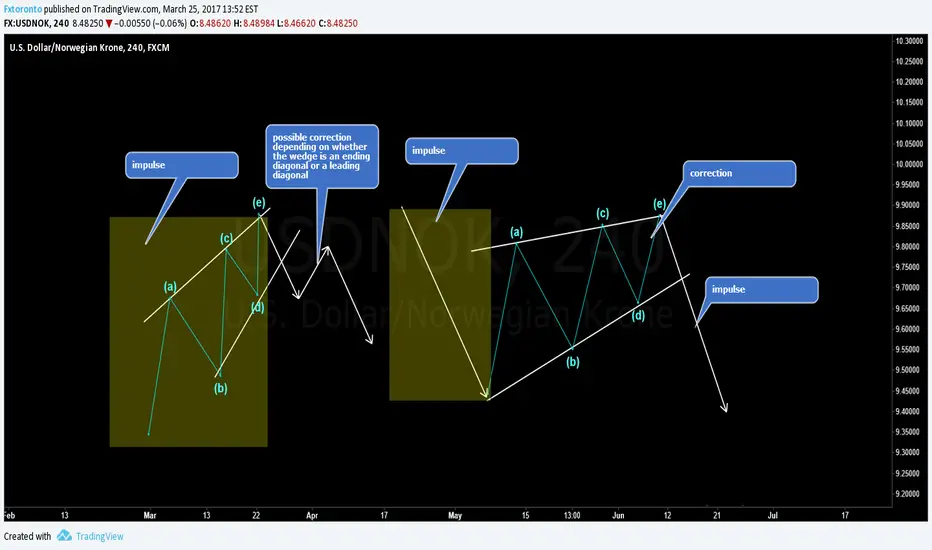
Educational post - Difference between a wedge and a triangle Hey guys this is a very short educational post on two of the most commonly found chart patterns in the market. These are often mistaken and confused even by experienced traders. Here we have a rising wedge and a bearish triangle both are bearish in nature. However one is a reversal pattern and the other is a trend continuation pattern
Example of a wedge
Example of a bearish trianlge
I hope you guys found this beneficial. Next time we shall talk about bullish variations of these two patterns with examples.
Cheers
Educational Post (Different Chart Patterns)Hope this will help you! Give thumbs up & comment if you like it!


How triangle works on bullish channel?Dear friend's
How triangle works on bullish channel?
This is a simple way to find entry point in triangle bullish movement.
inverse, in bearish movement is true.
Hope this lesson help to me and help to you for improve your trading.
Kind regards,
Pooya Salehipour
