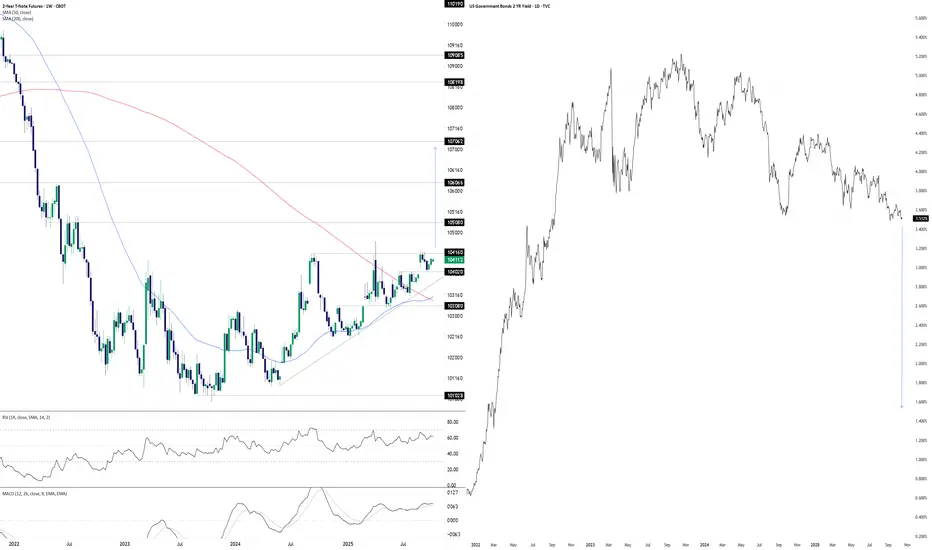
Something’s Brewing at the Front EndDonald Trump wants lower interest rates. He may well get his wish soon, at least at the front of the U.S. Treasury curve. The chart you’re looking at has two panes. On the left, we have U.S. two-year Treasury futures. On the right, we have two-year U.S. Treasury yields. The former uses a weekly tick, the latter daily.
With futures coiling in a well-defined ascending triangle pattern for more than a year, you get the sense that should we see a weekly close above 104’16’0, it may act as a catalyst to spark further upside, potentially explosive. The contract has been rejected at the level six separate times since July 2024, including four failed breakout attempts over the same period. This reinforces its importance. Given its proximity to the level with RSI (14) and MACD generating bullish momentum signals, attempt number seven—if we see it—stands a decent chance of sticking.
If we see a sustained break above 104’16’0, 105’08’0, 106’06’6 and 107’06’2 loom as the levels to watch, especially the latter as it aligns with the extension target based on the triangle’s height. If it were to be achieved, it points to a nominal two-year Treasury yield of around 1.5%.
That’s obviously far lower than where it currently resides, pointing to negative real rates given the Fed’s 2% inflation target and, in all likelihood, economic conditions far weaker than recent years or monetary policy being guided by factors other than fundamentals.
While the setup is tradable, if it plays out, it will have ramifications far beyond rate futures given the economic signal it would provide. When you look at recent moves in hard assets with perceived scarcity value, it appears many investors and traders are already positioning for such an environment.
Good luck,
DS
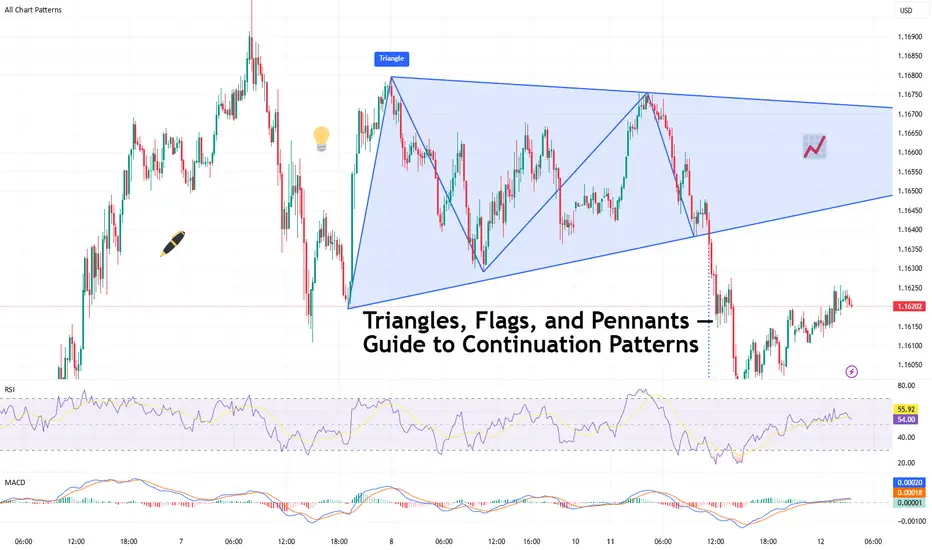
Triangle
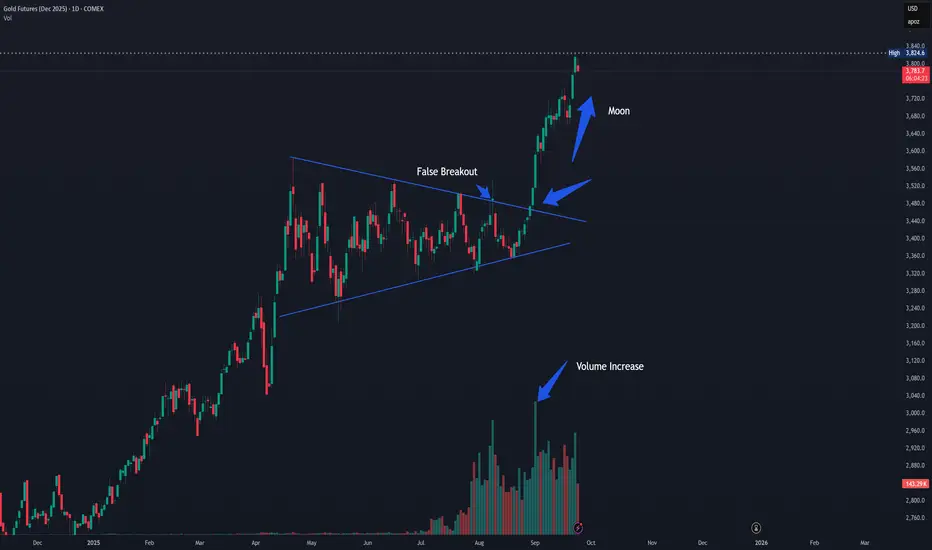
I Should Have Noticed This Pattern (Episode 1)
Just today I zoomed out on my GS chart and noticed for the first time this almost perfect triangle pattern. How did I completely miss this?
-There are many times in my short trading career that I have come across things I should have noticed. Whether it's chart patterns, correlation, volume spikes, or indicators indicating; I kick myself for my neglect!
-Now the least I can do is point out those mistakes and share them with you as I see them, in the hopes that more get noticed in the future.
-This is an example of a symmetrical triangle which is considered the most common type of triangle pattern. Despite the name, the triangle does not have to be symmetrical and like all patterns is evaluated in the approximate. Some imagination is required. Most triangles are a representation of consolidation before continuation, but can sometimes represent a top or bottom before reversal. When price does break out of a triangle, volume should spike and this example clearly shows that. This example also shows a false breakout which would have been discovered when closing for the day back "inside" the pattern. Also like all patterns, the larger the time interval, the more important the pattern. Daily and longer are preferred.
-Again this is what I see after the fact and far too late. I would not enter this trade now. Please let me know if I missed something or if you were able to trade this in real time and there was details that I left out. Also, did anyone make money on noticing this pattern? Am I mistaken in any way?
Triangles, Flags, and Pennants — Guide to Continuation PatternsChart patterns can be mysterious — until they’re not. Let’s break down the technical trio that tells you when a trend’s just taking a breather before it flexes again.
So your chart’s been pumping higher for weeks, and then… nothing. Price starts scribbling sideways. Cue panic? Maybe. But more likely, you’re staring at a continuation pattern.
Triangles, flags, and pennants are the subtle “hold my beer before I try to pull a move” signals of technical analysis. They show up when markets pause — not reverse. That pause could mean your trend is catching its breath, not dying in a ditch.
In other words: don’t close your longs just because things go quiet. Sometimes the market is just stretching before it sprints again.
⚠️ Symmetrical, Ascending, Descending
Let’s talk triangles, the Swiss Army knife of consolidation. These shapes come in three stylish varieties:
● Symmetrical triangle: Higher lows, lower highs. Traders call this the indecision pattern, but don’t get it twisted — it may just be winding up for a breakout. Wanna see how these look in practice? Dive into our community’s symmetrical triangle ideas .
● Ascending triangle: Flat top, rising bottom. Buyers are aggressive, their patience is running out. Resistance looks like it’s begging to be broken. Check the ascending triangle ideas for your viewing consideration.
● Descending triangle: Flat bottom, falling top. This one’s more bearish than your boomer uncle who knows zero about Bitcoin BITSTAMP:BTCUSD , and yes — it’s often a precursor to a breakdown. Follow the descending triangle ideas and make sure you DYOR.
Key tip : Wait for the breakout. Don’t front-run triangles unless you like volatility surprises and emotional damage.
🚩 Flags: Fast Moves, Tight Consolidations
Flags form after a sharp price move — the “flagpole” — followed by a tight, slightly sloping channel that moves against the prevailing trend. They’re short-term patterns that act like pit stops during a race.
● In a bull flag, price rallies sharply, then consolidates lower in a downward-sloping rectangle. If price breaks above the upper boundary, the uptrend is likely to resume. Jump straight into the bullish flag ideas .
● In a bear flag, price crashes, then drifts higher or sideways, forming an upward-sloping consolidation. A breakdown below the lower support hints at a continuation lower. What goes up must go down — bearish flag ideas for thought.
Flags are prized for their reliability and tight risk-to-reward setups. The breakout is typically swift, and traders often use the length of the flagpole as a projected target.
🎏 Meet the Pennant: The Flag’s Cousin
Pennants are like mini-triangles that form after a strong price move, usually in high-volume conditions. Unlike regular triangles, they’re smaller and more compressed — a tight consolidation in the shape of a tiny symmetrical triangle.
What makes a pennant different from a flag? The structure. While flags are rectangular, pennants are more pointed — a converging pattern rather than parallel lines.
Pennants are often seen in high-momentum environments, and when price breaks out of the consolidation zone, it often does so with force. Get some pennant ideas straight from our community.
🧐 How to Actually Trade These Patterns
Spotting a continuation pattern is one thing. Trading it with discipline is another.
Here’s a basic checklist:
● Identify the trend. Continuation patterns only work when there’s a clear preceding move. If the chart is a sideways mess, maybe skip it.
● Draw your levels. Use trendlines or horizontal support/resistance to outline the pattern. Keep it clean — if you’re forcing a pattern, it probably isn’t there.
● Wait for the breakout. Don’t jump in too early. Let the price confirm your bias. Breakouts are more credible with a volume spike.
● Set your stop wisely. Most traders place stops just outside the opposite side of the pattern — below the lower trendline in an uptrend, or above the upper trendline in a downtrend.
● Target projection. Many use the height of the pattern or the flagpole to estimate a target price, though market conditions should influence your approach.
🤔 So, What Could Go Wrong?
Glad you asked. Plenty.
● Fakeouts: Just because it looks like a breakout doesn’t mean it’s real. Wait for confirmation — volume, a close outside the pattern, or your favorite indicator giving the green light.
● Shaky patterns: Not every triangle-looking pattern is a triangle. Sometimes it’s just noise. Don’t make up patterns. The market doesn’t care about your geometry.
● Overleveraging: Continuation patterns look reliable, but no pattern is bulletproof. Position sizing still matters. Don’t bet the farm because a pennant gave you butterflies.
💡 Pro Tips from the Chart Trenches
● Set alerts on trendline breaks so you’re not glued to the screen like a caffeinated hawk.
● Use pattern recognition tools if you’re a newer trader — but verify manually. No software is a crystal ball.
● Trade continuation patterns in the direction of the trend. Countertrend flags are usually bear traps in disguise.
📌 One Last Thing: Pattern ≠ Prediction
Chart patterns don’t tell the future. They tell a story about buyer and seller behavior. Continuation patterns? They’re just the market saying, “Yeah, we’re still into this trend. Just grabbing some break first.”
Use them as one part of a system. Combine them with momentum indicators, volume, or good ol’ fashioned risk management.
Because in the end, it’s not about how many triangles you find — it’s about how many fakeouts you avoid.
Off to you : Spotted any textbook triangles or sneaky flags this week? Or caught a pennant fakeout that wrecked your stop loss?
Drop your best (or worst) continuation pattern story below. You never know who might learn something from your chart scars.
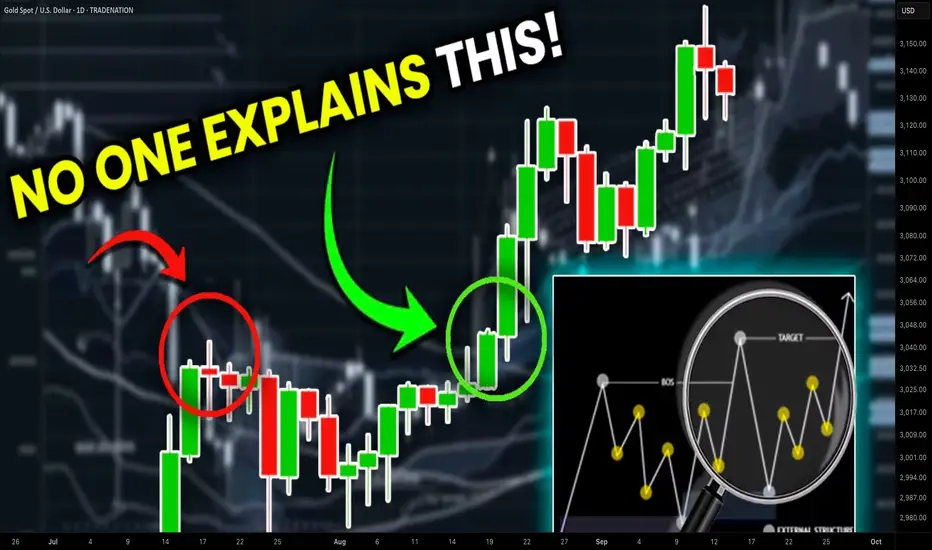
Accurate Price Model for Trading Smart Money Concepts SMC (=
If you trade Smart Money Concepts SMC, there is one single pattern that you should learn to identify.
In this article, you will learn an accurate price model that you can use to predict a strong bullish or bearish movement way before it happens.
Read carefully and discover how to track the silent actions of smart money on any market.
The only thing that you need to learn to easily find this pattern is basic Structure Mapping . After you map significant highs and lows, you will quickly recognize it.
This SMC pattern has 2 models: bullish and bearish ones.
Let's start with a bearish setup first.
Examine a structure of this pattern
it should be based on 2 important elements.
The price should set a sequence of equal lows.
These equal lows will compose a demand zone.
The area where a buying interest will concentrate.
The minimum number of equal lows and lowers highs should be 2 to make a model valid.
Exhausting of bullish moves will signify a loss of confidence in a demand zone . Less and less market participants will open buy positions from that.
At some moment, a demand zone will stop holding. Its bearish breakout will provide a strong bearish signal , and a bearish continuation will most likely follow.
This price model will signify a market manipulation by Smart Money.
They will not intentionally let the price fall, not letting it break a demand zone. A buying interest that will arise consequently will be used as a source of liquidity.
Smart money will grab liquidity of the buyers, silently accumulating huge volumes of selling orders.
Once they get enough of that, a bearish rally will start, with a demand zone breakout as a trigger.
Though, the chart model that I shared above has a strong bullish impulse, preceding its formation, remember that it is not mandatory.
The price may also form a bearish impulse first and for a pattern then.
Each bullish movement that initiates after a formation of an equal low should be weaker than a previous one.
So that the price should set a lower high every time after a formation of an equal low.
Look at a price action on USDCHF forex pair. Way before the price dropped, you could easily identify a market manipulation of Smart Money and selling orders accumulation.
A breakout of a horizontal demand zone was a final bearish confirmation signal.
Let's study its bullish model.
It has a similar structure.
The price should set a sequence of equal highs, respecting a horizontal supply zone.
Each bearish move that follows after its test should have a shorter length, forming a higher low with its completion.
This model will be also valid if it forms after a completion of a bearish impulse.
Weakening bearish movements will signify a loss of confidence in a supply zone, with fewer and fewer market participants selling that.
Its bullish breakout will be an important even that will confirm a highly probable strong bullish continuation.
Smart Money will use this price model to manipulate the market and accumulate buying orders, not letting the price go through a supply zone. They will grab a liquidity of the sellers each time a bearish move follows from a supply zone.
When they finally get enough of a liquidity, a bullish rally will initiate and a supply zone will be broken , providing a strong confirmation signal.
That price model was spotted on GBPJPY forex pair.
Smart Money were manipulating the market, not letting it continue rallying by creating a significant horizontal supply zone.
Selling orders that were executed after its tests provided a liquidity for them.
A bullish breakout of the underlined zone provides a strong bullish confirmation signal.
A breakout and a future rise could be easily predicted once this price model appeared.
Why they do it?
But why do Smart Money manipulate the markets that way?
The answer is simple: in comparison to retail traders, they trade with huge trading orders . To hide their presence and to not impact market prices much, they split their positions into a set of tiny orders that they execute, grabbing the liquidity.
The price model that we discussed today is the example how they do it.
The important thing to note about this pattern is that it efficiently works on any market and any time frame. You can use that for scalping, day trading, swing trading. And it can help you find great investing opportunities.
❤️Please, support my work with like, thank you!❤️
I am part of Trade Nation's Influencer program and receive a monthly fee for using their TradingView charts in my analysis.
Wedge Pattern – Simple Explanation
📚 Wedge Pattern – Simple Explanation
A wedge pattern is a shape on the chart that looks like a triangle or cone. It tells us that the price is getting ready to break out — either up or down.
---
🔻 Falling Wedge (Bullish)
Looks like price is going down, but slowly.
Lines move closer together.
Usually means the price will go up soon.
It's a bullish signal (good for buying).
---
🔺 Rising Wedge (Bearish)
Price goes up, but losing strength.
Lines get closer together.
Usually means the price will go down soon.
It's a bearish signal (good for selling).
---
💡 Easy Tips:
Wait for breakout (big move out of the wedge).
Use a stop-loss below/above the pattern.
Target = height of the wedge.
---
📌 In Short:
Wedge = Squeeze pattern.
Falling wedge = Buy chance.
Rising wedge = Sell chance.
---
Let me know if you have sny doubt in comments

How Can You Use the Ascending Triangle in Trading?How Can You Use the Ascending Triangle in Trading?
An ascending triangle is a chart pattern traders rely on to identify potential breakouts and further price movements. Recognised for its versatility, this pattern can signal trend continuations across all types of markets, including stocks, forex, commodities, and cryptocurrencies*. In this article, we’ll break down how to spot and trade this formation.
What Is an Ascending Triangle?
An ascending or rising triangle is a bullish chart pattern that usually signals a trend continuation. It is framed by two trendlines. The upper line connects highs placed at almost the same level, while the lower line is angled and connects higher lows.
The triangle’s appearance is explained as follows: buyers try to push the price up, but they meet a strong resistance level, so the price rebounds. Still, buyers have strength, which is reflected in higher lows. Therefore, they continue pushing the price until it breaks above the resistance level. The period during which the price bounces back and forth between the two lines depends on the timeframe. On daily charts, the triangle can be in place for over a week.
Note: The ascending triangle is a continuation chart pattern but sometimes it can be used as a reversal signal. It happens when the ascending triangle occurs in a downtrend. It’s the biggest challenge of all the triangles.
The rising triangle is one of the setups in the triangle group. There are also descending and symmetrical formations.
Ascending, Descending, and Symmetrical Triangles: The Differences
The triangle group of patterns comprises ascending, descending, and symmetrical formations.
The ascending triangle is a bullish formation and the descending triangle is bearish. At the same time, the symmetrical triangle is a bilateral setup that signals a rise and a fall in the price.
To distinguish between them, traders draw trendlines. In a rising triangle pattern, an upper trendline is horizontal and connects equal or almost equal highs, while the lower trendline is rising as it connects higher lows. In a descending or falling triangle pattern, the lower trendline is horizontal and connects equal or almost equal lows, while the upper trendline declines, going through lower highs. A symmetrical triangle has a falling upper line that connects lower highs and a rising lower line that connects upper lows.
How Traders Spot the Ascending Triangle
It’s quite easy to identify the formation on a chart. Still, there are a few rules that may help a trader determine its strength.
- The trend strength. Although the setup may appear on any timeframe, traders look for strong long-term trends as risks of a fakeout on low charts are higher.
- Consolidation. Triangles appear when the market consolidates within an overall trend.
- Trendlines. Trendlines must be drawn through at least two points. Still, the larger the number of points, the higher the possibility the setup works.
- Breakout. Can the ascending triangle pattern be bearish? No. It is a bullish formation that appears in a bullish and a bearish trend but always signals a potential price rise.
How Can You Trade Ascending Triangles?
The rising triangle pattern is usually considered a continuation setup formed in an uptrend. Still, if the ascending triangle is in a downtrend, it may signal a trend reversal. The trading rules will be the same in both cases.
As with most chart patterns, triangles have specific rules that help traders place entry and exit points.
Entry
The theory suggests trades go long when the price breaks above the setup's upper boundary. In a conservative approach, traders wait for the price to form at least several candles before entering the market. In a risky strategy, traders open a position as soon as the breakout occurs, and the breakout candlestick closes.
It's worth considering trading volumes as breakouts often turn into fakeouts, meaning the market returns to its previous trend. The chance of a strong breakout is higher if the volumes are high.
However, increased volumes aren't the only tool used to confirm a breakout. Many traders consider trend indicators and oscillators to potentially limit the risks of bad trading decisions.
- If the triangle serves as a continuation setup, it may be helpful to look at the signals of trend-strength indicators, including the average directional index.
- If traders use the ascending triangle as a reversal setup, they usually implement indicators that may signal a trend reversal, including the moving average, the relative strength index, the moving average convergence divergence, and the stochastic oscillator.
Take Profit
A standard take-profit target equals the size of the largest part of the setup and is measured just from the breakout trendline.
Stop Loss
Traders consider several options when placing stop-loss levels. In a conservative approach, they implement the risk/reward ratio, which is usually 1:2 or 1:3 but depends on the trader's willingness to take risks. Also, traders utilise the upper trendline as a threshold and place the stop-loss order just under it.
Note: These are general rules. However, traders can develop their own trading strategies and adjust the pattern's parameters and rules according to their trading approach.
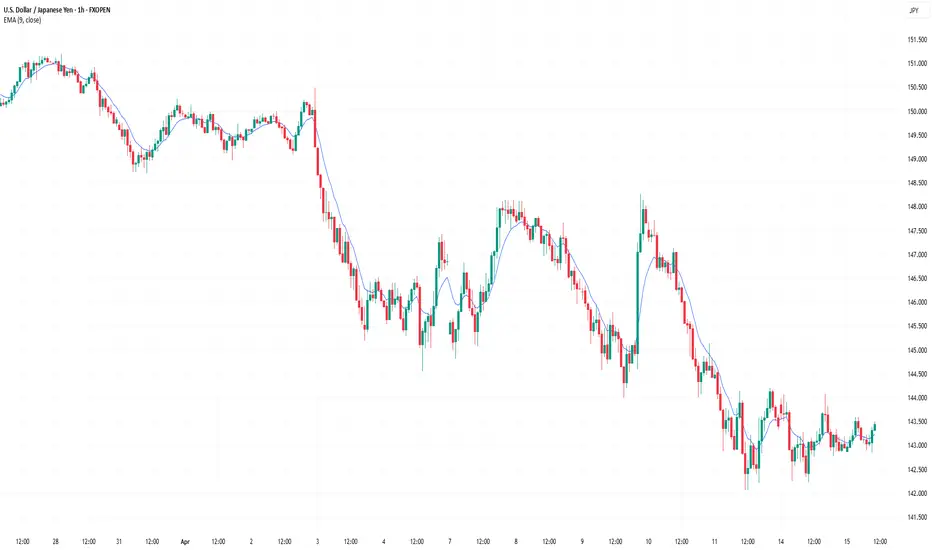
Ascending Triangle: Strategy
In this strategy, traders observe an existing bullish trend and the formation of an ascending triangle, which suggests the potential for a continuation pattern. Incorporating a short-term moving average, such as a 9-period EMA, provides dynamic support, aligning with the trendline to strengthen the setup.
Entries
- Traders typically wait for the price to break through the top trendline of the ascending triangle.
- A strong candle breaking the resistance level adds confidence, though any move above the top trendline can serve as an entry signal.
- The price should also trade above the moving average, offering additional confirmation.
- An order is often placed at the top trendline, anticipating a retracement to this level, which now acts as support.
Stop Loss
- Traders place a stop-loss below the most recent swing low within the triangle.
- For more conservative traders, the stop may be set at any prior swing low, depending on risk tolerance.
Take Profit
- Many traders aim for a risk-reward ratio of 1:2 or 1:3.
- Profits might also be taken at the next strong resistance level, aligning with the market structure.
Rising Triangle: Benefits and Drawbacks
This formation has advantages and pitfalls that traders consider when developing their strategies.
Benefits
- It can be used on any timeframe. Triangles are formed on charts of any period. Still, they might be more effective if the setup appears in a solid trend on a high timeframe.
- It can be used for any asset. Another advantage is that the ascending triangle pattern is used for stock, commodity, cryptocurrency*, and Forex trading.
- Easy to spot. A trader only needs to draw two trendlines to define this setup on the chart.
- Exact entry and exit points. Although traders can develop their entry and exit points, the setup assumes there are specific rules traders with any experience utilise.
Drawbacks
- It can confuse traders. As the rising triangle is used as a reversal and continuation formation, traders with less experience may be confused with its signals.
- False breakouts. The setup works when a price breakout occurs. However, there is a high risk the breakout will appear to be a fakeout, and the price will return.
- The pattern may fail. Aside from a fakeout, there is another risk when trading with triangles. The price may break another side of the formation, and the formation will fail.
- The trading rules may not work. Although specific rules indicate where a trader should place entry and exit points, buyers may be too weak to push the price to the take-profit target.
Final Thoughts
The ascending triangle is one of the more common chart patterns traders use when trading various assets. Still, there is no 100% guarantee that it will work every time you spot it on a price chart. It's vital to remember that every signal must be confirmed with other indicators, chart patterns, and candlesticks. Also, it's a well-known fact that any trade involves risks that should be considered every time a trader enters the market. Improve your skills by practising on different assets and timeframes.
FAQ
How Do You Form an Ascending Triangle?
An ascending triangle is formed when the price action creates a series of higher lows while facing a resistance level, resulting in a horizontal upper trendline and a rising lower trendline. The price consolidates between these two lines before potentially breaking out above the resistance, signalling a bullish continuation.
Is an Ascending Triangle Bullish or Bearish?
The ascending triangle is a bullish pattern. It suggests that buyers are gaining strength as higher lows form, increasing the likelihood of a breakout above the resistance level. There is a descending triangle pattern that usually appears in a downtrend, signalling a downward movement.
How to Enter an Ascending Triangle?
According to the theory, in triangle pattern trading, it’s common to enter the market when the price breaks above the upper trendline of the triangle. In a conservative approach, traders wait for confirmation through several closing candles after the breakout. The increased volume also adds confidence to the trade.
What Is the Ascending Triangle Pattern Retest?
A retest occurs when the price breaks out of the triangle but then briefly falls back to test the former resistance level. A successful retest confirms the breakout and can provide an additional entry point.
How Long Does an Ascending Triangle Pattern Take to Form?
The formation of a bullish triangle pattern can vary based on the timeframe. On daily charts, it can take several days to weeks, while on shorter timeframes, it might form within hours.
What Is the Difference Between an Ascending Triangle and a Rising Wedge?
In comparing the ascending triangle vs. the rising wedge, it’s key to recognise that the rising wedge has converging trendlines, signalling a possible weakening trend, often leading to a bearish reversal. In contrast, an ascending triangle trading pattern typically signals a continuation of the uptrend.
*At FXOpen UK, Cryptocurrency CFDs are only available for trading by those clients categorised as Professional clients under FCA Rules. They are not available for trading by Retail clients.
This article represents the opinion of the Companies operating under the FXOpen brand only. It is not to be construed as an offer, solicitation, or recommendation with respect to products and services provided by the Companies operating under the FXOpen brand, nor is it to be considered financial advice.
Learn These Patterns And You'll Never Regret ItEVERYTHING ON THE TRIANGLE PATTERN
a triangle chart pattern involves price moving into a tighter and tighter range (like a consolidation phase which has a triangle-like shape) as time goes by and provides a visual display of a battle between bulls and bears.
The triangle pattern is generally categorised as a “continuation pattern”, meaning that after the pattern completes, it’s assumed that the price will continue in the trend direction it was moving before the pattern appeared.
note: the triangle pattern depends on the trend however don't hold on to that thought since fake-outs are possible. the point i am trying to make is that you should not be obsessed with which direction the price goes, but you should be ready for movement in either direction.
there are three triangle patterns:
a) the ascending (upward slope consisting of higher-lows and a consistent resistance),
b) descending (downward slope consisting of lower-highs and a consistent support)
c) symmetrical (equal slopes the market is forming lower-highs and higher-lows)..
the triangle is different from a wedge. however, a wedge can be in a triangle or better put the general formation of a wedge is a triangle-like shape (in some cases).
point to note:
• you need at least two points (bullish or bearish) to connect for a triangle to be considered, and a consistent support or resistance.
• the volatility of price of any instrument decreases when there's a triangle pattern and increases on breakout of the pattern.
• measuring the size of the triangle can serve as a good profit target (will explain in meeting)
• keep an open mind at all times.
📝..

Triangle Chart Patterns: How to Identify and Trade ThemTriangle Chart Patterns: How to Identify and Trade Them
Triangle chart patterns are essential tools in technical analysis, helping traders identify potential trend continuations. These formations build as the price consolidates between converging trendlines, signalling an upcoming move in the market. In this article, we’ll explore the three types of triangle patterns—symmetrical, ascending, and descending—and how traders use them to analyse price movements.
What Are Triangle Chart Patterns?
Triangle chart patterns are a common tool used to understand price movements in the market. These patterns form when the price of an asset moves within two converging trendlines, creating a triangle shape on a chart. The lines represent support and resistance levels, and as they get closer together, it signals a potential breakout in one direction.
Symmetrical, ascending, and descending are three types of triangle patterns. Each of these patterns reflects a different market sentiment, with symmetrical triangles showing indecision, ascending triangles suggesting a bullish bias, and descending triangles hinting at bearish momentum. These formations are useful because they help traders spot potential breakouts, where the price might move sharply up or down after a period of consolidation.
It’s important to note that triangles and wedge patterns are similar but not the same. Both patterns involve converging trendlines, but wedges tend to slope upward or downward. Triangles, on the other hand, either feature one horizontal trendline and a sloping trendline or two sloping trendlines at roughly the same angle.
Below, we’ll cover the three triangle types. If you’d like to follow along, head over to FXOpen and TradingView to get started with real-time charts.
Symmetrical Triangle
The symmetrical triangle is a popular chart pattern that shows up when the price of an asset starts consolidating within a tighter range. Unlike other triangle patterns, it doesn’t lean heavily in either direction—bullish or bearish—making it a neutral signal. It forms when buyers and sellers are in a bit of a standoff, with no clear trend in sight. However, this period of indecision often leads to a significant move once the price breaks out of the pattern.
What Does It Look Like?
- Two converging trendlines;
- One sloping down from the highs (resistance);
- One sloping up from the lows (support);
- The price oscillates between these two lines, forming lower highs and higher lows;
- The formation narrows as the lines get closer together, creating a point of breakout.
What Does It Indicate?
A symmetrical triangle pattern indicates a period of indecision in the market. Buyers and sellers are evenly matched, causing the price to move within a narrowing range. As it gets smaller, the pressure builds, and the price is likely to break out either up or down. Since the formation is neutral, the breakout could occur in either direction, and traders wait for this moment to see where the market is heading.
How Do Traders Use It?
Traders typically watch for a breakout from the symmetrical triangle to signal the next significant price movement. They often look for an increase in trading volume alongside the breakout, as this can confirm the strength of the move. In most cases, it’s used as a signal for potential price continuation. However, some traders see it as a reversal indicator, depending on what the preceding trend looks like.
Ascending Triangle
An ascending triangle is a bullish triangle pattern that’s often looked for when analysing potential price breakouts. It usually forms during an uptrend but may also appear in a downtrend. It suggests that buyers are becoming more aggressive, while sellers are struggling to push the price lower, creating a situation where the market might break upwards.
What Does It Look Like?
- A horizontal resistance line at the top (price struggles to break above this level);
A rising trendline at the bottom, connecting higher lows (buyers are stepping in earlier each time);
- The price moves between these two lines, creating a triangle shape;
- The formation narrows over time, putting pressure on the resistance level.
What Does It Indicate?
An ascending triangle pattern signals that buyers are gaining control. While the price keeps hitting a ceiling (resistance), the higher lows show that the market’s buying pressure is increasing. This often leads to a breakout above the resistance level, where the price can make a significant upward move. Traders usually see this formation as a sign that the market is primed for a continuation of the current uptrend. However, sometimes it can appear in a downtrend and signal a trend reversal.
How Do Traders Use It?
Traders typically use the ascending triangle to spot potential breakouts above the resistance level. When the price finally moves and closes above this line, it’s seen as confirmation that the upward trend is continuing. Many also pay close attention to the trading volume during this breakout—rising volume can confirm that the breakout is genuine.
In some cases, the price may break through the resistance quickly, while in others, it could take time before the upward move happens. There may also be false breakouts before the true bullish move occurs, with the price typically closing below resistance.
Descending Triangle
A descending triangle is a bearish chart pattern that signals potential downward movement in the market. It typically forms during a downtrend but can also appear in an uptrend. It shows that sellers are becoming more dominant, while buyers are struggling to push the price higher, which could lead to a breakdown below a key support level.
What Does It Look Like?
- A horizontal support line at the bottom (price struggles to break below this level);
- A descending trendline at the top, connecting lower highs (sellers are pushing the price down);
- The price moves between these two lines, creating a triangle shape;
- The formation narrows over time, with the pressure building on the support level.
What Does It Indicate?
A descending triangle chart pattern suggests that sellers are in control. While the price holds at the support level, the series of lower highs shows that selling pressure is increasing. This often leads to a breakdown below the support line, where the price might experience a sharp decline. Traders see the formation as a bearish signal, indicating that the market could continue its downward trend.
How Do Traders Use It?
Traders typically use the descending triangle to identify potential breakdowns below the support level. When the price falls and closes below this line, it’s considered confirmation that the sellers have taken over and that further downside movement could follow.
Similar to other triangle patterns, it’s common to watch for a rise in trading volume during the breakdown, as it can confirm the strength of the move. It’s also possible to see false breakouts below the support level when the price closes back inside the pattern almost immediately.
How Traders Use Triangle Patterns in Technical Analysis
These patterns are just one piece of the puzzle in technical analysis, but they can offer us valuable insights when used correctly.
Triangle Pattern Trading: Entry, Stop-Loss, and Profit Targets
Entry Points
Traders typically wait for a confirmed breakout from the triangle formation’s boundaries before entering a trade. For ascending triangles, this means watching for the price to break above the upper trendline (resistance), while for descending triangles, they look for a breakdown below the lower trendline (support). In a symmetrical triangle, the breakout may be in either direction, usually informed by the broader market trend.
The entry is often confirmed by a closing candle above or below these key levels to reduce the risk of false breakouts.
Stop-Loss Placement
Stop-loss orders are crucial here. For ascending triangles, stop losses might be placed just below the last swing low, while for descending triangles, they might be set just above the recent swing high. In the case of symmetrical triangles, traders often place the stop-loss just outside the formation’s apex.
Profit Targets
To set profit targets, traders typically use the triangle's height (the distance between the highest and lowest points). This height is then projected from the breakout point, offering a realistic target for the trade. For example, if a triangle stock pattern’s height is $10 and the breakout occurs at $50, the target would be $60 for a bullish move.
Combining with Market Context
Triangles may become more reliable when considered in the context of the broader market environment. Traders don’t just look at the pattern in isolation—they analyse the prevailing trend, market sentiment, and even macroeconomic factors to gauge whether a breakout aligns with the larger market movement. For instance, an ascending formation in a strong uptrend adds confidence to the idea of a bullish breakout.
Using Other Indicators for Confirmation
While triangles provide a useful framework, they’re usually combined with other technical indicators for confirmation. Traders often align triangles with volumes, moving averages, or momentum indicators to assess whether the breakout has strong support behind it. For instance, a breakout confirmed by high volume or a moving average crossover might add confluence to the trade.
Limitations and Considerations of Triangle Patterns
Triangles are useful tools in technical analysis, but they come with limitations and important considerations. While they can signal potential breakouts, it’s essential to approach them cautiously.
- False Breakouts: Triangles often experience false breakouts, where the price briefly moves beyond the trendline but quickly reverses. This may trap traders in unfavourable positions.
- Subjectivity: These formations are open to interpretation. Different people may draw trendlines slightly differently, leading to varying conclusions about where the breakout occurs.
- Need for Confirmation: Relying solely on patterns can be risky. They may work better when combined with other indicators, such as volume or moving averages, to confirm the trend direction.
- Market Conditions: In volatile or news-driven markets, chart patterns may not behave as expected, reducing their reliability. They may provide false signals or lose significance in these situations.
The Bottom Line
Triangle chart patterns are popular tools among those looking to analyse market movements and potential breakouts. Whether it’s a symmetrical, ascending, or descending triangle, these patterns provide valuable insights into price consolidation and future trends. While no pattern guarantees a winning trade, combining triangles with other indicators may improve market analysis.
Ready to apply your knowledge? Open an FXOpen account to explore chart patterns in more than 700 live markets and take advantage of our low-cost, high-speed trading environment backed by advanced trading platforms.
FAQ
What Is a Triangle Chart Pattern?
A triangle chart is a pattern in technical analysis that forms when the price of an asset moves between converging trendlines, creating a triangle shape on a price chart. They typically signal a period of consolidation before a strong potential breakout in price.
What Are the Patterns of Triangles?
There are three main types of triangles in chart patterns: symmetrical, ascending, and descending. Symmetrical triangles indicate indecision in the market while ascending triangles are often bullish, and descending triangles tend to be bearish.
How to Trade a Triangle?
Traders typically wait for a confirmed breakout from the triangle’s trendlines. According to theory, entry points are based on a breakout above resistance or below support, with stop-loss orders placed just outside the triangle. Profit targets are often set based on the height (the distance between the highest and lowest points) of the pattern.
What Is the Triangle Pattern Strategy?
The triangle pattern strategy involves waiting for a breakout and using the formation’s height to set profit targets. It’s combined with tools like volume, moving averages, and momentum indicators to confirm the move and avoid false breakouts.
Is the Triangle Pattern Bullish or Bearish?
They can be both bullish and bearish. Ascending triangles are generally seen before a bullish movement, descending triangles are bearish, and symmetrical triangles can be either.
This article represents the opinion of the Companies operating under the FXOpen brand only. It is not to be construed as an offer, solicitation, or recommendation with respect to products and services provided by the Companies operating under the FXOpen brand, nor is it to be considered financial advice.

Bitcoin Seasonality - Best Month (October) and Best Day (Monday)It's very important for every Bitcoin trader to know its seasonality because this will significantly increase the probability of successful trades. I have been trading Bitcoin for almost 10 years, and I successfully use seasonality patterns to predict Bitcoin price movements. For example, you don't want to go long on Bitcoin during August or September; that's probably a very bad idea. The biggest market crashes usually happen in September. But you definitely want to go long in October or April, as these months are the most promising. Knowledge of these patterns will give you an advantage over standard retail traders. Every trade matters.
Average return by Month (%)
January: +5.1%
February: +12.1%
March: +4.8%
April: ˇ+18.7%
May: +14.2%
June: +4.4%
July: +6.1%
August: -3.1%
September: -8.4%
October: +22.2%
November: +17.9%
December: +7.3%
Average return by Weekday (%)
Monday: +0.63%
Tuesday: +0.18%
Wednesday: +0.54%
Thursday: +0.40%
Friday: +0.37%
Saturday: +0.45%
Sunday: +0.10%
Currently I am bullish on Bitcoin as the price is in an uptrend and the bear market is not confirmed; I expect Bitcoin to hit 115k probably at the end of February. What I also expect is an alt season - alt season is starting right now! So it's time to buy some altcoins. Ethereum should outperform BTC in the next weeks as well.
Write a comment with your altcoin, and I will make an analysis for you in response. Also, please hit boost and follow for more ideas. Trading is not hard if you have a good coach! This is not a trade setup, as there is no stop-loss or profit target. I share my trades privately. Thank you, and I wish you successful trades!

ETH | Alternative Chart Pattern | EducationJust a short update for my latest C&H post
Price is also forming an Ascending Triangle pattern with a liquidity zone of $2,800 - $3,000 for an average spot for buyer to step in
When trading chart patterns it's best to figure out how to jump in before the breakout similarly to the last touches highlighted in blue on the bottom trendline
You can see that price was forming a bottom-like pattern or what I also like to call price accumulation and then vice versa for the tops.

Ascending Triangle in Nikkei/Yen Futures: A 2025 Bullish Setup?1. Introduction
The Nikkei/Yen Futures, a crucial instrument for traders aiming to capture movements in Japan’s equity index and its currency dynamics, presents an intriguing setup as we step into 2025. An ascending triangle pattern, a classic bullish formation, is emerging on the chart, signaling a potential breakout to the upside.
Adding to the technical allure is the depletion of sell unfilled orders (UFOs) within a significant price zone between 40,420 and 39,685. This critical area, revisited six times since late July 2024, has seen a steady reduction of unfilled sell orders, opening the possibility for bullish momentum to dominate. With the price currently hovering near the 39,685 level, the stage appears set for a breakout opportunity.
2. The Technical Setup
The ascending triangle, characterized by a series of higher lows converging toward a horizontal resistance level, often signifies bullish pressure. In the case of the Nikkei/Yen Futures, the horizontal resistance resides near 39,685, the lower boundary of a key sell UFO zone.
This resistance has been tested repeatedly since July 2024, with each revisit chipping away at the sell orders within the zone. Such behavior suggests diminishing selling pressure, setting the foundation for a breakout. The anticipated target for this breakout, calculated using Fibonacci projection, is set at 41,380—aligning with historical price action and technical projections.
Key Contract Specifications:
o Regular Nikkei/Yen Futures (NIY1!)
Contract Size: ¥500 x Nikkei 225 index
Tick Size: ¥5
Point Value: ¥2,500
Margin Requirement: Approx. $ 1,500,000 JPY
o Micro Nikkei/Yen Futures (MNI)
Contract Size: ¥50 x Nikkei 225 index
Tick Size: ¥5
Point Value: ¥250
Margin Requirement: Approx. $ 150,000 JPY
These details ensure accessibility for both institutional and retail traders, with the micro contract enabling smaller capital commitments while maintaining exposure to the same underlying asset.
3. Forward-Looking Trade Plan
The technical evidence supports a bullish trade plan for Nikkei/Yen Futures:
Trade Direction: Long
Entry Price: Above 39,685, confirming a breakout from the resistance level.
Target Price: 41,380, based on Fibonacci projections.
Stop Loss: 39,120, targeting a 3:1 reward-to-risk ratio to manage risk effectively.
Reward-to-Risk Ratio: 3:1 (Calculated: 41,380 - 39,685 = 1,695 reward; 39,685 - 39,120 = 565 risk).
The trade parameters apply to both the standard and micro contracts, offering flexibility in position sizing. Traders with smaller accounts may opt for the micro contract to manage margin requirements while engaging in this high-potential setup.
4. Importance of Risk Management
Risk management remains the cornerstone of any successful trading strategy, particularly when trading leveraged instruments like futures. Here are key considerations for managing risk in the Nikkei/Yen Futures trade setup:
Stop-Loss Orders: Placing a stop-loss at 39,120 ensures a predefined risk level, protecting traders from unexpected market reversals. It’s vital to adhere to this level to maintain discipline and avoid emotional decision-making.
Position Sizing: The availability of micro contracts (MNIY1!) allows traders to tailor their position size according to their account size and risk tolerance. For example, trading one micro contract involves a significantly smaller margin commitment compared to the regular contract, making it suitable for retail traders.
Defined Risk Exposure: Leveraged products like futures can lead to substantial losses if risk is not clearly defined. Using stop-loss orders and trading within calculated risk parameters prevents the potential for undefined losses.
Precise Entries and Exits: Setting the entry above 39,685 ensures a systematic approach to triggering the trade based on the expected breakout. Similarly, targeting 41,380 using Fibonacci projections ensures that profit objectives align with technical analysis rather than arbitrary levels.
By prioritizing these aspects, traders can mitigate risks while maximizing the potential reward from this bullish setup.
5. Closing Remarks
The Nikkei/Yen Futures seem to be poised for a potential breakout as we enter 2025, driven by a combination of technical factors and diminishing sell-side unfilled orders. The ascending triangle formation strengthens the bullish bias, with the calculated Fibonacci projection of 41,380 offering an attractive target.
Both the standard and micro contracts cater to different trader profiles, allowing participation regardless of account size. As the price approaches the critical 39,685 level, traders are encouraged to stay vigilant, using real-time CME data to track developments and validate entry triggers.
When charting futures, the data provided could be delayed. Traders working with the ticker symbols discussed in this idea may prefer to use CME Group real-time data plan on TradingView: www.tradingview.com - This consideration is particularly important for shorter-term traders, whereas it may be less critical for those focused on longer-term trading strategies.
General Disclaimer:
The trade ideas presented herein are solely for illustrative purposes forming a part of a case study intended to demonstrate key principles in risk management within the context of the specific market scenarios discussed. These ideas are not to be interpreted as investment recommendations or financial advice. They do not endorse or promote any specific trading strategies, financial products, or services. The information provided is based on data believed to be reliable; however, its accuracy or completeness cannot be guaranteed. Trading in financial markets involves risks, including the potential loss of principal. Each individual should conduct their own research and consult with professional financial advisors before making any investment decisions. The author or publisher of this content bears no responsibility for any actions taken based on the information provided or for any resultant financial or other losses.

Ascending Triangle Pattern Tutorial: 3/8 Bullish PatternsAscending Triangle Pattern Tutorial: 3/8 Bullish Patterns
An ascending triangle is a bullish continuation chart pattern that signals the potential for an upward breakout. Here's how it forms:
Flat Upper Trendline: The upper trendline is flat, indicating a resistance level where the price consistently faces selling pressure and fails to move higher.
Rising Lower Trendline: The lower trendline is ascending, showing higher lows as buyers step in at increasingly higher prices.
Price Convergence: The price action gets squeezed between the two trendlines, leading to a tightening range.
Breakout: Eventually, the price breaks above the resistance level, indicating a continuation of the upward trend. This breakout is typically accompanied by a surge in volume.
Ascending triangles are popular among traders because they offer clear entry and exit points. The height of the triangle, measured from the base to the horizontal resistance, can be used to estimate the potential price target following the breakout.
LIKE l FOLLOW l SHARE

Symmetrical Triangle Pattern what is it/ how to draw it? 2/8Symmetrical Triangle Pattern what is it/ how to draw it? 2/8 Bullish Charting Patterns
A symmetrical triangle is a chart pattern that forms when the price of an asset converges with two trendlines that are moving towards each other, creating a triangular shape. Here’s how it works:
Converging Trendlines: The upper trendline is formed by connecting the descending highs, and the lower trendline is formed by connecting the ascending lows. These trendlines converge at a point called the apex.
Volume Decrease: As the pattern develops, trading volume typically decreases, indicating a period of consolidation and indecision in the market.
Breakout: Eventually, the price breaks out from the triangle, which can occur in either direction – upwards or downwards. The direction of the breakout often dictates the future trend of the asset.
Symmetrical triangles are considered continuation patterns, meaning they usually signal that the prevailing trend (upward or downward) before the pattern will continue after the breakout. Traders often use the height of the triangle (the distance between the initial high and low points) to estimate the potential price target following the breakout.
Like l Follow l Share
Stay tuned for the other 6 BULLISH CHARTING PATTERNS

Best Price Action Pattern For GOLD Trend Following Trading
This bullish pattern is very powerful .
Being spotted on a daily/4h/1h, any time frame, it will help you to accurately predict a strong bullish movement on Gold .
In this article, I will teach you to identify a buying volumes accumulation on Gold chart and as a bonus, I will show you how I predicted a recent bullish rally with this price action pattern.
The initial point of this pattern will be a completion point of a strong bullish impulse.
At some moment, the price finds a strong horizontal resistance, stops growing and retraces.
The second point of the pattern will be a completion of a retracement.
It should strictly be a higher low - it should be higher than the low of an initial bullish impulse.
After a retracement, the price should return to a horizontal resistance and set an equal high , that will be the third point of the pattern.
Then, the price should retrace AT LEAST one more time from a horizontal resistance and set a new higher low.
After that, the price should set one more equal high.
3 equal highs and 2 higher lows will compose a bullish accumulation pattern.
Please, note, that the price may easily set more equal highs and more consequent new higher lows and keep the pattern valid.
Above is the example of a bullish accumulation pattern on Gold on an hourly time frame. The price set 3 equal highs and 3 consequent higher lows.
This pattern will signify the weakness of sellers and the accumulation of buying volumes.
The point is that each consequent bearish price movement from a resistance is weaker than a previous one. It means that fewer sellers are selling from the resistance and more buyers start buying, not letting sellers go lower.
In our example, we can clearly see the consequent weakening, bearish price movements.
This pattern indicates a highly probable breakout attempt of the resistance. A candle close above that provides a strong bullish signal.
The broken resistance will turn into support and will provide a safe point to buy the market from.
In our example, the market broke the underlined horizontal resistance and closed above that. It indicates the completion of a bullish accumulation and a highly probable bullish trend continuation.
You can see that Gold retested a broken structure and then a strong bullish wave initiated.
In a strong bullish market that we currently contemplation on Gold, this bullish pattern will provide a lot of profitable trading opportunities.
No matter whether you are scalping, day trading or swing trading Gold, this bullish accumulation pattern will help you to predict long-term, mid-term and short-term bullish movements.
❤️Please, support my work with like, thank you!❤️

The Symmetrical Triangle: Real Success Rates + Breakout.The Symmetrical Triangle: Real Success Rates + Breakout.
The symmetrical triangle is an important chart pattern in technical analysis, deserving special attention from professional traders.
This formation is characterized by a convergence of prices between two trendlines, one descending and the other ascending, creating a consolidation zone where indecision between buyers and sellers is palpable.
Statistical Analysis
Empirical data reveals that the success rate of the symmetrical triangle for a trend continuation is approximately 54%. This percentage, although higher than 50%, underlines the importance of a cautious approach and rigorous risk management in using this pattern.
Breakout Point
The breakout of the symmetrical triangle usually occurs when the price has traveled approximately 75% of the distance to the apex. This point is crucial for traders, as it often represents the moment when volatility increases and a new trend can be established.
Risks and False Exits
It is essential to note that the symmetrical triangle has a relatively high rate of false exits. Statistics indicate that approximately 13% of cases in a bear market can result in a false exit to the bottom. This phenomenon underlines the need for additional confirmation before entering a position.
Strategy of use
To effectively exploit the symmetrical triangle, professional traders must:
-Identify the formation accurately.
-Wait for the breakout near the point of convergence of the trendlines.
-Confirm the breakout with other technical indicators or an increase in volume.
-Put in place strict risk management to protect against false exits.
In conclusion, the symmetrical triangle, although being a valuable tool in the trader's arsenal, requires a methodical approach and a thorough understanding of its characteristics to be used effectively in a trading strategy.

Actual Success Rates of Ascending and Descending TrianglesActual Success Rates of Ascending and Descending Triangles
Here is an analysis of the actual success rates of ascending and descending triangles in trading, based on the information provided:
Success Rates
Ascending and descending triangles generally have fairly high success rates as continuation patterns:
-The ascending triangle has a success rate of approximately 72.77%.
-The descending triangle has a slightly higher success rate of 72.93%.
These numbers come from a study that tested over 200,000 price patterns over a 10-year period.
Factors Influencing Success
Several factors can influence the success rate of these patterns:
-The trader's ability to execute the strategy correctly
-Market conditions at the time the triangle formed
-Market liquidity
-Overall market sentiment
Important Points to Consider
-Triangles are considered reliable continuation patterns, especially in trending markets.
-The ascending triangle in an uptrend is statistically more reliable than the descending triangle.
-To validate the pattern, the price must touch at least twice each of the upper and lower lines.
-An increase in volume during the breakout is an important confirmation sign.
Strategies to improve the chances of success
-Wait for the triangle to fully form before entering a position1.
-Confirm the breakout with a close above/below the resistance/support level.
-Use additional technical indicators to confirm the signal.
-Pay attention to the volume, which should increase during the breakout.
Conclusion
Although ascending and descending triangles have relatively high success rates, it is important to use them in conjunction with other technical analysis tools and to take into account the overall market context to maximize the chances of success.

Profitable Triangle Trading Strategy Explained
Descending triangle formation is a classic reversal pattern . It signifies the weakness of buyers in a bullish trend and bearish accumulation .
In this article, I will teach you how to trade descending triangle pattern. I will explain how to identify the pattern properly and share my trading strategy.
⭐️ The pattern has a very peculiar price action structure :
1. Trading in a bullish trend, the price sets a higher high and retraces setting a higher low .
2. Then the market starts growing again but does not manage to set a new high, setting a lower high instead.
3. Then the price drops again perfectly respecting the level of the last higher low, setting an equal low .
4. After that, one more bullish movement and one more consequent lower high , bearish move, and equal low .
Based on the last three highs , a trend line can be drawn.
Based on the equal lows , a horizontal neckline is spotted.
❗What is peculiar about such price action is the fact that a set of lower highs signifies a weakening bullish momentum : fewer and fewer buyers are willing to buy from horizontal support based on equal lows.
🔔 Such price action is called a bearish accumulation .
Once the pattern is formed it is still not a trend reversal signal though. Remember that the price may set many lower highs and equal lows within the pattern.
The trigger that is applied to confirm a trend reversal is a bearish breakout of the neckline of the pattern.
📉Then a short position can be opened.
For conservative trading, a retest entry is suggested.
Safest stop is lying at least above the level of the last lower high.
However, in case the levels of the lower highs are almost equal it is highly recommendable to set a stop loss above them all.
🎯For targets look for the closest strong structure support.
Below, you can see the example of a descending triangle trade that I took on NZDCAD pair.
After I spotted the formation of the pattern, I was patiently waiting for a breakout of its neckline.
After a breakout, I set a sell limit order on a retest.
Stop loss above the last lower high.
TP - the closest key support.
90 pips of pure profit made.
Learn to identify and trade descending triangle. It is one of the most accurate price action patterns every trader should know.

MASTERING SYMMETRICAL TRIANGLES: A GUIDE FOR TRADERS👀See the first 3 items on the chart👆
🔰Other details:
⭐D:
⭐E:
⭐F:
⭐G:
🔰Additional Considerations for Triangles:
⭐H: Number of Points: To construct a triangle, we need at least two HIGHS and two LOWS. Occasionally, triangles are formed using six points instead of the usual four.
⭐I: Validity Criterion: The BREAKOUT point (exit point) of a triangle should not be too close to the intersection of its upper and lower sides; otherwise, the triangle loses its validity.

Symmetrical TriangleA symmetrical triangle is a chart formation where the slope of the price’s highs and the slope of the price’s lows converge together to a point where it looks like a triangle.

Trading Diverging Chart PatternsContinuing our discussion on trading chart patterns, this is our next tutorial after Trading Converging Chart Patterns
This tutorial is based on our earlier articles on pattern identification and classification.
Algorithmic Identification of Chart Patterns
Flag and Pennant Chart Patterns
In this tutorial, we concentrate on diverging patterns and how to define rules to trade them systematically. The diverging patterns discussed in this tutorial are:
Rising Wedge (Diverging Type)
Falling Wedge (Diverging Type)
Diverging Triangle
Rising Triangle (Diverging Type)
Falling Triangle (Diverging Type)
🎲 Historical Bias and General Perception
Before we look into our method of systematic trading of patterns, let's have a glance at the general bias of trading diverging patterns.
🟡 The Dynamics of Diverging Wedge Patterns
Diverging Wedge patterns are typically indicative of the Elliott Wave Structure's diagonal waves, potentially marking the ending diagonal waves. That means that the patterns may signal the ending of a long term trend.
Hence, the diverging rising wedge is considered as bearish, whereas the diverging falling wedge is considered as bullish when it falls under Wave 5 of an impulse or Wave C of a zigzag or flat.
For an in-depth exploration, refer to our detailed analysis in Decoding Wedge Patterns
Both rising wedge and falling wedge of expanding type offers lower risk reward (High risk and low reward) in short term as the expanding nature of the pattern will lead to wider stop loss.
🎯 Rising Wedge (Expanding Type)
Expanding Rising Wedge pattern is historically viewed with bearish bias.
🎯 Falling Wedge (Expanding Type)
Expanding Falling Wedge pattern is historically viewed with bullish bias.
🟡 The Dynamics of Diverging Triangle Patterns
Diverging pattern in general means increased volatility. Increased volatility during the strong trends also mean reducing confidence that may signal reversal.
🎲 Alternate Approach towards trading diverging patterns
Lack of back testing data combined with subjectivity in Elliott wave interpretation and pattern interpretation makes it difficult to rely on the traditional approach. The alternative method involves treating all expanding patterns equally and define a systematic trading approach. This involves.
When the pattern is formed, define a breakout zone. One side of the breakout zone will act as breakout point and the other side will act as reversal point.
Depending on the breakout or reversal, trade direction is identified. Define the rules for entry, stop, target and invalidation range for both directions. This can be based on specific fib ratio based on pattern size.
Backtest and Forward test the strategy and collect data with respect to win ratio, risk reward and profit factor to understand the profitability of patterns and the methodology.
Breaking it down further.
🟡 Defining The Pattern Trade Conditions
Base can be calculated in the following ways.
Distance between max and min points of the pattern. (Vertical size of the pattern)
Last zigzag swing of the pattern (This is generally the largest zigzag swing of the pattern due to its expanding nature)
This Base is used for calculation of other criteria.
🎯 Breakout Zone - Entry Points
Breakout zone can be calculated based on the following.
Long Entry (top) = Last Pivot + Base * (Entry Ratio)
Short Entry (bottom) = Last Pivot - Base * (Entry Ratio)
If the direction of the last zigzag swing is downwards, then top will form the reversal confirmation and bottom will form the breakout confirmation. Similarly, if the direction of the last zigzag swing is upwards, then top will become the breakout confirmation point and bottom will act as reversal confirmation point.
🎯 Stops
Long entry can act as stop for short and vice versa. However, we can also apply different rule for calculation of stop - this includes using different fib ratio for stop calculation in the reverse direction.
Example.
Long Stop = Last Pivot - Base * (Stop Ratio)
Short Stop = Last Pivot + Base * (Entry Ratio)
🎯 Invalidation
Invalidation price is a level where the trade direction for a particular pattern needs to be ignored or invalidated. Invalidation price can be calculated based on specific fib ratios. It is recommended to use wider invalidation range. This is to protect ignoring the potential trades due to volatility.
Long Invalidation Price = Last Pivot - Base * (Invalidation Ratio)
Short Invalidation Price = Last Pivot + Base * (Invalidation Ratio)
🎯 Targets
Targets can either be set based on fib ratios, as explained for other parameters. However, the better way to set targets is based on expected risk reward.
Target Price = Entry + (Entry-Stop) X Risk Reward
🟡 Back Test and Forward Test and Measure the Profit Factor
It is important to perform sufficient testing to understand the profitability of the strategy before using them on the live trades. Use multiple timeframes and symbols to perform a series of back tests and forward tests, and collect as much data as possible on the historical outcomes of the strategy.
Profit Factor of the strategy can be calculated by using a simple formula
Profit Factor = (Wins/Losses) X Risk Reward
🟡 Use Filters and Different Combinations
Filters will help us in filtering out noise and trade only the selective patterns. The filters can include a simple logic such as trade long only if price is above 200 SMA and trade short only if price is below 200 SMA. Or it can be as complex as looking into the divergence signals or other complex variables.

Falling wedge aka continued patternThe formation of any triangle is a direction indication relevant to where you find it as some can be a warning if reversal.
The market moves in grids(zones). Relevant to sentiment of traders and news. It always moves in wave 🌊 and in those waves we have patterns like ABCD resumption. Failure swings💰👃, 🐂 bullish breakouts, traps ECT.
The thing is impulsive moves is where you want to be even though it may be a correction. The thing with that is only with rising wedge patterns that are confirmed by long wicked 🔨 that indicate a move to the downside and this is like I said the day being under pressure from all the wicks formed by sellers and buyers showing no strength or news keeping it suppressed. This is your classic break and retest strategy. Like I said the money is in the trend and the impulses is always where you want to be mostly breakouts from levels continuing with the direction of the day - down to MN if you that good.
The SL of the pattern invalidates the idea and if any near term trails can be hit we get even better low entries. Remember your idea is only invalid when it doesn't hold weekly and MN TF key levels. This can also be seen by the RSI as it shows the strength of candlesticks relevant to highs and lows of the sessions.
Risk management is key especially if you have an account from 2$-100$. We only increase size when the accounts over 250-500$ which will give you a chance at playing 0.05 not saying it isn't possible at 70$ but you risk blowing it faster than a single 0.01 that just loses 1-5$ depending how the setup looks. If you feel like it won't work the SL should be 100 pips of not 10-50 pips which is 0.30cents to 0.72c$
Entry will be a breakout. And anything playing and rejected in that area can be waited for a signal to go long. Obviously if you don't have money to blow on risk like a 0.01 and lose 20$ in one go than don't. You risk smaller that's why we wait for lows or zone to enter example 0.01 and a lose of 2-4$. You can always trade gold with a small amount and turn it to a lot thing is it will kick you out if you dont take profits or secure them in positive SL of 1_5$
The TP is usually the inside of the pattern or the impulse before. Remember wave move in 5-1-2-3-4 and five.
2-correction can't be a triangle so it's usually rectangle
4- correction Triangle 📐 and it moves up
3-the largest impulse bigger than wave1-&5, but never small than 1
1impulse can be an extension (1-2-3-4-5 wave in wave one ),
5 can be the same as ones length
Now the thing about waves is the counting that gets difficult especially if the complex corrections. Therefore for m30, you play the day and if it doesn't hit one target or the second you positive SL and wait for better entries.
Gold can make you bank if you play it right, I mean risk manage your account to small losses and close large ones you can always enter again another place a ladder positions.
Please like if this education is helpful 🙏

Triangle Pattern Trading: A Trap for NewbiesThe triangle pattern is a popular chart pattern that is often used by technical analysts to identify potential breakout opportunities. However, traders should be aware that the triangle pattern can also be a trap for unsuspecting beginners.
Why the Triangle Pattern is a Trap
One of the reasons why the triangle pattern can be a trap is that it is a very subjective pattern. There are no hard and fast rules for identifying a triangle pattern, and what one trader might identify as a triangle pattern, another trader might not.
Another reason why the triangle pattern can be a trap is that it is a very common pattern. This means that there are many opportunities for traders to trade this pattern, which can lead to overtrading. Overtrading is a common problem for beginners, and it can lead to significant losses.
Smart Money Traders and the Triangle Pattern
Smart money traders are aware of the fact that the triangle pattern can be a trap for beginners. They will often use this pattern to their advantage by creating false breakouts and trapping beginner traders into losing positions.
Here are four examples of how smart money traders use the triangle pattern to trap beginners:
NEO: formed a bullish triangle pattern. However, the price broke out of the pattern in a fake breakout and then reversed sharply, trapping many beginner traders who were buying the breakout.
RVN: Rformed a symmetrical triangle pattern. The price broke out of the pattern in a fake breakout and then reversed sharply, trapping many beginner traders who were buying the breakout.
DYDX: formed a descending triangle pattern. The price broke out of the pattern in a fake breakout and then reversed sharply, trapping many beginner traders who were buying the breakout.
TRX: formed a bullish triangle pattern. However, the price broke out of the pattern in a fake breakout and then reversed sharply, trapping many beginner traders who were buying the breakout.
How to Avoid the Triangle Pattern Trap
There are a few things that traders can do to avoid the triangle pattern trap:
Be aware of the subjectivity of the pattern. There are no hard and fast rules for identifying a triangle pattern, so traders should be careful not to get too caught up in trying to identify this pattern.
Don't overtrade. The triangle pattern is a very common pattern, which means that there are many opportunities to trade this pattern. Traders should be careful not to overtrade this pattern, as this can lead to significant losses.
Be aware of smart money traders. Smart money traders will often use the triangle pattern to their advantage by creating false breakouts and trapping beginner traders into losing positions. Traders should be aware of this and be careful not to fall for these traps.
Conclusion
The triangle pattern can be a useful tool for identifying potential breakout opportunities. However, traders should be aware that this pattern can also be a trap. By understanding the reasons why the triangle pattern can be a trap, and by taking steps to avoid these traps, traders can protect themselves from significant losses.

Trading Converging Chart PatternsWe discussed identification and classification of different chart patterns and chart pattern extensions in our previous posts.
Algorithmic Identification of Chart Patterns
Flag and Pennant Chart Patterns
In this installment, we shift our focus towards the practical trading strategies applicable to a select group of these patterns. Acknowledging that a universal trading rule cannot apply to all patterns, we narrow our examination to those of the converging variety.
We will specifically address the following converging patterns:
Rising Wedge (Converging Type)
Falling Wedge (Converging Type)
Converging Triangle
Rising Triangle (Converging Type)
Falling Triangle (Converging Type)
This selection will guide our discussion on how to approach these patterns from a trading perspective.
🎲 Historical Bias and General Perception
Each pattern we've discussed carries a historical sentiment that is widely regarded as a guideline for trading. Before we delve into our specific trading strategies, it's crucial to understand these historical sentiments and the general market interpretations associated with them.
🟡 The Dynamics of Contracting Wedge Patterns
Contracting Wedge patterns are typically indicative of the Elliott Wave Structure's diagonal waves, potentially marking either the beginning or conclusion of these waves. A contracting wedge within a leading diagonal may experience a brief retracement before the trend resumes. Conversely, if found in an ending diagonal, it could signal the termination of wave 5 or C, possibly hinting at a significant trend reversal.
The prevailing view suggests that these patterns usually precede a short-term directional shift: Rising Wedges are seen as bearish signals, while Falling Wedges are interpreted as bullish. It's essential to consider the trend prior to the formation of these patterns, as it significantly aids in determining their context within the Elliott Wave cycles, specifically identifying them as part of waves 1, A, 5, or C.
For an in-depth exploration, refer to our detailed analysis in Decoding Wedge Patterns
🎯 Rising Wedge (Converging Type)
The Rising Wedge pattern, historically viewed with a bearish bias, suggests that a downward trend is more likely upon a breakout below its lower trend line. This perception positions the pattern as a signal for traders to consider bearish positions once the price breaks through this critical support.
🎯 Falling Wedge (Converging Type)
The Falling Wedge pattern is traditionally seen through a bullish lens, indicating potential upward momentum when the price surpasses its upper trend line. This established viewpoint suggests initiating long positions as a strategic response to such a breakout, aligning with the pattern's optimistic forecast.
🟡 Contracting Triangle Patterns
Contracting Triangles, encompassing Converging, Ascending, and Descending Triangles, are particularly noteworthy when they appear as part of the Elliott Wave's B or 2 waves. These patterns typically signal a continuation of the pre-existing trend that preceded the triangle's formation. This principle also underpins the Pennant Pattern, which emerges following an impulse wave, indicating a pause before the trend's resumption.
🎲 Alternate Way of Looking into Converging Patterns
Main issue with historical perception are:
There is no clear back testing data to prove whether the general perception is correct or more profitable.
Elliott Waves concepts are very much subjective and can be often difficult for beginners and misleading even for experts.
So, the alternative way is to treat all the converging patterns equally and devise a method to trade using a universal way. This allows us to back test our thesis and be definitive about the profitability of these patterns.
Here are our simple steps to devise and test a converging pattern based strategy.
Consider all converging patterns as bidirectional. Meaning, they can be traded on either side. Thus chose to trade based on the breakout. If the price beaks up, then trade long and if the price breaks down, then trade short.
For each direction, define criteria for entry, stop, target prices and also an invalidation price at which the trade is ignored even without entry.
Backtest and Forward test the strategy and collect data with respect to win ratio, risk reward and profit factor to understand the profitability of patterns and the methodology.
Now, let's break it further down.
🟡 Defining The Pattern Trade Conditions
Measure the ending distance between the trend line pairs and set breakout points above and beyond the convergence zone.
🎯 Entry Points - These can be formed on either side of the convergence zone. Adding a small buffer on top of the convergence zone is ideal for setting the entry points of converging patterns.
Formula for Entry can be:
Long Entry Price = Top + (Top - Bottom) X Entry Ratio
Short Entry Price = Bottom - (Top-Bottom) X Entry Ratio
Whereas Top refers to the upper side of the convergence zone and bottom refers to the lower side of the convergence zone. Entry Ratio is the buffer ratio to apply on top of the convergence zone to get entry points.
🎯 Stop Price - Long entry can act as stop for short orders and the short entry can act as stop price for long orders. However, this is not mandatory and different logic for stops can be applied for both sides.
Formula for Stop Can be
Long Stop Price = Bottom - (Top - Bottom) X Stop Ratio
Short Stop Price = Top + (Top - Bottom) X Stop Ratio
🎯 Target Price - It is always good to set targets based on desired risk reward ratio. That means, the target should always depend on the distance between entry and stop price.
The general formula for Target can be:
Target Price = Entry + (Entry-Stop) X Risk Reward
🎯 Invalidation Price - Invalidation price is a level where the trade direction for a particular pattern needs to be ignored or invalidated. This price need to be beyond stop price. In general, trade is closed when a pattern hits invalidation price.
Formula for Invalidation price is the same as that of Stop Price, but Invalidation Ratio is more than that of Stop Ratio
Long Invalidation Price = Bottom - (Top - Bottom) X Invalidation Ratio
Short Invalidation Price = Top + (Top - Bottom) X Invalidation Ratio
🟡 Back Test and Forward Test and Measure the Profit Factor
It is important to perform sufficient testing to understand the profitability of the strategy before using them on the live trades. Use multiple timeframes and symbols to perform a series of back tests and forward tests, and collect as much data as possible on the historical outcomes of the strategy.
Profit Factor of the strategy can be calculated by using a simple formula
Profit Factor = (Wins/Losses) X Risk Reward
🟡 Use Filters and Different Combinations
Filters will help us in filtering out noise and trade only the selective patterns. The filters can include a simple logic such as trade long only if price is above 200 SMA and trade short only if price is below 200 SMA. Or it can be as complex as looking into the divergence signals or other complex variables.
