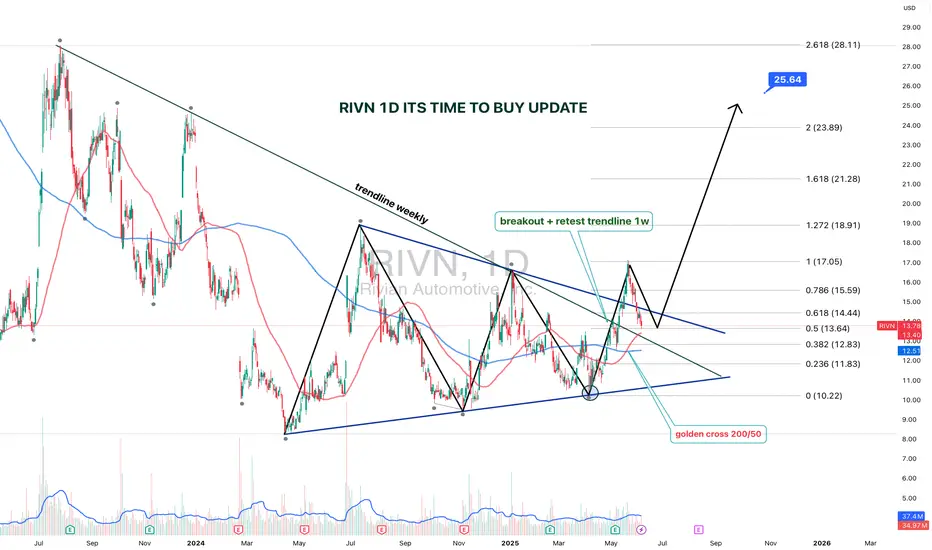
RIVN 1D — It’s Time to Buy: Setup UpdateThe setup on Rivian (RIVN) just got upgraded from “interesting” to “strategically significant.” We’re looking at a textbook symmetrical triangle that’s been developing since July 2023, with a clean breakout and retest on the weekly trendline.
The breakout was followed by a bullish retest, right at the intersection of the triangle base and the key trendline. Volume kicked in, price held — and that’s what smart money calls confirmation.
Now, the Golden Cross is live: the 50-day MA just crossed the 200-day MA from below. Price is confidently holding above both — momentum is shifting hard. Fibs from the bottom (10.22) to the last local top (17.05) project the first target at $17, and the extended Fibonacci confluence gives us $25.64 as a long-range goal (2.618 extension).
The weekly trendline — which acted as resistance for over a year — has flipped to support. Price action respects it, bulls are loading, and structure is clean.
This is not just a bounce. It’s a technical rotation from accumulation to expansion.
The time to talk about potential is over — price action has spoken.
Triangle
Dow Jones: Pressure Builds for a Topside BreakCoiling within an ascending triangle just beneath record highs, Dow Jones Industrial Average traders should be on alert for a potential bullish breakout.
The slingshot price action of recent days has delivered an obvious bullish message, with the three-candle morning star pattern completed on Monday proving prescient in signalling what was to come. Now trading just below 48,000—a level it’s struggled to overcome over the past month—we’re approaching what could be a key moment for medium-term directional risks. With the ascending triangle spanning thousands of points, a clean topside break could trigger significant upside.
With RSI (14) sitting above 50 but not yet overbought, upside pressure is strengthening. MACD is confirming, having staged a bullish crossover in positive territory earlier this week. The ducks are lining up for a potential bullish breakout.
Should we see a clean break above 48,000, longs could be established above the former highs with a stop beneath for protection. Unless we see a close above that level, the preference would be to wait for a pullback, test and bounce from the former highs using a shorter timeframe before entry.
While convention suggests a breakout from the triangle could eventually see the price trade north of 50,000, implying that could be a target, others may prefer to take their cues to exit from price action should an obvious topping signal or pattern emerge.
Even though a topside break is favoured, if the bullish move continues to stall around 48,000, there’s scope to flip the setup, allowing for shorts to be placed beneath the level with a stop above the highs, targeting 47,400 or the October uptrend. This screens as a lower-probability play given recent price and momentum signals despite previous success for shorts around these levels.
Good luck,
DS

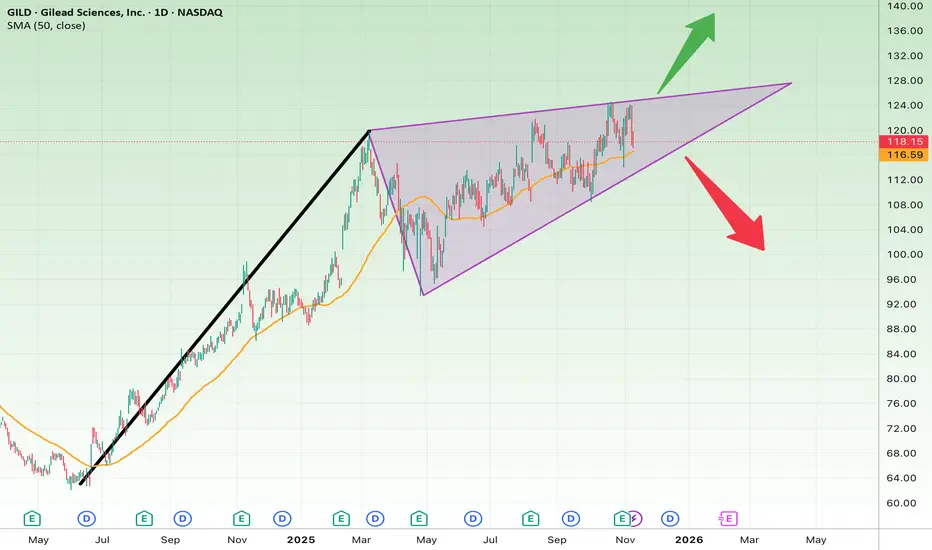
Tight Triangle Formation — GILD Ready for a BreakoutOn the daily chart, GILD is forming an ascending triangle, a bullish continuation pattern that often precedes a breakout move. The stock has rallied from around $75 to $125 and is now consolidating within a tightening range.
The 50-day SMA (around $114) is providing dynamic support.
Short-Term View (1–3 weeks):
• As long as price holds above $113, the bullish bias remains valid.
• A breakout above $122 would confirm upward momentum.
• Short-term target: $128–$132
• Stop-loss: below $112
Long-Term View (2–6 months):
• A confirmed breakout could lead to a strong continuation toward $135–$140.
• A breakdown below $113, however, may trigger a correction toward $104 or even $95.
Summary:
GILD is nearing the apex of its ascending triangle — a decisive move is coming soon. A breakout above $122 could unleash the next bullish leg, while a drop below $113 would shift control to the bears.
Double top after ascending triangle: 163$ will be retestedDouble top occurred at COINBASE:BTCUSD and at $COINBASE:SOLUSD. 163$ will be retested. I think we will see a bounce from there.

Silver Tries a Comeback but It Could Depend on the ShutdownSilver is contracting within a triangle-like pattern. After the sharp selloff, it managed to find some balance above the 47.60–47.80 zone and has since regained the 200 SMA on the 60-minute timeframe.
Liquidity constraints tied to QT and the US government shutdown are creating downward pressure on precious metals. These factors are likely to ease once the shutdown and QT end, and the market may start pricing that in early, potentially leading to renewed bullish momentum in the coming days.
The 49.30 level is likely to serve as the trigger for upward movement. Until that resistance breaks, it’s best to remain cautious.

Gold’s Calm Before the Storm – Triangle Ending Soon!Over the past 10 days , many traders—especially those working on 15-minute and higher timeframes—might have found Gold a bit tedious as it's been somewhat range-bound.
Right now, Gold ( OANDA:XAUUSD ) is sitting in a Support zone($4,004 – $3,895) and is also relatively close to a Resistance zone($4,046 – $4,004) .
From a Classical Technical Analysis standpoint on the 1-hour timeframe, it looks like gold has formed a Symmetrical Triangle and it's currently moving near the upper line of this triangle. Additionally, there's a small ascending channel that has formed over the last couple of days, which is something to keep in mind.
In terms of Elliott Wave theory, Gold might be forming a Contracting Triangle that could be completed by the time it finishes wave E.
I expect that Gold may decline at least to the lower line of the symmetrical triangle in the coming hours. If it breaks that lower line , we might see further downside and a clearer direction for gold’s main movement. Otherwise, it could bounce again.
Second Target: $3,913
Stop Loss(SL): $4,04(Worst)
Please respect each other's ideas and express them politely if you agree or disagree.
Gold Analyze (XAUUSD), 1-hour time frame.
Be sure to follow the updated ideas.
Do not forget to put a Stop loss for your positions (For every position you want to open).
Please follow your strategy; this is just my idea, and I will gladly see your ideas in this post.
Please do not forget the ✅ ' like ' ✅ button 🙏😊 & Share it with your friends; thanks, and Trade safe.

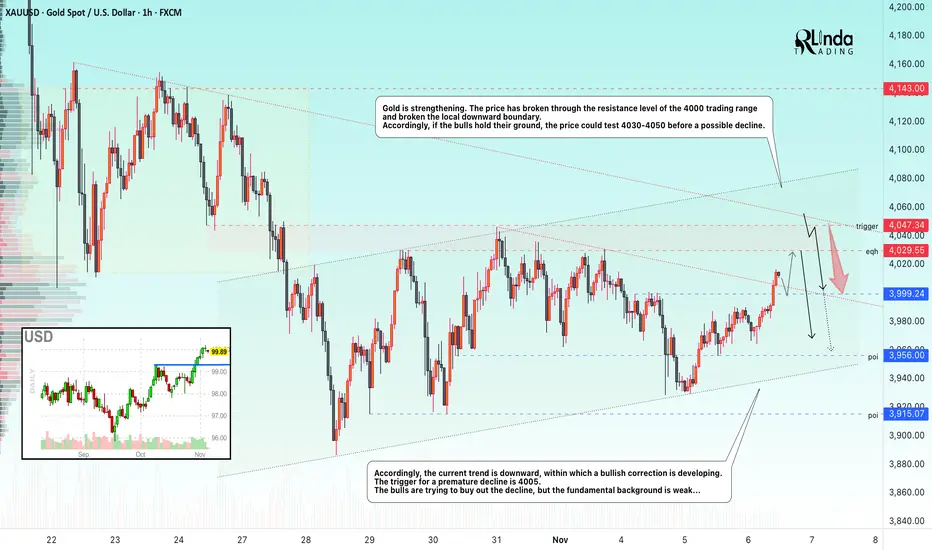
GOLD → False breakout of resistance after a rally...FX:XAUUSD is emerging from consolidation and entering a distribution phase. Spot metal is testing the 4085 mark, facing strong resistance amid progress in ending the US shutdown and weak economic data...
The US Senate has approved a funding bill, but the process takes time (voting in the House of Representatives and Trump's signature).
China: Gold ETFs rose 164% in the first nine months of 2025.
The People's Bank of China has been increasing its reserves for the 11th consecutive month (to 2,303.5 tons).
However, China's temporary easing of trade restrictions (exports of rare metals) supported risk-on sentiment. The probability of a Fed rate cut in December is estimated at 66%.
Technically, we have bullish signals, but after strong growth, there may be a pullback...
Resistance levels: 4085, 4100
Support levels: 4050, 4046, 4030
Gold is testing resistance as part of its bullish run, which is temporarily halting its strong growth. The market may lack the potential to break through resistance, and in order to build up this potential, the price may form a pullback or consolidation...
Best regards, R. Linda!

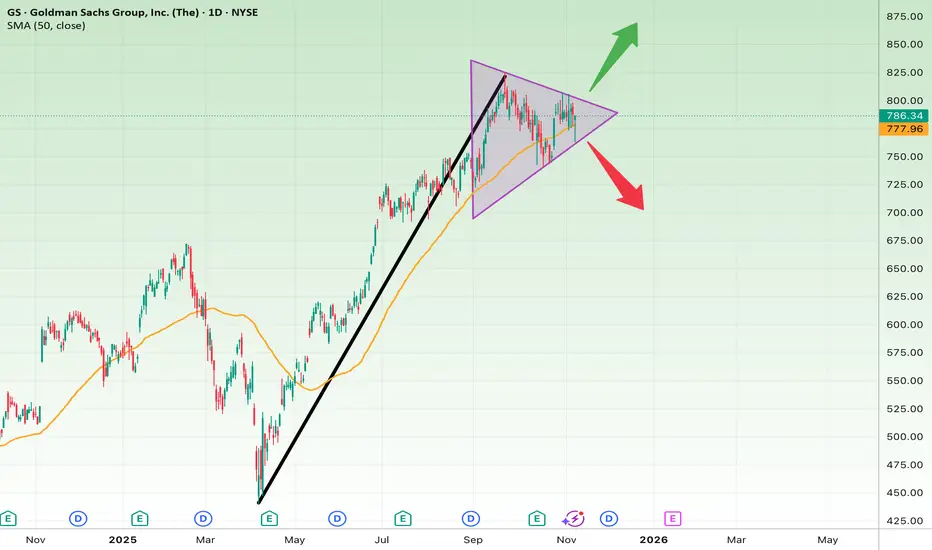
Calm Before the Storm for Goldman SachsAfter a strong rally from around $525 to near $820, GS has entered a symmetrical triangle consolidation pattern. This type of formation often signals that a major move is coming once the breakout direction is confirmed.
The 50-day SMA (currently around $778) is acting as dynamic support.
Short-Term View (1–3 weeks):
• A confirmed breakout above the descending trendline (~$800) would signal bullish continuation.
• Short-term target: $830–$850
• Stop-loss: below $770
Long-Term View (1–3 months):
• A breakout to the upside would likely extend the prior uptrend.
• Long-term target: $900–$940
• A breakdown below $760 could trigger a correction toward $700 or even $650.
Summary:
GS is coiling within a key triangle — a breakout will likely define the next big move. Bulls are watching $800, while bears are eyeing $760 for confirmation.
GOLD → Gold within the trading range...FX:XAUUSD is consolidating amid a pullback in the dollar and in anticipation of stronger key data as a driver for movement. Focus on the current trading range
On Friday, before the close of the session, the market formed a short squeeze, a strange volatility without news. It is important to monitor the Asian and European sessions and price behavior within the current trading range.
Earlier, we saw the dollar rise along with gold, indicating the strength of the metal and interest from the bulls. Let's assume that this situation has not yet run its course. In that case, after Friday's short squeeze, I expect MM to test liquidity in the 3985-3964 zone before a possible attempt to grow. Support from the upward channel may also affect the price. I still consider 4030 to be an important resistance level. If the bulls manage to break this barrier and keep the price above this level, gold will be able to end its correction and move into a growth phase. Otherwise, the market will tend to break out of the current consolidation downwards...
Resistance levels: 4020, 4030 - 4050
Support levels: 3985, 3963, 3931
Technically, while the price is within the trading range, it is worth considering trading relative to its boundaries. The fundamental background during the weekend is difficult to assess, so we will need to watch the situation during the European session...
Best regards, R. Linda!

Ether Breakout ImminentWith the Bitcoin testing the key trend, Trump's team start to talk about crypto, a lot. I think the ones who needed to buy the dip has finished their jobs. After that a sudden momentum to end shutdown begins but first attempts failed thus far. But the change of dynamics are clear and it could be positive for crypto and metals.
I will bet on upward breakout for Ether, and please check the BTC idea as well:

Ascending triangle formed!I think that an uptrend has become inevitable from here. 158$ marks our new support for Solana (BTCUSD already marked it).
We will again see some retracement at 175$. When we breakout of the big descending channel , a way higher price becomes inevitable too. I’m sure that the big cup and handle pattern can still playout (see linked idea).

Silver, bullish or bearish?Bullish divergence in RSI, an ascending triangle, and a moving average, combined with hitting the neckline, all these indications make Silver a good candidate for a Bullish rally that can reap a 1:3 RRR.

Bajaj Finserv Potential BuyNifty Service Sector is in our favour (following W pattern).
Bajaj Finserv seems to be bouncing off from 50 EMA and following the W pattern of Nifty Service Sector.
It also seems to give breakout from the apparent ascending triangle.

BTC soon to rally?In the 4h chart, BTC is showing a bullish divergence, which can lead to a good bullish rally IF the 4h candle closes above the 104k mark.

Visa breaking lower? Bearish
- several head and shoulder set ups potentially setting up,
- initial 6% down stretching to 15%
- Price moves lower to closed the gap
- If the gap is closed it suggests a H&S pattern present
If the H&S pattern triggers possible down side of 50% from here,
In covid 2020 times it fell 38%
In 2007/8 times it fell 50%
If VISA is disrupted by blockchain or crypto and we get a bear it could move its price back to the lows of 2008 which represent a 97% reduction in price
I guess if you are an employee of VISA with share options or dependant on them for your families money or pension. May be smart not to expose yourself and family to this level of risk.
If you are an executive working there pull your finger out and save your company please.
I am only reading the chart and I am pretty good at it. As of today I do not have a position here but will be looking to target a short position and will build it up and look to close it out in several years time.

GOLD → The battle for the $4,000 zone. Are the bulls here?FX:XAUUSD is gradually recovering. The price is breaking through $4,000 and trying to stay above the key psychological level. Focus on 4,030–4,050...
Weak employment data, namely a sharp increase in layoffs in October, has heightened fears of an economic slowdown, a decline in government bond yields, and the ongoing correction of AI assets is fueling demand for safe havens.
The probability of a Fed rate cut in December has risen to 69%. The situation is stabilizing somewhat, there is no strong news today, and the market may try to maintain the current backdrop...
Gold retains its upside potential while macro risks remain. The $4000 level is currently acting as key support. Closing the week above this mark will open the way to test $4050.
Resistance levels: 4030 - 4050
Support levels: 4000, 3975, 3956
The dollar and gold are rising, and the inverse correlation is decreasing, indicating that bulls are still trying to keep the market from falling sharply. However, given the lack of drivers, strong news, and a clear fundamental backdrop, I would say that gold is not yet ready to break out of its current range. Consolidation above 4K could lead to a retest of 4030-4050, which in turn could trigger a pullback to local support.
Best regards, R. Linda!

Gold and Silver Uptrends: Still Intact?Gold and silver had powerful rallies in recent months, and some traders may see further upside.
The first pattern on today’s chart of silver is the ascending triangle since October 28. That’s a potentially bullish continuation pattern.
Second, OANDA:XAGUSD is pushing back above its 8- and 21-day exponential moving averages. That may be consistent with a positive trend in the short term.
Third, Wilder’s Relative Strength Index (RSI) peaked in overbought territory above 85 in mid-October. It pulled back and stabilized above 40, which may suggest upward momentum remains intact.
Gold also bottomed on October 28, finding support at a weekly close from October 3. The yellow metal has proceeded to make higher lows since then.
Next, OANDA:XAUUSD is inching back toward $4,000. Returning above that psychologically important level could also boost sentiment.
TradeStation has, for decades, advanced the trading industry, providing access to stocks, options and futures. If you're born to trade, we could be for you. See our Overview for more.
Past performance, whether actual or indicated by historical tests of strategies, is no guarantee of future performance or success. There is a possibility that you may sustain a loss equal to or greater than your entire investment regardless of which asset class you trade (equities, options or futures); therefore, you should not invest or risk money that you cannot afford to lose. Online trading is not suitable for all investors. View the document titled Characteristics and Risks of Standardized Options at www.TradeStation.com . Before trading any asset class, customers must read the relevant risk disclosure statements on www.TradeStation.com . System access and trade placement and execution may be delayed or fail due to market volatility and volume, quote delays, system and software errors, Internet traffic, outages and other factors.
Securities and futures trading is offered to self-directed customers by TradeStation Securities, Inc., a broker-dealer registered with the Securities and Exchange Commission and a futures commission merchant licensed with the Commodity Futures Trading Commission). TradeStation Securities is a member of the Financial Industry Regulatory Authority, the National Futures Association, and a number of exchanges.
TradeStation Securities, Inc. and TradeStation Technologies, Inc. are each wholly owned subsidiaries of TradeStation Group, Inc., both operating, and providing products and services, under the TradeStation brand and trademark. When applying for, or purchasing, accounts, subscriptions, products and services, it is important that you know which company you will be dealing with. Visit www.TradeStation.com for further important information explaining what this means.

Xau/Usd - Ascending Triangle At Key Resistance Price is currently testing a strong resistance zone around 4008–4010, while maintaining support along an ascending trendline. The structure suggests a potential breakout setup:
Bullish Scenario: A confirmed breakout above resistance could signal continuation toward the 4040–4060 target zone.
Bearish Scenario: A rejection at resistance and a break below the trendline support could lead to a pullback toward 3960.
Watch for clear candle confirmations before entering a trade.

Bullish divergence at 4hHaving a bullish divergence, ASTERUSDT may shoot for 2.0 on the BTC bullish trend (4h chart). Entry would be around 1.3 (when breaking the neckline of previous LH), SL at 1.023, and TP at 2.05

Potential Downside Risk in Crude Oil Crude oil futures have been limping for more than a year, and some traders could think they’re ready to falter.
The first pattern on today’s chart is the series of lower highs since June. The 50-day simple moving average (SMA) has also remained below the 200-day SMA. Those signals may be consistent with a longer-term downtrend.
Second, you have another series of lower highs since October 24. CL1! has stayed above the October 23 low of $59.64 in that time, resulting in a potentially bearish descending triangle.
Third, traders may eye the April 9 low of 55.12 if the triangle breaks.
Finally, stochastics recently hit an overbought condition and are now turning lower.
TradeStation has, for decades, advanced the trading industry, providing access to stocks, options and futures. If you're born to trade, we could be for you. See our Overview for more.
Past performance, whether actual or indicated by historical tests of strategies, is no guarantee of future performance or success. There is a possibility that you may sustain a loss equal to or greater than your entire investment regardless of which asset class you trade (equities, options or futures); therefore, you should not invest or risk money that you cannot afford to lose. Online trading is not suitable for all investors. View the document titled Characteristics and Risks of Standardized Options at www.TradeStation.com . Before trading any asset class, customers must read the relevant risk disclosure statements on www.TradeStation.com . System access and trade placement and execution may be delayed or fail due to market volatility and volume, quote delays, system and software errors, Internet traffic, outages and other factors.
Securities and futures trading is offered to self-directed customers by TradeStation Securities, Inc., a broker-dealer registered with the Securities and Exchange Commission and a futures commission merchant licensed with the Commodity Futures Trading Commission). TradeStation Securities is a member of the Financial Industry Regulatory Authority, the National Futures Association, and a number of exchanges.
TradeStation Securities, Inc. and TradeStation Technologies, Inc. are each wholly owned subsidiaries of TradeStation Group, Inc., both operating, and providing products and services, under the TradeStation brand and trademark. When applying for, or purchasing, accounts, subscriptions, products and services, it is important that you know which company you will be dealing with. Visit www.TradeStation.com for further important information explaining what this means.

GOLD → The market is trying to buy back the decline...FX:XAUUSD continues to consolidate in the $4000 zone, failing to develop a rebound in the middle of the week. The price remains in a sideways trend for the eighth day in a row, waiting for a driver that will finally move the price forward...
Reasons for market restraint:
Strong US data: growth in ADP private employment, growth in the ISM services business activity index, lower odds of Fed easing, the probability of which has fallen to 62% for December...
However, the ongoing government shutdown and the delay in employment and inflation data are supporting the metal...
Gold is looking for new catalysts. A break above $4030-$4050 will require weak US data or an escalation of risks, which is not currently the case.
Resistance levels: 4030, 4050
Support levels: 4000, 3967, 3955
As the specified resistance is reached, the potential for further growth may be exhausted, and in this case, a false breakout could lead to a correction to 4K. However, if support does not hold the decline, this phase could last much longer. I am not yet talking about further growth beyond 4050, as the fundamental background is weak and there has been no reaction to this zone yet, since the price is still far from the level...
Best regards, R. Linda!
EURJPY → Long squeeze before growth FX:EURJPY is forming a long squeeze and a false breakdown of support amid a sharp decline. The trend is bullish, and buyers may enter the game against the backdrop of a weak yen.
The Japanese yen is falling, giving way to the euro, which is strengthening against this backdrop.
EURJPY is forming a global uptrend, which may generally support price growth...
The currency pair is returning to its trading range after a false breakdown of support. If the bulls hold their ground above 176.600, the price may form an upward momentum.
Resistance levels: 176.6, 177.0, 177.34
Support levels: 176.37, 176. 3
The market is trying to buy back the sharp decline, and the price is returning to the long zone, forming a reversal pattern. If the bulls hold the price above the support of the trading range, the market will have a chance to grow.
Best regards, R. Linda!

ETHUSDT → Breakdown of the global trend. Distribution to 3360BINANCE:ETHUSDT is entering a distribution phase after breakdown of a consolidation formed against the backdrop of a bearish trend (correction). Sentiment, like the fundamental background, is changing...
Bitcoin is falling, which is putting pressure on the market. The reasons are weak fundamentals, index correction, and the rise of the dollar (outflow of funds from the market). On the daily ETH timeframe, we see a break in the uptrend. Monday's candle closed below the trend line, and since the opening of the session, the price has rallied (panic???)
Ethereum is coming out of consolidation (breakthrough of 3671). A distribution phase is forming, directed towards 3366 (liquidity pool). Technically, a false breakdown of support could trigger a pullback to 3600 (retest of the previously broken upward support line).
Support levels: 3366, 3150, 3000
Resistance levels: 3600, 3670, 3916
Despite the breakdown of the trend structure, we have strong support ahead. If the bulls hold 3366, the market may form a wider trading range. But if the overall background does not change, the decline may continue after the correction...
Best regards, R. Linda!
