GOLD (XAU/USD): Bulls Eye $4,125 – Breakout Imminent?Gold dropped to a significant horizontal support level last week.
The price subsequently rebounded from this level, forming a rising triangle pattern on a 4-hour timeframe.
The neckline of this triangle is defined by an intraday horizontal resistance.
Its bullish violation (4H candle close above) can be a nice trigger to buy Gold with a confirmation.
Should this occur, a bullish continuation towards 4125 would be anticipated.
Conversely, a bearish movement and a break below the vertical support level could potentially lead to a further decline in price.
Triangle

EURGBP → Breaking through resistance provokes distribution FX:EURGBP is updating its high as part of a rally triggered by a breakout of consolidation resistance amid a bullish trend
The currency pair is in a phase of a confident uptrend (D1), with consolidation forming in the form of a bullish pattern, which generally indicates the strength of the buyer.
After breaking through the resistance of the “ascending triangle” consolidation, the currency pair is updating its high to 0.8818 and forming a double top, which is provoking a correction. Before rising, the price may test support.
Resistance levels: 0.8786, 0.8818
Support levels: 0.8752, 0.8721
The correction may bring the price to the break-even zone (breakout area). Liquidity capture will shift the imbalance towards buyers, which may trigger a continuation of the upward movement.
Best regards, R. Linda!

LINKUSDT → A trap? Grabbing liquidity before the fall...BINANCE:LINKUSDT is forming a correction after a bearish run. A false breakdown of support is triggering a correction before a possible continuation of the decline.
The coin is testing the support of the trading range within the downtrend. The reaction to the false breakdown of support is a pullback to the zone of interest. After a strong downward distribution, a correction to the break-even zone is forming. A false breakout of resistance at 17.45 could trigger a continuation of the decline due to a weak market and a liquidity pool formed above 17.450, which is likely to stop the pullback on the bearish trend.
Resistance levels: 17.450
Support levels: 16.53, 15.77
The downtrend may continue. A retest of resistance may end in a fall and an update of the local minimum, as well as reaching the zone of interest at 15.77.
Best regards, R. Linda!

SL smashed on the BTCUSDT SHORT PositionSL got smashed on the setup. Looks like the 4hr Ascending Triangle Chart Pattern wasn't powerful enough to force the move.

Gold Congestion: Clear Levels, Unclear DirectionAfter forming a local low at 3887 last week — a level perfectly aligned with the October ATH area — OANDA:XAUUSD started to recover from the recent 5k pips decline, retesting the 4050 resistance zone, which previously acted as strong support.
Since mid-last week, price action has entered a consolidation phase. Despite high intraday volatility, the structure is beginning to compress into a clear congestion pattern.
This range, roughly 1k pips wide, provides traders with well-defined reference points:
- Support: 3950–3960 zone – a break below this area would likely reopen the path toward the recent 3887 low.
- Resistance: 4040–4050 zone – a confirmed breakout above could trigger a continuation toward 4150.
At this stage, I am slightly bullish, given the sharp rejections from 3920 last week and the emerging ascending triangle structure, which often precedes upward continuation.
Still, confirmation is required — the market must decide whether this congestion is accumulation or distribution.

TWLO - Downtrend line BROKEN!TWLO - CURRENT PRICE : 134.88
The chart shared here is the weekly chart, where TWLO broke above its downtrend line with strong volume — a signal of growing bullish momentum. On the daily chart, TWLO formed a rising window (gap-up) last Friday — a bullish signal that often indicates strong buying momentum and potential continuation of the uptrend.
From a pattern analysis perspective, some traders may interpret the current setup as a bullish symmetrical triangle, indicating potential continuation to the upside. Next target will be 154.00 and 174.00. Support level is 114.73 (the low of window area based on daily chart).
ENTRY PRICE : 132.00 - 135.00
FIRST TARGET : 154.00
SECOND TARGET : 174.00
SUPPORT : 114.73 (CUTLOSS below this level on closing basis)

Possible LONG on BTCUSDTI just spotted a 4hr Ascending Triangle Chart Pattern and Powerful Bullish Engulfing Candlestick Pattern. My Prediction is a BUY. What do you think?

AUDUSD Retest of An Ascending Triangle.Price formed an ascending Triangle with rising higher lows and break of Resistance level at (0.65351 - 0.65204).
Price later retested Resistance of the Ascending Triangle and formed double bottom a bullish reversal pattern.

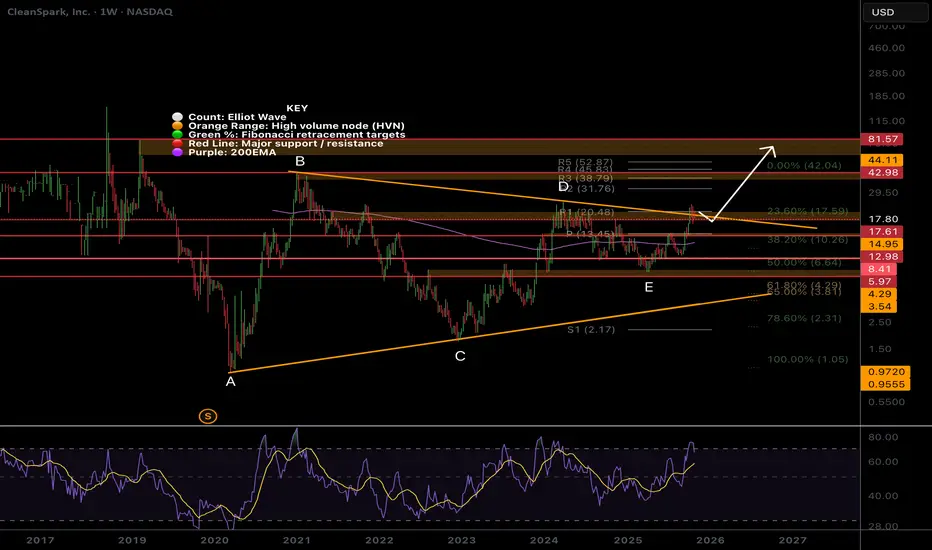
CLSK, Still much higher to goTheres a lot of fear in my comments across platforms due to the candle sizes. Participants need to understand the volatility of their holdings or face repeated mistakes and stress due to fear.
Price is attempting to breakout of the macro triangle upper boundary but was rejected. Breaking above wave D at $24 is key to trigger the next thrust I’m looking for towards $42 then $80 all time High Volume Node. Triangles are penultimate patterns found before a final strong move.
Price has momentum above the weekly pivot 200EMA but currently trapped in a High Volume Node where we expect price to stall before continuing upwards.
🎯 Terminal target for the business cycle could see prices hit $80- the all time High Volume Node
📈 Weekly RSI is oversold with no divergence and can remain here for months as price keeps increasing.
👉 Analysis is invalidated below wave E, keeping the triangle alive
GOLD → Consolidation. The fundamental backdrop is changing...FX:XAUUSD stabilizes after a week-long decline, failing to consolidate above $4050. The market is taking a pause before new impulses. Focus on 4030 and 3980...
Investors are closing positions before the end of the week and month, the reason being the uncertainty surrounding the deal with China and Powell's less dovish stance on policy: a 25 bp rate cut is already priced in. The probability of a December cut has fallen to 72.8% (from 91.1% a week ago). Powell emphasized that decisions depend on data, which is not available due to the shutdown.
The strong dollar (2-month highs) is putting pressure on gold. Weak data from China (PMI fell to 49.0) is reducing demand from the largest consumer.
The balance is tipping towards weak fundamentals...
Resistance levels: 4030, 4085
Support levels: 3982, 3955, 3915
Technically, bears are keeping the market below 4030 - strong resistance. If buyers enter the market (there are currently no fundamental reasons for this) and the bulls are able to break through 4030 and keep the price above this level, we will have a chance for growth. But under the current circumstances, I expect a correction to support before a possible rise.
Best regards, R. Linda!

Breakout ScenarioXRP ist moving in a triangle formation and might have completed the bottom formation of the wave 2 at the 78,6 Fib level
Breakout could be possible in a wave 3 to 1,618 fib or 2,618 fib levels in a impulsive wave 3
Wave 4 and 5 already marked but depends of coure of and if wave 3 is happening.

USDJPY → Attempt to break through trend resistance FX:USDJPY breaks through the resistance of the bullish pattern and attempts to remain in the long zone. There is a possibility of price growth against the backdrop of the dollar's rise following Powell's speech.
The dollar is recovering after the Fed meeting, and against this backdrop, the Japanese yen is losing ground, breaking through resistance at 153.23. The currency pair is trying to capitalize on the chance for growth.
The Japanese yen is forming a breakout of the resistance of a bullish pattern: an ascending triangle + consolidation on a bullish trend.
If buyers keep the price above 153.23, the market will have a chance to grow to 154.7.
Resistance levels: 153.23, 154.7
Support levels: 151.85, 152.37
On D1, the currency pair is trying to overcome the resistance of a multi-month downward correction. Locally, on H1, there is a breakout of the bullish pattern structure, which indicates interest from buyers. The chances of growth from 153 will appear if the price consolidates above the specified level.
Best regards, R. Linda!

Thomas Scott Ltd - Symmetrical Triangle Breakout - Weekly📊 Thomas Scott (India) Ltd – Symmetrical Triangle Breakout on Weekly Chart 🔺
📅 Chart Date: October 26, 2025 | Timeframe: Weekly
📈 CMP: ₹364.05 (+16.93%)
📍 Symbol: NSE:THOMASCOTT
🔍 Technical Overview
📉 Pattern: Symmetrical Triangle
Price has been consolidating within a contracting triangle pattern since February 2024, showing a gradual squeeze in volatility.
This week’s strong bullish candle with +16.9% move and above-average volume indicates a potential breakout attempt from the upper trendline.
💥 Volume Confirmation (🔊)
Volume rose sharply to 277.4K, much higher than the recent average of 189.8K, supporting the breakout strength.
📈 Next Resistance Zone: ₹415–₹430 (previous supply area).
📉 Immediate Support: ₹330 (triangle breakout zone).
🎯 Trading Plan (for Educational Purpose)
Entry (on Retest): ₹335–₹345 zone
Stoploss: ₹295 (Weekly Close Basis)
Targets: ₹415 / ₹475 / ₹525
Risk–Reward: ~1:2.5
⚠️ Disclaimer
This analysis is for educational and charting purposes only, not financial advice. Always do your own research before investing or trading.

Griffain is looking goodGriffain is looking good, with a huge potential of 40% returns. Right now it is trading in a descending triangle. Being a low supply token, it can easily jump to the target.
Not a Financial Advice

DWARIKESH SUGARSDwarikesh Sugar Industries Ltd. (currently trading near ₹44.86) – Overview Dwarikesh Sugar Industries Ltd., headquartered in Bijnor, Uttar Pradesh, is an integrated sugar manufacturer with operations across sugar production, power co-generation, and ethanol manufacturing. The company operates three plants with a combined crushing capacity of 21,500 TCD, a distillery capacity of 337.5 KL/day, and co-generation capacity of 91 MW (56 MW contracted to the grid). It has built a reputation for operational efficiency, rural engagement, and clean energy integration.
FY22–FY25 Snapshot
• Sales – ₹1,720 Cr → ₹1,980 Cr → ₹2,100 Cr → ₹2,250 Cr Growth driven by ethanol blending, power sales, and higher sugar realizations
• Net Profit – ₹140 Cr → ₹165 Cr → ₹185 Cr → ₹210 Cr Earnings supported by margin expansion, ethanol volumes, and scale efficiencies
• Operating Performance – Moderate → Strong → Strong → Strong EBITDA margins improving with ethanol mix and co-gen contribution
• Dividend Yield (%) – 1.10% → 1.20% → 1.25% → 1.30% Consistent payouts; reinvestment into distillery and green energy
• Equity Capital – ₹18.83 Cr (constant) No dilution; lean capital structure with strong promoter governance
• Total Debt – ₹320 Cr → ₹290 Cr → ₹260 Cr → ₹230 Cr Gradual deleveraging supported by internal accruals and ethanol cash flows
• Fixed Assets – ₹950 Cr → ₹980 Cr → ₹1,020 Cr → ₹1,060 Cr Capex focused on ethanol expansion, boiler upgrades, and automation
Institutional Interest & Ownership Trends Promoter holding stands at ~42.5%, with no pledging. FIIs and DIIs have selectively accumulated Dwarikesh citing ethanol scale, rural electrification, and sugar sector reforms. Delivery volumes reflect long-term positioning by agri, infra, and ESG-focused funds.
Business Growth Verdict Dwarikesh is scaling across ethanol, co-gen, and high-efficiency sugar production Margins improving via ethanol mix, power sales, and automation Debt is declining steadily with strong operating cash flows and policy tailwinds Capex supports long-term competitiveness in green energy and rural electrification
Management Highlights • FY25 ethanol volumes up 20% YoY; co-gen sales expanded to new state grids • QIP of ₹59.4 Cr successfully concluded; funds deployed for distillery expansion • FY26 Outlook: 8–10% revenue growth, margin retention, PAT expected to cross ₹230 Cr
Final Investment Verdict Dwarikesh Sugar Industries Ltd. offers a rural energy transformation story built on ethanol, co-gen, and efficient sugar production. Its improving profitability, disciplined capital structure, and clean energy integration make it suitable for accumulation by investors seeking exposure to India’s agri-infra and ethanol blending themes. With strong execution, policy alignment, and rural scale, Dwarikesh remains a durable value creator in the small-cap industrial space.

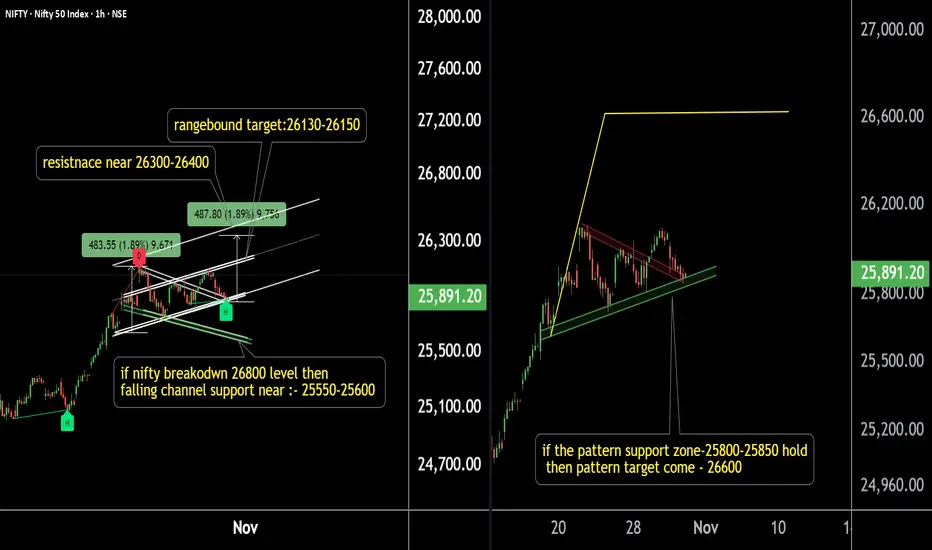
Nifty Key Levels on Radar — Crucial Zones to Watch This WeekNifty 50 – 1 Hour Timeframe Analysis
Nifty is currently showing strong support near the 25,800 zone.
If this level breaks, the next support can be seen around 25,550–25,600.
As per the current market structure, Nifty may first move in a range-bound phase, achieving initial targets around 26,150–26,180.
If the upward momentum continues, the next potential targets will be around 26,300–26,400 levels.
If the pattern support zone holds, then the pattern targets are likely to be achieved.
Thank you!
DOLLAR INDEX (DXY): More Growth Ahead
A quick follow-up for the yesterday's idea for Dollar Index.
The market successfully violated a resistance line of a symmetrical triangle
pattern on a daily time frame.
We see its retest this morning.
A confirmed bullish CHoCH on an hourly time frame gives us a strong
intraday bullish confirmation.
There is a high chance that the Index will continue rising.
Goal - 99.35
❤️Please, support my work with like, thank you!❤️
I am part of Trade Nation's Influencer program and receive a monthly fee for using their TradingView charts in my analysis.

Breakout in ENGINERSINBreakout in ENGINERSIN.
Entry - 206
Target - 250
SL - 196
DISCLAIMER: I am not SEBI registered and the ideas posted are only for educational purpose. Do a proper analysis and always trade with STOP LOSS.

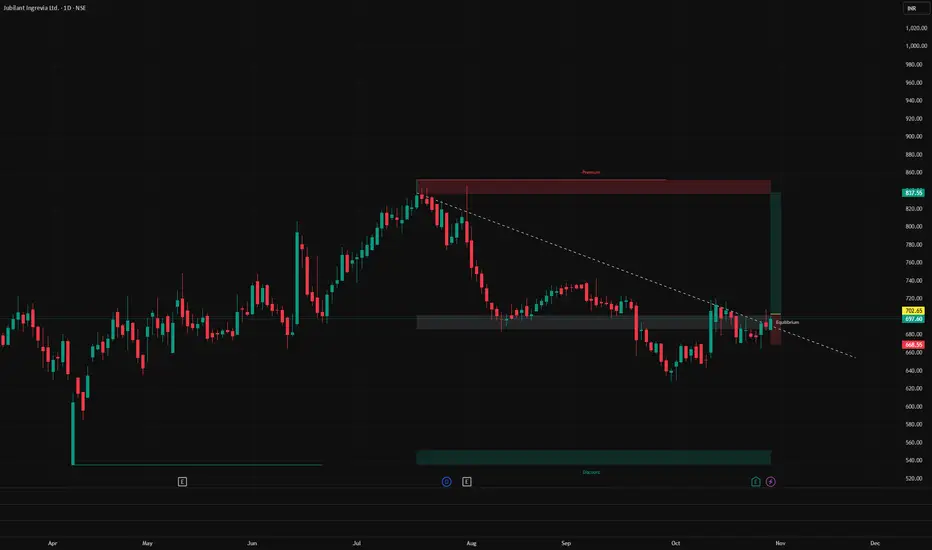
Breakout in JUBILANT INGREVIA.Breakout in JUBILANT INGREVIA.
Entry - 702
Target - 830
SL - 670
DISCLAIMER: I am not SEBI registered and the ideas posted are only for educational purpose. Do a proper analysis and always trade with STOP LOSS.
BTCUSDT Breakdown Ahead: Sellers Eye $108K SupportHello everyone, here is my breakdown of the current Bitcoin setup.
Market Analysis
BTCUSDT has been consolidating within a well-defined range, facing multiple rejections from the $121,700 Resistance Zone. After several failed breakout attempts above this area, the market shifted into a bearish phase, confirming sellers’ dominance. The structure now forms a descending triangle pattern, a classic bearish continuation signal. We can see multiple breakouts and retests throughout the move, with price respecting both the Triangle Resistance Line and Support Line. The most recent rejection from the upper boundary of the triangle shows that buyers are losing momentum, while sellers are gradually regaining control.
Currently, BTCUSDT is approaching the Triangle Support Zone around $110,000–$108,800, a crucial level where previous reactions occurred. A clean break below this support area could accelerate the downside move, confirming a continuation toward the lower Support Zone near $105,000–$103,000.
My Scenario & Strategy
In my view, BTC remains in a vulnerable technical position. If the price closes below the $108,800 level, this would likely trigger a fresh bearish impulse, leading to deeper declines. Until a confirmed breakout happens, short-term traders may look for retest entries after breakdowns for better risk-to-reward setups.
However, if BTC finds strong support and rebounds from this level, we could see a short-term correction toward $114,000–$116,000, which would act as a retest of the Triangle Resistance Line before further decline. For now, my bias remains bearish, expecting continuation to the downside as long as price stays below the $114,000–$116,000 resistance zone.
That's the setup I'm tracking. Thank you for your attention, and always manage your risk.


BCHUSDT → Consolidation ahead of news. Target 600?BINANCE:BCHUSDT.P is consolidating above key resistance. Consolidation is forming ahead of news. Are the bulls in play?
Bitcoin is consolidating, trading above key support at 111650. News ahead, a positive outcome could support the market, including altcoins...
As for BCHUSDT, the coin is breaking through the strong resistance zone of 549.15 as part of a bullish trend and is forming consolidation in the range of 549-570. A liquidity pool has formed below 549. There is a high probability of a long squeeze before growth.
Resistance levels: 570, 600, 612
Support levels: 549.15, 533, 511.25
The market is bullish, which is clearly visible on the D1 timeframe. After a strong rally, the coin is entering a consolidation phase, which is forming above the previously broken resistance. A retest of support could trigger growth in the direction of the trend.
Best regards, R. Linda!

Breakout in VAIBHAV GLOBALBreakout in VAIBHAV GLOBAL.
Entry - 239
Target - 265
SL - 228
DISCLAIMER: I am not SEBI registered and the ideas posted are only for educational purpose. Do a proper analysis and always trade with STOP LOSS.
