GOLD → A psychologically important level of $4,000 lies aheadFX:XAUUSD continues to correct, unable to consolidate above $4,100, with the 4K mark ahead. Pressure is intensifying due to hopes for a trade deal between the US and China, as well as profit-taking ahead of the Fed's decision on interest rates...
Key factors:
Progress in trade negotiations: the US has withdrawn the threat of 100% tariffs, and China may support the situation. Thursday's meeting between Trump and Xi Jinping increases the chances of a deal.
Bets on two rate cuts in 2024 are almost fully priced in. US inflation (3% y/y) was lower than forecast (3.1%), but did not change expectations.
The correction may continue if the positive backdrop for the trade deal remains. The Fed's decision on Wednesday will be a key catalyst.
Technically, the 4K zone is ahead, and it is too early to talk about a break of this support, as we do not know how the market will react. However, at the moment, the price is in the range of 4000-4163, and from a technical analysis point of view, it is logical to consider a false breakdown and a pullback.
Support levels: 4000, 3975, 3944
Resistance levels: 4060, 4090, 4163
As part of the decline, the market may test one of the specified zones: 4000, 3975, 3944. However, since a liquidity pool has formed below 4K, the reaction to the psychological support level may be aggressive. It is important to monitor the situation, as closing below 4K and consolidating below a strong level could trigger a further decline. Otherwise, if the bulls manage to hold their ground above 4K and bring the price back above 4050, the market may have a chance to grow.
Best regards, R. Linda!
Triangle

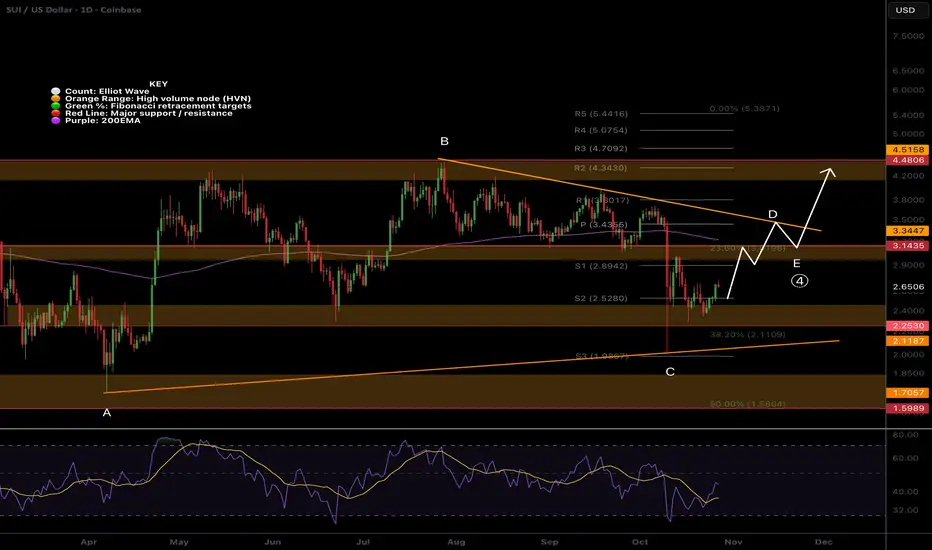
SUI remains in macro triangleNothing changed form last update, plan is playing out. Wave (c) of D is underway and should test the triangle upper boundary and find resistance at the High Volume Node along the way- $3.14.
Daily RSI hit oversold with no divergence. wave E is expected to be shallow
Safe trading
XRPUSDT → Pre-breakout base. Are the bulls back?BINANCE:XRPUSDT is attempting to break through the resistance of the trading range as part of a bullish run across the entire market. There is a chance that a breakthrough could form after a pullback...
The market is gradually buying back the liquidation that occurred on October 10. Bitcoin is breaking the structure, which indicates a possible return of the bulls. This sets a positive tone for the cryptocurrency market.
XRP is testing resistance and entering a consolidation phase. The trigger that could provoke growth is 2.661. However, as part of the consolidation, the market may test support before growth in order to hunt for liquidity.
Resistance levels: 2.661, 2.739
Support levels: 2.587, 2.547, 2.500
Since the opening of the session, the market has formed a fairly strong momentum, and at the beginning of the European trading session, a correction may form before the growth continues. As part of the correction, XRP may form a pullback to 2.587 - 2.500.
Best regards, R. Linda!

GOLD → Technical analysis of the current situation FX:XAUUSD is consolidating, and the daily market behavior pattern is not particularly positive, but it does have bullish implications. Market sentiment largely depends on the fundamental background
This week, the Fed is expected to hold a meeting on interest rates, where it will most likely decide to lower them, which could generally support the dollar (but this news is most likely already priced in). Accordingly, the rest depends on decisions regarding the shutdown, trade war, and inflation. The resolution of the first two issues may weaken the price.
As for the technical side, since the price is currently within the trading range, it is worth considering trading within these limits first. However, a breakout and closing above/below one of the key levels: 4060 - 4150 could trigger further movement in the direction of the breakout, which in turn could push the price into another (bearish or bullish) trading range. Below, there is the 4000 zone, and there is a possibility of a retest of this area, with a potentially aggressive reaction.
Resistance levels: 4150, 4218, 4275
Support levels: 4060, 4015, 3944
While uncertainty remains, the market may continue to hold the price between 4060 and 4150. Another retest of the range boundary and the reaction to this retest will show the market's intentions for further movement.
Best regards, R. Linda!

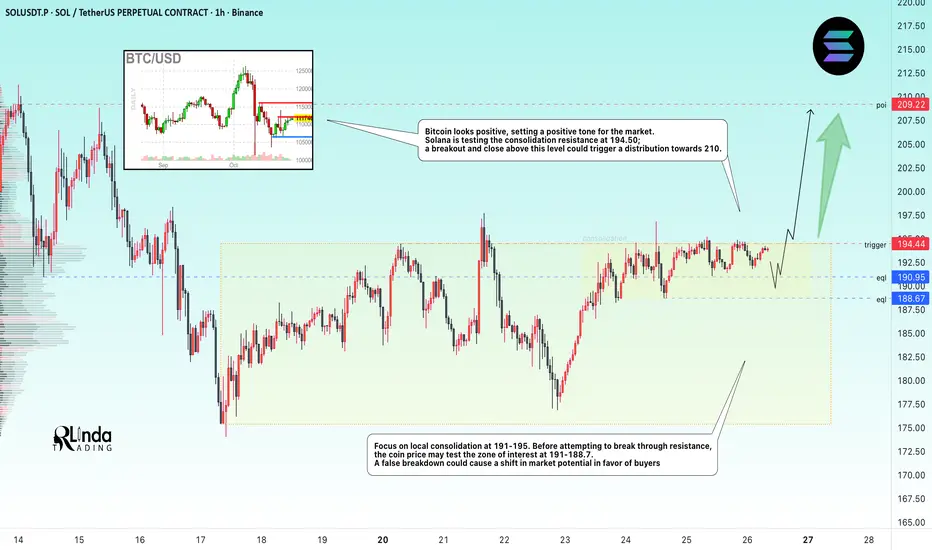
SOLANA → Consolidation before resistance. An attempt at growth?BINANCE:SOLUSDT.P is testing the resistance of the trading range, with pre-breakout consolidation forming, indicating that buyer interest in the coin is emerging.
Bitcoin looks positive, which sets a positive tone in the market. Solana is testing the resistance of consolidation at 194.50; a breakout and close above this level could trigger a distribution to 210.
Focus on local consolidation at 191-195. Before attempting to break through resistance, the coin price may test the zone of interest at 191 - 188.7. A false breakout could cause a shift in market potential in favor of the buyer, which in turn could trigger a breakout of 195 and growth.
Resistance levels: 194.5, 209
Support levels: 190.1, 188.7
A retest of resistance, consolidation after growth, and no reaction to bears are positive signs that a breakout attempt may be realized. A close above 194.5 - 195.0 would be a good sign for growth.
Sincerely, R. Linda!
waiting for the that meeting on wednesdayWhile the initial and most extreme volatility will likely occur Wednesday afternoon and potentially extend into Thursday.

Bitcoin Forms Head and Shoulders — Correction 107,500 in PlayHello traders! I’d like to share my view on the current market structure for Bitcoin. After a prolonged period of bullish momentum and multiple impulsive rallies, the market has entered a corrective phase. The price action has formed a clear Head and Shoulders pattern beneath the major resistance zone near 121,700, signaling growing selling pressure. Currently, BTC is trading within a short-term descending structure, staying below both the resistance line and the Seller Zone. The recent rejection from the right shoulder area confirms that sellers remain in control, and the market is now moving toward the Buyer Zone, located around 107,500.In my opinion, this movement represents a continuation of the ongoing correction rather than a full trend reversal. I expect the price to decline into the Buyer Zone, completing the right shoulder and reaching the TP1 target near 107,500. If the market finds strong support in this demand area and forms a confirmed reversal structure, it could mark the end of the corrective phase and initiate the next major bullish leg. A successful bounce from this level would open the way for a potential rally back toward the 114,000–115,000 resistance range.This setup provides a clear trading plan — I remain bearish in the short term, looking for a potential bullish reversal from the lower boundary of the structure. Please share this idea with your friends and click Boost 🚀

EURUSD – Range Retest Could Trigger New Sell WaveHello traders, I want to share my view on EURUSD. The market recently formed a descending wedge pattern after breaking down from the previous range structure, which dominated price action for a long time. The breakout from this wedge occurred after the pair reached the major support zone around 1.1560, triggering a minor upward correction. At the moment, the price is testing the lower boundary of the previous range, which has now turned into a strong resistance zone around 1.1660. This level coincides with the confluence of a horizontal resistance and the descending trendline, creating a potential supply area. Despite the small bullish reaction from support, the overall market sentiment remains bearish. Buyers have not shown sufficient momentum to push price above the resistance, suggesting that this movement is likely a corrective pullback within a broader downtrend. In my view, the 1.1660 area will act as a ceiling, and the pair is likely to resume its decline toward the 1.1560 demand zone. A confirmed rejection from this resistance could open the path for a new bearish leg, potentially targeting even lower levels if sellers maintain control. Please share this idea with your friends and click Boost 🚀

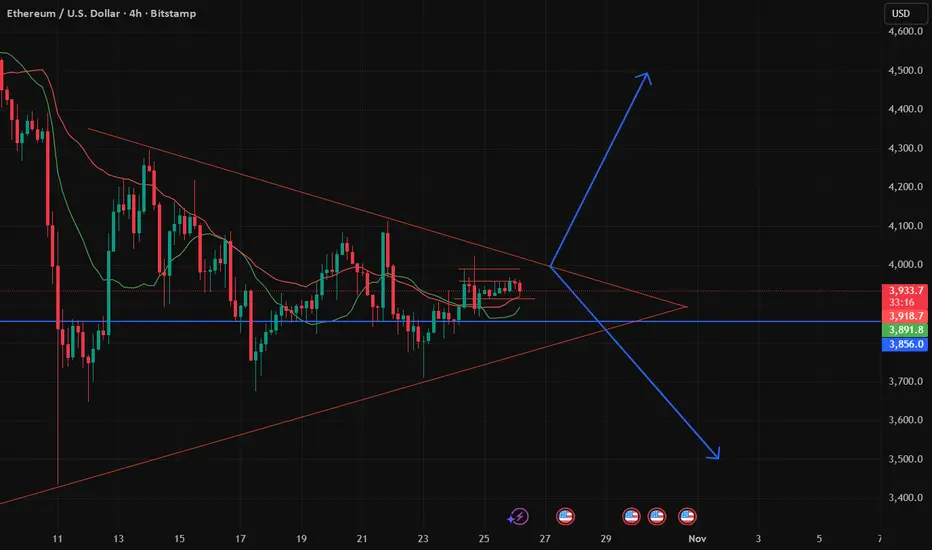
Ethereum (ETH) — Symmetrical Triangle Formation1. Validity of the pattern
A symmetrical triangle is a neutral continuation (or sometimes reversal) pattern: price makes lower highs and higher lows, squeezing into the apex.
Important for you: verify that each “touch” of the trendlines is clean (price reacts at the lines, shows rejection or bounce) — this gives the pattern structural credibility.
On the chart, “multiple clear reactions from both boundaries”.
Also note: the longer the duration of compression (here many weeks), the greater the potential breakout move. Good for you because you prefer swing trading supported by structure.
2. Entry strategy
For a bullish scenario: wait for confirmation of a breakout above ~$4,265. This could be for example a daily close above that trendline / resistance level, or a strong candlestick close + volume spike.
For a bearish scenario: wait for a confirmed breakdown below ~$3,640 (lower trendline + support) with follow-through.
Because you emphasise risk management: Place a stop‐loss maybe just outside the triangle boundary (above resistance for short, below support for long), depending on direction.
3. Risk/Reward & Targeting
The analyst’s target ~$4,720 (for the breakout) gives a potential ~10%+ move from ~$4,265. That’s decent for a swing.
On the downside, target ~$3,300 from ~$3,640 gives ~10%+ also.
For you: calculate your risk (distance to stop-loss) vs reward (distance to target) and only take the trade if the ratio is acceptable (e.g., 1:2 or better).
Given you also do scalping, you could also watch for a smaller move out of the triangle if the breakout slows, or for a retest of the breakout zone.
4. Context & confirmation
Patterns don’t always work. Use other confirmations: volume increase on breakout, maybe RSI divergence, or a candlestick structure (hammer, engulfing etc) at breakout.
Also consider macro / crypto‐market context: Are news, fundamentals, sentiment aligning with a bullish or bearish breakout?
Since you’re also into institutional footprints and liquidity zones: check if the breakout happens near a major liquidity level or order‐block; sometimes institutions will trap retail before the move.
5. Your action plan (for your “advanced path” mindset)
Mark the triangle on your charting software (e.g., MetaTrader 5 if you’re using it for crypto via feed, or a dedicated crypto charting platform).
Set alerts at ~$4,265 and ~$3,640 for price crossing these levels (you can add a buffer e.g., 1-2%).
Prepare two trade plans:
Plan-A (Bull): Entry after breakout above $4,265, stop-loss maybe ~$4,000 (for example), target ~$4,720 + beyond.
Plan-B (Bear): Entry after breakdown below $3,640, stop-loss maybe ~$3,800, target ~$3,300.
⚠️ Risks & caveats
Breakouts from triangles often see retests of the breakout line. Beware false breakouts (fakeouts).
Crypto markets (and especially ETH) can be volatile and news/whale moves can override chart structure. Always manage capital accordingly.
The triangular pattern suggests the range is narrowing: less room inside means bigger explosion once it exits — but also more risk of whipsaw.
As this is a self‐published chart by an analyst (not guaranteed) — always do your own research.
EURGBP Aiming For 2023 Highs Or 2024 Lows?!?Here on OANDA:EURGBP , Price has been ranging relatively closely for the past couple months which seems to have begun to form an Ascending Triangle underneath a potentially strong Resistance Zone that formed Fall of 2023!
Now Ascending Triangles, over time, continue to rise Price into an area of Resistance until which that zone can no longer hold the Buying Pressure building up underneath and leads to a Bullish Breakout of the Horizontal Resistance zone.
Once Validated, this Price Action can lead to Long Opportunities as a Breakout and Retest of that Resistance Zone to which traders will want to see if it turns Support!
Statistics also show that Triangle Patterns tend to fail 1/3 of the time, so we must also consider the possibility that the Selling Pressure that could be at the Horizontal Resistance Zone helping form the Ascending Triangle, could overcome Bulls, creating a False Breakout and push Price down using the Rising Support of the Ascending Triangle as a potential Shorting Opportunity.
Now both Scenarios have Price Targets at the next levels of Resistance or Support depending upon which way we get a Breakout!
**Waiting for a Valid Breakout of a pattern can raise the success rate immensely! Patience Pays.

GOLD → Retest 4060 within the range. What are the expectations?FX:XAUUSD is forming a correction from the Asian session, with the price testing the important 4060 zone ahead of two key events: US inflation data (CPI) and the results of US-China trade negotiations.
Key factors: US inflation (CPI): Low data will support gold (expectations of two cuts in 2024), but high figures will strengthen the USD and weaken gold (rates for a rate cut in December will decline).
Progress in negotiations between China and the US could weaken gold, while failure would bring back demand for safe havens. US sanctions against Russian oil are supporting oil prices and inflation expectations.
Gold is in wait-and-see mode. Growth is likely with weak CPI or a failure of negotiations. Strong CPI and progress in trade will reinforce the correction. The mood remains cautious ahead of events.
Resistance levels: 4090, 4150, 4163
Support levels: 4060, 4002
The important zone of 4060 - gold is forming a false breakdown. If the bulls hold their defense above this zone, it could trigger growth towards the resistance of the range. Otherwise, we can expect a retest of 4000K, and the reaction should be aggressive...
Best regards, R. Linda!

BITCOIN → Trend support broken. Consolidation...BINANCE:BTCUSDT.P is consolidating below the previously broken uptrend line. There are no clear signs of the correction ending or the presence of a strong bullish player. A retest of resistance is forming...
Bitcoin is forming a trading range of 111650 - 107377 (106270). There is no clear bullish pattern at the moment, and we are seeing a correction to resistance before a possible decline to the liquidity pool of 106270, which is formed by consolidation and a retest phase. There are two key zones ahead: 111650 and 113600. Resistance at 111650 has been confirmed, but if this zone does not hold the price, it will be necessary to monitor the upper boundary. A false breakout could trigger a pullback. The cryptocurrency market currently looks somewhat weak due to the phase of uncertainty and doubts about policy.
Resistance levels: 111650, 113600
Support levels: 108650, 107375, 106270
Market behavior indicates that a consolidation phase is currently developing within the local downtrend. A breakout of 113K and consolidation above 113500 could confirm a trend reversal, but there are no such signals at the moment. I consider a pullback to the zone of interest from resistance to be a priority.
Best regards, R. Linda!

CLSK, nothing changed, $40+ incoming, 2x minNASDAQ:CLSK is low cap asset and is prone to large volatile swing like we are seeing but also gives way to opportunities.
Price is attempting to breakout the macro triangle upper boundary was rejected at first. Breaking above wave D at $24 is key to trigger the thrust I'm looking for towards $42 and $80 all time High Volume Node after that.
Price has momentum above the weekly pivot 200EMA but currently trapped in a High Volume Node where we expect price to stall before continuing upwards.
RSI can stay in overbought for months.
Participants are still afraid of this asset coming against them and its volatility, a reflection of the broader sentiment of FEAR in retail that is still persisting at all time high. Ridiculous bear market PTSD.
A recipe for MUCH higher. until market wide confidence takes hold.
Safe trading

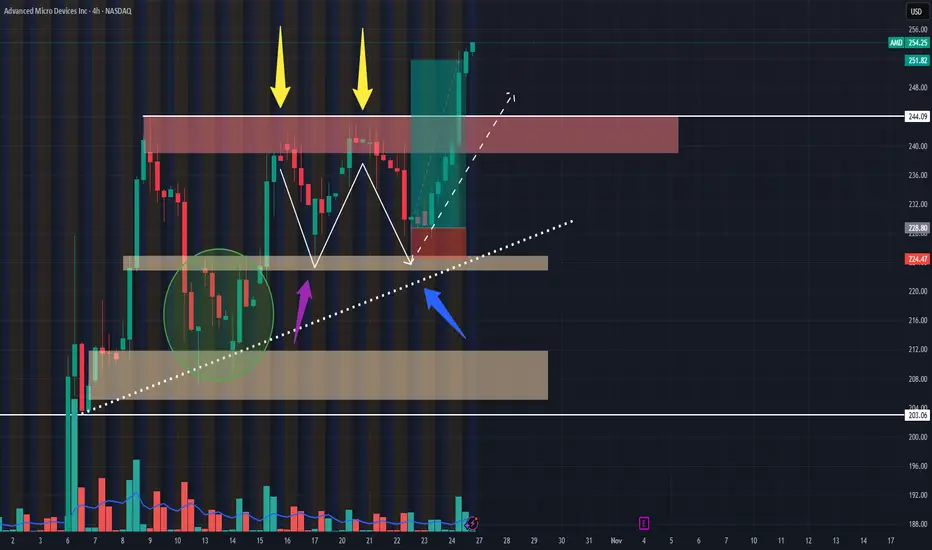
AMD Went Crazy!!! Post Trade Analysis 10/25/24Hello all,
This is my first time posting on here. So, please feel free to leave any questions, advice, or anything else in the comments!
I took this AMD swing trade on the 10/22/25 @ 2:12ish PM CST.
POSITION:
1 $300 Strike Call Exp Nov 7th 2025
Risk: $30 (price takes out low of hammer candle)
Initial PT: Previous highs (Red box) for $75 profit
Final PT: Actively managed since price moved past previous highs ($144 final profit)
WHY I TOOK THE TRADE
1. From the 7th-23rd AMD looked to be forming an ascending triangle pattern on the 1 day and 4HR timeframe.
2. AMD validated 2 support areas to me, which was an ascending support line (Blue arrow) and a demand zone from $222.92 to $225.11 (Purple arrow). In addition to this, price recently broke out from a W pattern (Green bubble) around 10/14 on the 1-4HR time frame (wish I saw it forming sooner lol), which confirmed to me that there was still momentum for the upside.
3. I saw that AMD was potentially forming another larger W pattern on the 1-4HR timeframes (Yellow arrows).
ENTRY Rules:
1. Measure Risk to Reward position, if less than 1.8 to 2.5 R/R, don't take the trade.
2. Wait for price to pull back to area of value (confirmed by multiple touch points.
3. Wait for a strong bullish candle to close 60% or above previous bearish candle (at the demand zone level), to confirm potential price reversal; then enter on the open of the very next candle.
4. Place SL where price invalidates analysis (below bullish hammer candle and demand zone), and PT at most recent highs (or actively manage if price pushes to the upside with momentum).
SUMMARY:
I am glad I took this trade, because it I am still relatively new to trading and I am improving on following my trade plan and TA more.
If anyone has any comments or feedback I would love to chat!
Thank you!
CHOLAFIN Breaking out of the ascending Triangle*CHOLAFIN* is breaking out of Ascending triangle and can be accumulated for Yearly investment. CMP 1733. Ideal entry 1650. Can be accumulated till 1550 if market reverses due to bad global relationships. *Target* 2295+ *Duration* Dec 2026
*Stoploss* 1400

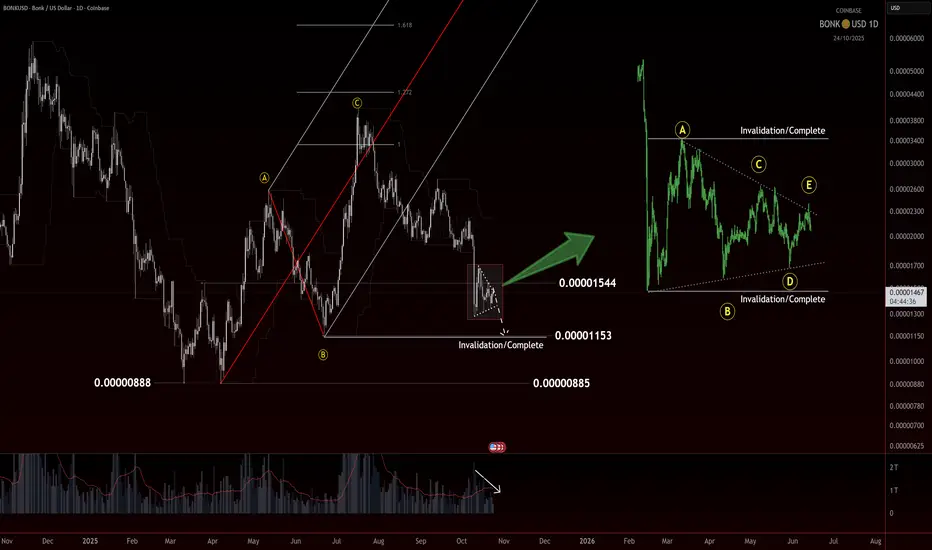
BONK: ALTsummers darling is dumping.BONK – One of the First Runner of #ALTSummer
BONK was one of the first tokens to blast off this summer, setting the pace for early alt momentum. It completed what looks like a clean five-wave impulse up, but now we’re seeing the market digest that move.
If the structure were still strongly bullish, we’d expect a simple internal retracement into the summer impulse before continuation. Instead, the current price action is drifting lower and looks ready to sweep the origin of that move. That tells us this may be more than just a pullback.
On the hard right edge, the structure is giving off triangle vibes. The range is tightening, volume is contracting, and the swings are overlapping. In Elliott Wave terms, a triangle is often the final pattern before the last move of a sequence. It’s the market coiling up before making its decision.
If this forms and finishes as a triangle, we can use it to anchor the count. A clean thrust and sweep of the pivot could trigger short-term upside and possibly close out the current leg. From there, the key question becomes whether that push is the start of something new or simply the last gasp before one more low.
For now, I’m watching how BONK handles this pattern. If it holds and breaks above the triangle invalidation, that would confirm a short-term bullish response. If it completes and breaks lower, the summer impulse is likely complete, and the next real opportunity will come from the base that forms afterward.
Trade safe, trade clarity.
TonyTalon
WLFI 1H$WLFI 1H Chart
WLFI forming a bullish flag pattern after a strong impulse move.
A breakout above the flag resistance could trigger continuation toward the $0.16–$0.17 target.
Invalidation below $0.13.
#WLFI #Crypto #TradingView

ENA 4HMIL:ENA 4H Chart
ENA is consolidating inside a symmetrical triangle, showing reduced volatility and potential buildup for a strong move.
Momentum indicators are turning bullish, suggesting a possible breakout to the upside if price can hold above the resistance line.
A confirmed breakout could target the $0.68–$0.70 zone, aligning with previous structure levels.
#Ethena #Crypto #PriceAction #TradingView

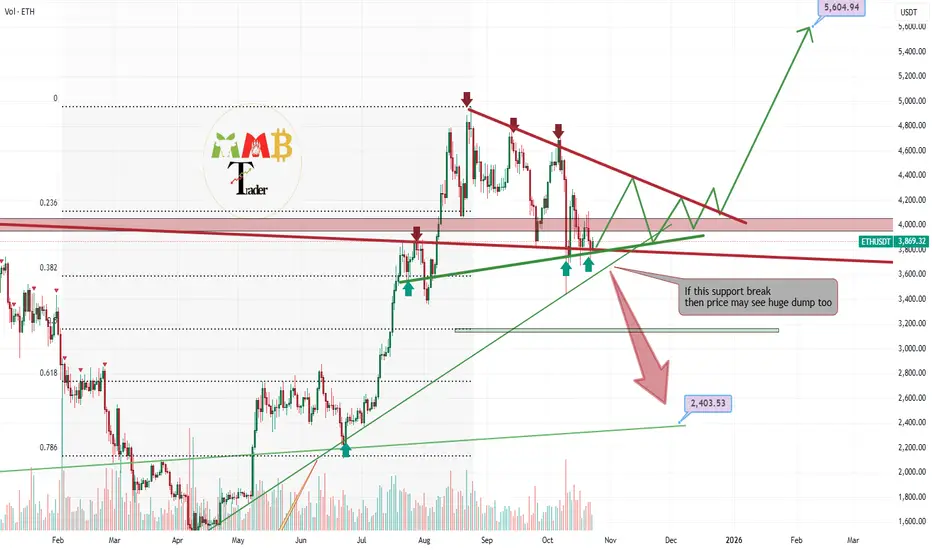
It is time for ETH To touch the moonEthereum has conclusively breached the major resistance of the descending trendline we previously identified on the weekly timeframe. The price has since retested this former resistance level twice, which has now held firm, confirming its new role as support. This successful conversion of resistance into support signifies a robust bullish shift in market structure. Consequently, the asset demonstrates strong momentum, indicating a high potential for a sustained and significant upward trend.
DISCLAIMER: ((trade based on your own decision))
<<press like👍 if you enjoy💚
GOLD → Fundamental background boosts interest FX:XAUUSD is recovering after a correction, trading in the range of 4060-4120 amid geopolitical tensions and risks of an escalating trade war.
Key supporting factors: New threats from the US against China, which is responding with additional measures. Trump imposed sanctions against Russian oil companies, accusing Moscow of lack of progress on Ukraine. US inflation data (CPI) on Friday may cause volatility, although the Fed's rate cut next week is likely already priced in.
The meeting between Trump and Xi Jinping next week remains uncertain.
Gold remains a safe haven, but near-term dynamics depend on the balance between dollar strength and geopolitical risks.
Resistance levels: 4116, 4163, 4200
Support levels: 4082, 4060, 4002
A retest of support at 4082-4060, as well as a breakout of resistance at 4116, could trigger a bullish reaction—a rise to the resistance level or imbalance zones. Against the backdrop of the escalating trade war, gold is becoming attractive again.
Best regards, R. Linda!

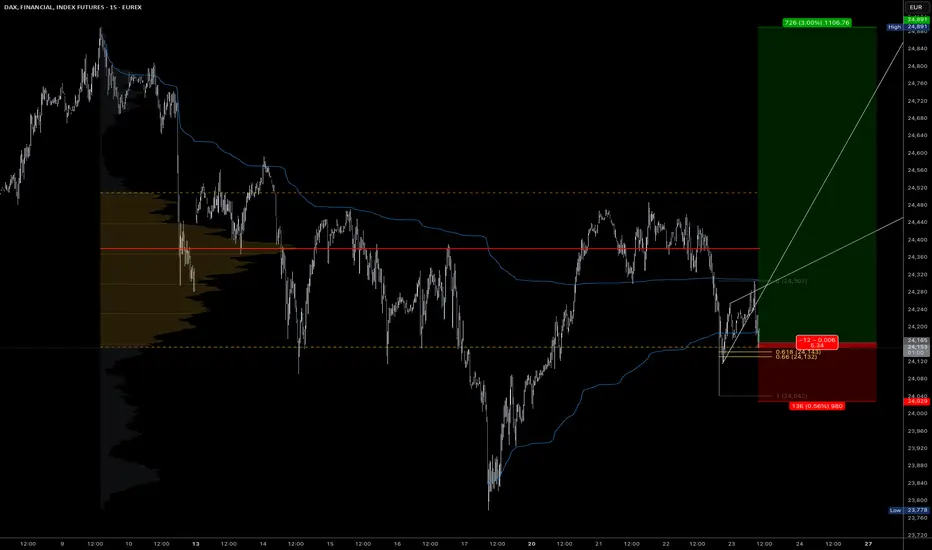
Fake-out of the triangle provided a long setupThis morning, we saw a clean fakeout of the triangle into the anchored VWAP from the all-time high, which provided a solid short opportunity.
Now, EUREX:FDAX1! is figthing to stay within the value area and ultimately push toward new all-time highs. However, there is significant resistance above, so remain cautious.
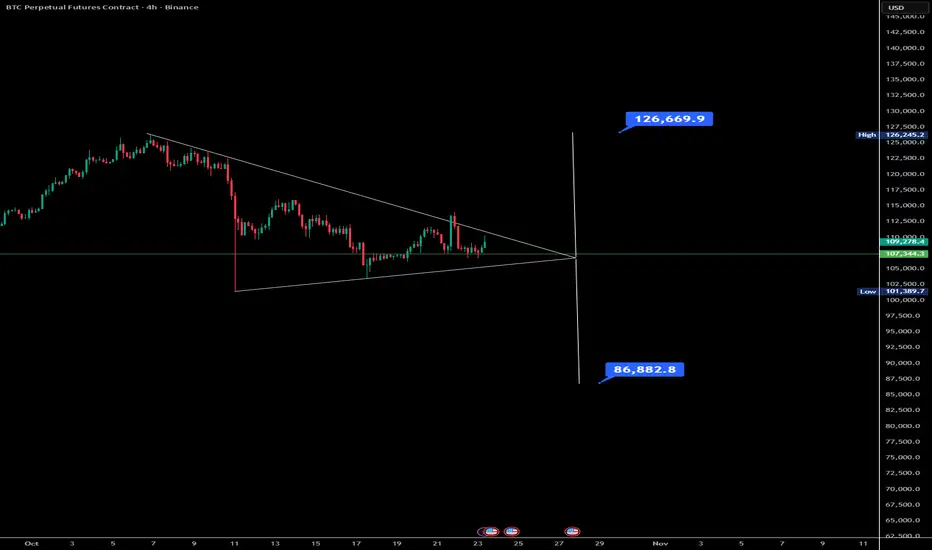
Bitcoin Symmetrical Triangle Breakdown Or Breakout SetupBitcoin sits inside a symmetrical triangle after making a lower low from its all-time high (~101K). The market now faces a binary outcome: break above for the ATH run, or break below for a deeper correction (~87-90K).
Bias: Slightly bearish tilt given distribution phase possibility and macro risk (CPI tomorrow). If you hold long, reduce risk or lock profits before CPI. If you trade the breakout/breakdown, wait for confirmation + volume.
Key Levels:
• Triangle upper break → target ~125K+
• Triangle lower break → target ~87-90K
• Keep stop-loss or hedge accordingly.
Macro trigger: US CPI release tomorrow; one of the largest risk events for crypto this week. Inflation surprise higher → Fed stays hawkish → risk assets (incl. BTC) under pressure. Inflation surprise lower → possible relief rally but distribution risk stays.
While upside remains possible, the safer assumption is that we’re in a distribution phase. Entry for new long positions should be cautious. Until triangle resolves, keep bet sizes moderate and manage risk.
EURCAD → Retest of liquidity pool before growth FX:EURCAD is forming a correction to the key liquidity zone amid a global and fairly strong bullish trend. Will the bulls enter the game in the 1.6173 zone?
The euro is forming a correction to the strong support zone of 1.16, which is provoking a decline in the currency pair. The key area that the currency pair is striving for is 1.6173. The trend is bullish. A reaction from the bulls is possible...
A false breakout of resistance is forming a correction. However, the price is still within the trading range of 1.64 - 1.6173. The price is heading towards support for a retest, and the indicated zone is likely to stop the correction...
Resistance levels: 1.633, 1.64
Support levels: 1.6173, 1.603
A liquidity pool below 1.62 - 1.617 could change the game in favor of buyers. Remember, the trend is bullish, and this will be a clear advantage for players. A false breakdown of support and the absence of a downward momentum could trigger growth.
Best regards, R. Linda!
