T-Mobile: Weak in a Strong Market?T-Mobile USA has limped as the broader market hits new highs, and now some traders may see downside signals emerging.
The first pattern on today’s chart is the gap lower on September 8. (The drop came after SpaceX’s Starlink purchased wireless spectrum licenses with plans to compete against carriers like TMUS.)
Second, the wireless company failed to rebound from the drop. That may suggest few investors saw an opportunity in the pullback.
Third, TMUS made a series of lower highs while closing above August 1’s weekly close of $237.20. However yesterday it seemed to break that descending triangle to the downside.
Next, recent consolidation below the 200-day simple moving average may suggest the long-term trend is growing more bearish.
Finally, MACD has been falling and the 8-day exponential moving average (EMA) is below the 21-day EMA. Those signals may reflect short-term bearishness.
TradeStation has, for decades, advanced the trading industry, providing access to stocks, options and futures. If you're born to trade, we could be for you. See our Overview for more.
Past performance, whether actual or indicated by historical tests of strategies, is no guarantee of future performance or success. There is a possibility that you may sustain a loss equal to or greater than your entire investment regardless of which asset class you trade (equities, options or futures); therefore, you should not invest or risk money that you cannot afford to lose. Online trading is not suitable for all investors. View the document titled Characteristics and Risks of Standardized Options at www.TradeStation.com . Before trading any asset class, customers must read the relevant risk disclosure statements on www.TradeStation.com . System access and trade placement and execution may be delayed or fail due to market volatility and volume, quote delays, system and software errors, Internet traffic, outages and other factors.
Securities and futures trading is offered to self-directed customers by TradeStation Securities, Inc., a broker-dealer registered with the Securities and Exchange Commission and a futures commission merchant licensed with the Commodity Futures Trading Commission). TradeStation Securities is a member of the Financial Industry Regulatory Authority, the National Futures Association, and a number of exchanges.
TradeStation Securities, Inc. and TradeStation Technologies, Inc. are each wholly owned subsidiaries of TradeStation Group, Inc., both operating, and providing products and services, under the TradeStation brand and trademark. When applying for, or purchasing, accounts, subscriptions, products and services, it is important that you know which company you will be dealing with. Visit www.TradeStation.com for further important information explaining what this means.
Triangle

Will Case A or Case B Play Out?"📉 The chart highlights a potential selling zone between 1.17670 – 1.18053, where sellers could dominate.
🔮 Two Scenarios Ahead:
Case A:
⬆️ Price extends higher, completing a 5-wave structure before meeting strong resistance.
💥 A reversal from the top zone could trigger a strong sell-off.
Case B:
⏳ Price faces an earlier rejection near current levels after a short corrective move.
🐻 Sellers step in sooner, pushing price toward the demand zone below.
⚖️ Question to you:
👉 Which scenario feels more likely — the wave completion & reversal (Case A) or the immediate rejection (Case B)?
✍️ Drop your analysis, trade plan, and seller zone insights in the comments ⬇️

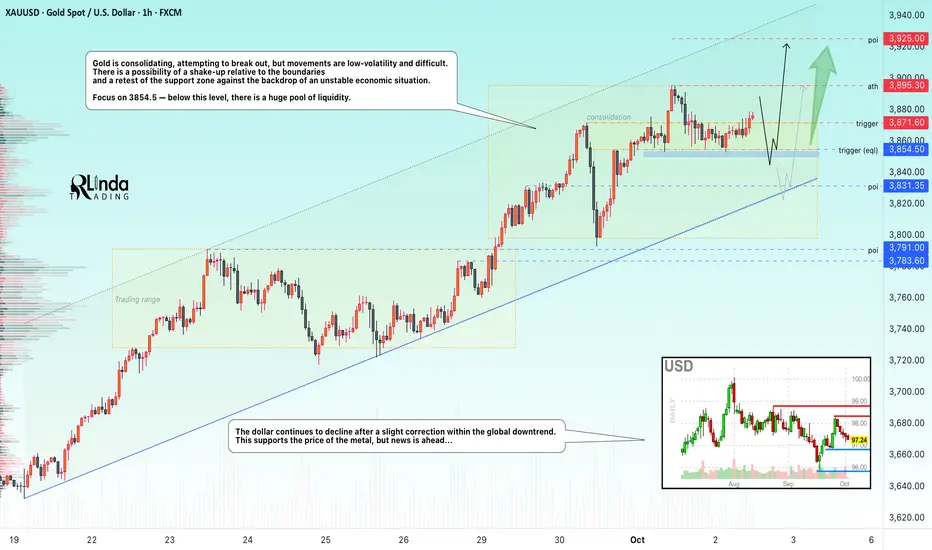
GOLD → Consolidation before growth FX:XAUUSD is correcting from 3895 and forming consolidation with a key support area at 3854, below which lies a huge pool of liquidity. A deep correction is unlikely due to ongoing risks.
The suspension of NFP publication due to the shutdown and inflation creates uncertainty for Fed policy, as does weak employment data...
However, the resumption of government work will allow the publication of data on unemployment claims and factory orders, so increased volatility in the markets is to be expected on Thursday/Friday...
The correction in gold is a temporary pause. As long as US fiscal risks, labor market weakness, and geopolitical tensions remain, the uptrend will remain intact. The $3850 level is the nearest support.
Resistance levels: 3871.6, 3895, 3900
Support levels: 3854.5, 3831.3
The most likely scenario at the moment is a long squeeze in the 3854.5 liquidity zone before continuing to rise beyond 3900...
Best regards, R. Linda!
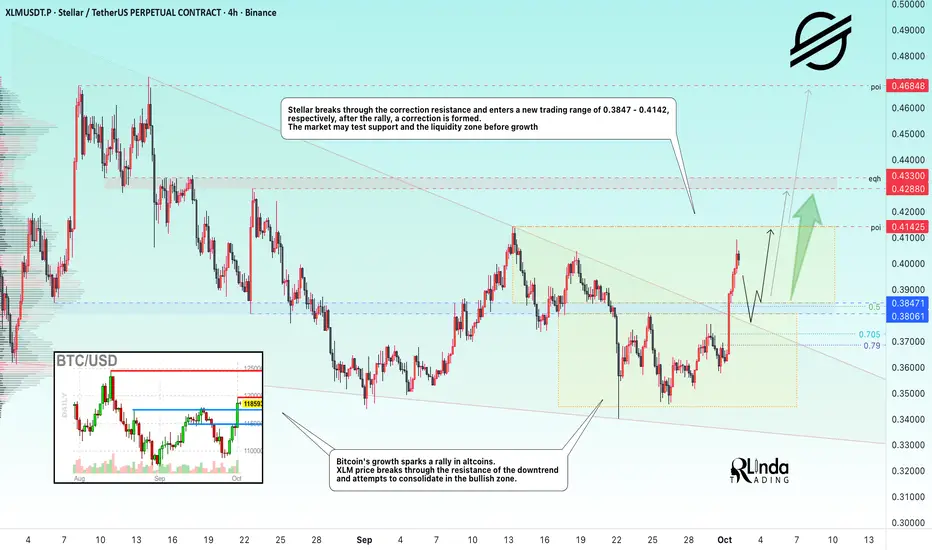
XLMUSDT → End of correction. One step away from a rally BINANCE:XLMUSDT follows the flagship currency in forming a rally and breaking out of the correction. The trend is bullish, but news is ahead. Will the bulls be able to keep the price above the risk zone?
Bitcoin's growth is provoking a rally in altcoins. The price of XLM is breaking through the resistance of the downtrend and trying to consolidate in the bullish zone.
Stellar is breaking through the resistance of the correction and entering a new trading range of 0.3847 - 0.4142, respectively, after the rally, a correction is forming. The market may test support and the liquidity zone before rising.
Resistance levels: 0.4142, 0.4288, 0.433
Support levels: 0.3847, 0.3806
As part of the correction, I expect a retest of the 1/2 zone of the formed impulse or the support zone of 0.385 (previously broken consolidation and descending wedge border).
If the bulls keep the price from falling even after the news, the coin may continue its medium-term bullish run to 0.4685.
Best regards, R. Linda!
GBPCAD breakout or rejection? All eyes on 1.8850!GBPCAD is testing a major technical zone as macro and price catalysts align. Here's what traders need to know:
Catalysts & Macro Drivers
GBP : Supported by USD weakness (US shutdown, weak data), sticky UK inflation, and Bank of England caution. November’s UK budget looms as a key event.
CAD : Under pressure from falling oil prices (oversupply/weak demand) and a dovish Bank of Canada. Further rate cuts are possible, especially if oil stays low.
Technical Outlook
Weekly chart : Strong impulsive rally past 61.8% Fibonacci (1.8310), with 1.9490 (78.6% Fib) as the next longer-term upside target.
4h chart : Ascending triangle with resistance at 1.8850. Breakout/close above 1.8850 confirms bullish momentum, with targets at 1.90 and then 1.93–1.95.
RSI : Long-term RSI above 60 signals strength, but divergence is a risk factor. Watch for RSI reset or failure at highs.
Trading Scenarios
Bullish : Hold above 1.8850 for 3 sessions +, look for upside extension to 1.90/1.93/1.95.
Bearish : Failure to break 1.8850 or drop below 1.8600 could trigger reversal to 1.84/1.81 support.
Levels to Watch
Key resistance: 1.8850, 1.9000, 1.9340, 1.9490
Key support: 1.8600, 1.8400, 1.8310
This content is not directed to residents of the EU or UK. Any opinions, news, research, analyses, prices or other information contained on this website is provided as general market commentary and does not constitute investment advice. ThinkMarkets will not accept liability for any loss or damage including, without limitation, to any loss of profit which may arise directly or indirectly from use of or reliance on such information.

XAUUSD Imperfect Descending Triangle - Price retested major support level at (3859.70-3853.36), Price formed an Imperfect descending triangle as it approaches support level.
*Wait for price to break descending triangle trendline for entry.

Bitcoin Wave Analysis – 30 September 2025- Bitcoin broke daily Triangle
- Likely to rise to resistance level 120000.00
Bitcoin cryptocurrency continues to rise strongly after the earlier breakout of the daily Triangle from the start of August.
The breakout of this Triangle accelerated the active short-term impulse wave 3 of the intermediate impulse wave (5) from the end of August.
Given the strong daily uptrend, Bitcoin cryptocurrency can be expected to rise to the next round resistance level 120000.00 – provided it breaks above the nearby resistance level 117570.00.

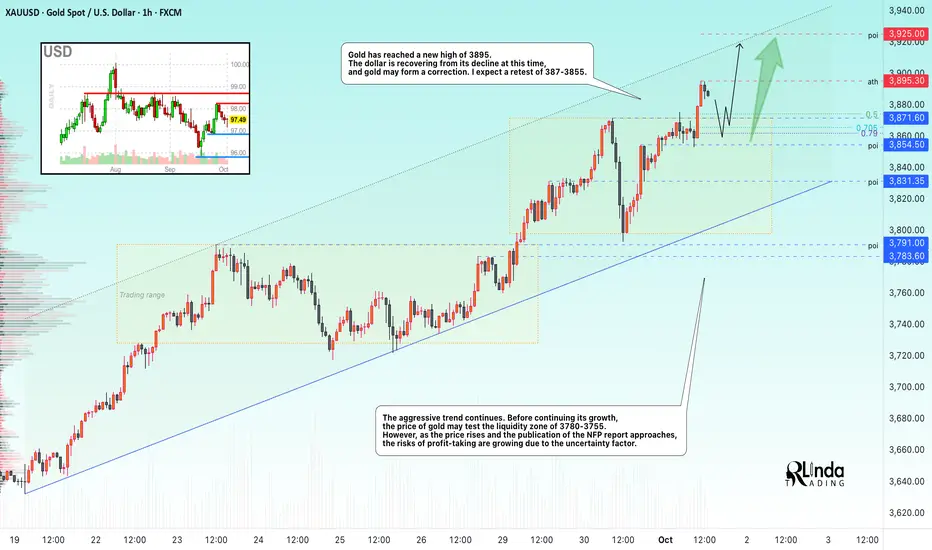
GOLD → Correction before growth and breakthrough of 3900...FX:XAUUSD has reached a new high of 3895. The dollar is recovering from its decline, and gold may form a correction. As prices rise, economic risks associated with NFP and the US government shutdown are increasing
The suspension of NFP publication deprives the Fed and markets of a key benchmark for the labor market, increasing demand for defensive assets. The probability of a rate cut in October is estimated at 100%. Mixed JOLTS data (weak hiring) and fiscal risks are weighing on the USD, which in turn supports gold.
Thus, the shutdown creates ideal conditions for gold to rise — uncertainty about Fed policy, a weaker dollar, and a flight to safety. Breaking through the $3900 level seems a likely scenario.
Resistance levels: 3900, 3925
Support levels: 3871, 3854, 3831
A correction is forming after a small rally in the European session. Before continuing its growth, the market is entering a correction/consolidation phase. I have indicated the key support levels on the chart. If the bulls manage to keep the price above these zones, then we can expect continued growth in the short and medium term
Best regards, R. Linda!
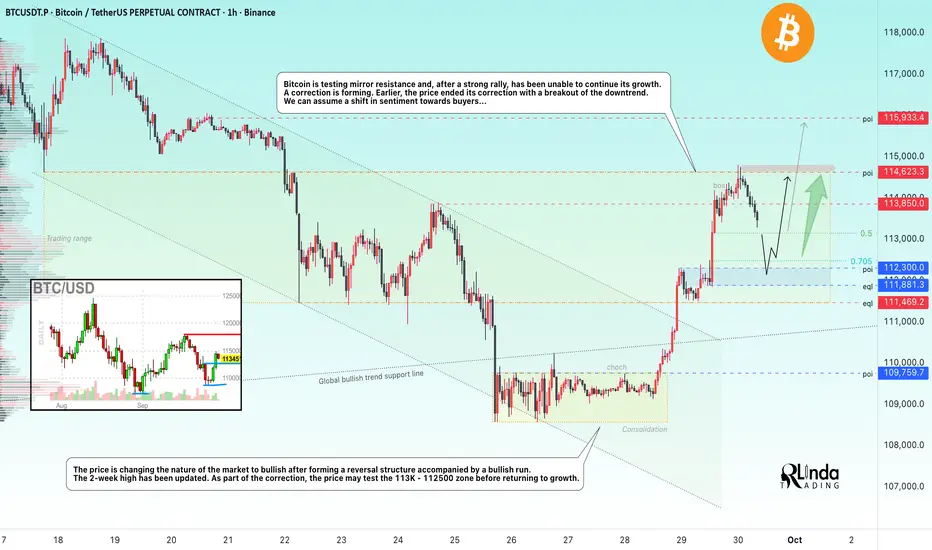
BITCOIN → Correction before the breakout of 114.5KBINANCE:BTCUSDT , after the end of the correction, is forming a 3.5% rally and testing the important milestone of 114,600. It was not possible to break through the level without consolidation and at such a high speed. How long will the correction last?
Bitcoin is testing mirror resistance and, after a strong rally, was unable to continue its growth. The reason for the halt is a huge liquidity pool above 114,600. A pullback is forming. Earlier, the price ended a 3-week correction by breaking through the downward resistance. We can assume a change in sentiment towards the buyer...
Technically, the price is changing the nature of the market to bullish after the formation of a reversal structure accompanied by a bullish run. The 2-week high has been updated.
Resistance levels: 113850, 114620, 115900
Support levels: 113100, 112300, 111800
As part of the correction, the price may test the 113K - 112500 zone before returning to growth. If the market holds the price above 112K - 113K, it will confirm the bullish sentiment, and the positive fundamental background will support further growth.
Best regards, R. Linda!
NVDA Ready for Takeoff: $200 Target in Sight!
Based on the daily chart of NVIDIA (NVDA) on NASDAQ, here’s a breakdown:
🔎 Technical Analysis
Overall Trend
The stock is in a strong uptrend (rallying from around $120 to the current $186).
Higher lows are forming, and price is pressing against the 185–187 resistance zone, showing strong buying pressure.
Key Resistance
185–187 USD is a critical resistance zone tested multiple times.
Given the strong daily candle and volume, the probability of a breakout is high.
Short-Term Support
Uptrend line provides support around 176–178 USD.
Next key support sits near 170 USD.
🎯 Short-Term Outlook (1–4 Weeks)
Entry Trigger: After a confirmed breakout above $187
Target 1: $195
Target 2: $200
Stop-Loss: Close below $178
🌐 Long-Term Outlook (3–6 Months)
Sustained breakout above $187 could lead to a new bullish phase.
Target 1: $210
Target 2: $225
Stop-Loss: Break below $170
✅ Summary
NVIDIA is on the verge of breaking a major resistance level. A cautious entry above $187 may offer attractive upside potential. Risk of a false breakout exists, so stop-loss discipline is crucial.

NZDUSD → Rebound from support. Focus on 0.5800FX:NZDUSD is undergoing a correction amid a rebound in the US dollar, testing trend support and forming a reversal pattern. The fall in the dollar may support price growth.
The dollar is correcting, which gives the forex market a chance. After retesting the support of the downtrend, the New Zealand dollar is forming a rebound. A reversal pattern and a breakout of resistance at 0.58 will return the price to the trading range, confirming a false breakdown of support and potentially triggering growth.
The global trend is neutral, and locally we have the boundaries of a downward channel. However, a false breakout of trend support could shift the angle of imbalance towards the buyer, allowing the price to rise.
Resistance levels: 0.580
Support levels: 0.5771, 0.575
A breakout of resistance at 0.58 and a close above this level would be a strong signal of readiness for growth. However, before that, the price may test support at 0.5771 (break-even zone).
Best regards, R. Linda!

NZDJPY → Consolidation amid a downtrend. What next?FX:NZDJPY is ending its correction and returning to the downward trend. The price is consolidating for a possible continuation of the downward movement...
The price breaks the support of the upward channel (countertrend correction). The movement occurs in a “step” format, which generally indicates weak demand. Clear consolidation boundaries are forming on the chart. The global trend is downward, and the local trend has also resumed its downward movement. Focus on two zones: 86.5 - 86.96. Within the framework of trading strategies, a false breakout of resistance or a breakout of support can be considered with the aim of continuing the decline.
Resistance levels: 86.96, 87.16
Support levels: 86.5
As part of consolidation, MM may form a liquidity trap on the resistance side, and a false breakout may trigger a further decline. However, if the bears increase pressure, the formation of a pre-breakdown base relative to the 86.5 support may trigger a breakout and a continuation of the downward movement.
Best regards, R. Linda!

SUI — Critical $3 ZoneSince completing its 5-wave impulse on July 28, SUI has been in a corrective phase for the past two months. The structure remains clean, with invalidation zones well-defined.
Looking ahead, there’s potential for an ascending triangle formation but for that to play out, it’s crucial that SUI holds the $3 psychological level.
Support Zone ($3.11–$2.93)
0.618 Fib retracement: $3.115
0.702 Fib retracement: $2.934
60 Weekly EMA $2.93 / SMA $3.036
Potential ascending triangle lower support line
📌 This is the last key support zone for bullish momentum. Losing it would break structure, holding it keeps the bullish case alive.
Resistance Zone ($4.12–$4.59)
Yearly Open (yOpen): $4.122 → key level bulls must reclaim
Swing Highs: $4–$4.5
0.786 Fib retracement: $4.59
15B Market Cap: $4.2
This area is loaded with resistance confluence and will act as the major target zone for longs.
🟢 Long Setup
Entry Zone: Between current price and $2.9 → ladder down into support
Stop-Loss: Below 0.702 Fib retracement
Take Profits: TP1 → $3.49, TP2 → $3.89, TP3 → $4.12 (yOpen)
R:R: ~1:4+
Potential Gain: +35%
This is a make-or-break zone for SUI. The $3 level is stacked with support confluences and must hold to keep the bullish structure intact. If bulls reclaim the yearly open at $4.122, momentum could carry toward $4.6.
🔍 Indicators used
DriftLine — Pivot Open Zones → For identifying key yearly/monthly/weekly/daily opens that act as major S/R reference points
Multi Timeframe 8x MA Support Resistance Zones → to identify support and resistance zones such as the weekly 60 EMA/SMA.
Fair Value Trend Model → Calculates a regression-based fair value curve
➡️ Available for free. You can find it on my profile under “Scripts” and apply it directly to your charts for extra confluence when planning your trades.
_________________________________
💬 If you found this helpful, drop a like and comment!

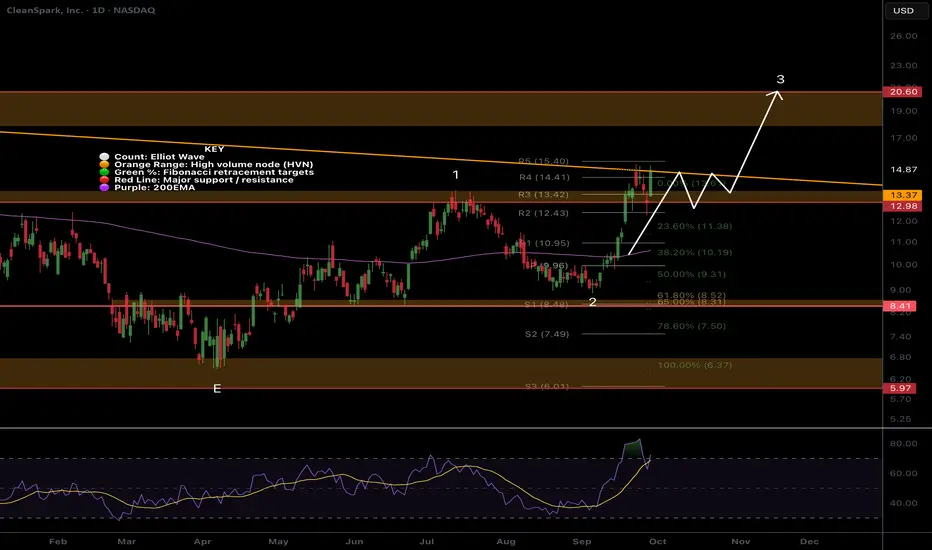
CLSK Attempting a significant resistance breakout!NASDAQ:CLSK has awoken at long last and has smashed through the wave 1 resistance High Volume Node straight into the Macro Triangle upper boundary i have been sharing in the weekly time frame posts. Breaking out above this and wave D at $20 will be a bullish signal with significant upside to come!
The High Volume Node resistance held as support in the big drop last week, quickly recovering back to highs showing strong demand.
The next local target is the wave D resistance $20 with continued upside in wave 3
Daily RSI is overbought but divergence yet and daily 200EMA has flicked positive.
Analysis is good unless we go back below wave 2 into the golden pocket.
Safe trading
Deere May Be LimpingDeere made a new record high in May, but some traders may think the strength is fading.
The first pattern on today’s chart is the three-month range between roughly $495 and $530. It was slightly above an earlier peak from February. DE’s inability to hold that breakout could be viewed as evidence of sellers outnumbering buyers.
Second is the July 21 close of $496.24. The farm-equipment maker gapped through that level in September, tested it and stayed below it. Has old support become new resistance?
Prices next made lower highs while holding the September 3 low of $466.76. The result is a potentially bearish descending triangle that showed signs of breaking last week.
Fourth, DE has been under its 200-day simple moving average (SMA). The 50-day SMA is also falling. Those signals could reflect increased weakness in the long and intermediate terms.
Finally, the 8-day exponential moving average (EMA) is below the 21-day EMA. That may reflect increased bearishness in the short term.
TradeStation has, for decades, advanced the trading industry, providing access to stocks, options and futures. If you're born to trade, we could be for you. See our Overview for more.
Past performance, whether actual or indicated by historical tests of strategies, is no guarantee of future performance or success. There is a possibility that you may sustain a loss equal to or greater than your entire investment regardless of which asset class you trade (equities, options or futures); therefore, you should not invest or risk money that you cannot afford to lose. Online trading is not suitable for all investors. View the document titled Characteristics and Risks of Standardized Options at www.TradeStation.com . Before trading any asset class, customers must read the relevant risk disclosure statements on www.TradeStation.com . System access and trade placement and execution may be delayed or fail due to market volatility and volume, quote delays, system and software errors, Internet traffic, outages and other factors.
Securities and futures trading is offered to self-directed customers by TradeStation Securities, Inc., a broker-dealer registered with the Securities and Exchange Commission and a futures commission merchant licensed with the Commodity Futures Trading Commission). TradeStation Securities is a member of the Financial Industry Regulatory Authority, the National Futures Association, and a number of exchanges.
TradeStation Securities, Inc. and TradeStation Technologies, Inc. are each wholly owned subsidiaries of TradeStation Group, Inc., both operating, and providing products and services, under the TradeStation brand and trademark. When applying for, or purchasing, accounts, subscriptions, products and services, it is important that you know which company you will be dealing with. Visit www.TradeStation.com for further important information explaining what this means.

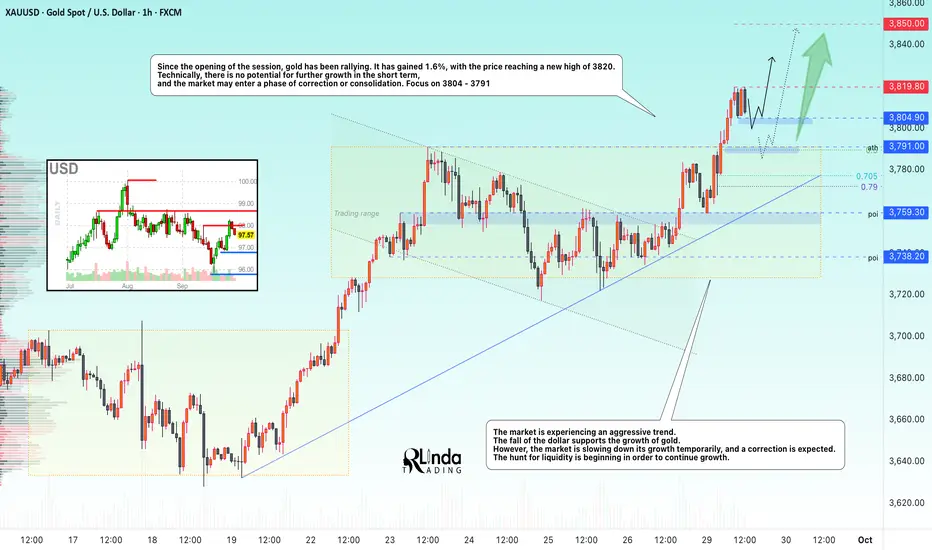
GOLD → Correction / consolidation before growth FX:XAUUSD has been rallying since the opening of the session, which we anticipated in yesterday's analysis. It has gained 1.6%, with the price reaching a new high of 3820. Technically, there is no potential for further growth in the short term, and the market may enter a phase of correction or consolidation.
Key supporting factors : Risk of a US government shutdown. Pressure on the USD is intensifying due to fiscal uncertainty. Unconfirmed reports of negotiations between Trump and Netanyahu on Gaza are not yet distracting attention from the risks.
The further dynamics of the metal this week will depend on US labour market data. This week will see JOLTS vacancies, ADP, PMI indices and the key NFP report on Friday. If they confirm the strength of the economy, expectations of a Fed rate cut (currently ~40 bps by the end of the year) may diminish, strengthening the dollar.
Resistance levels: 3819, 3825
Support levels: 3804, 3791, 3777
The market is experiencing an aggressive trend. The fall of the dollar supports the growth of gold. However, the price of the metal is slowing down temporarily, and a correction is expected. The hunt for liquidity is beginning in order to continue growth. Technically, the focus is on 3804 - 3791. A false breakdown of support could resume the bull run.
Best regards, R. Linda!
The Golden Run Continues: XAUUSD Eyes $3800? The Golden Run Continues: XAUUSD Eyes $3800?
Prior Bullish Momentum & Consolidation : XAUUSD entered a period of consolidation following a robust bullish rally earlier in the year. This initial surge established a strong underlying demand.
Symmetrical Triangle Formation : This consolidation phase manifested as a well-defined symmetrical triangle pattern on the 4-hour chart. This pattern typically represents a period of indecision, or accumulation/distribution, before a continuation of the prior trend.
Decisive Bullish Breakout: Gold has now executed a powerful and decisive upward breakout from the upper trendline of this symmetrical triangle. This action confirms the prevailing bullish sentiment and signals the likely resumption of the uptrend.
Key Support Level Established: The former upper trendline of the triangle, now residing around the $3500 mark, has effectively transformed into a critical immediate support level. A successful retest and hold of this level would further validate the breakout.
Strong Upward Trajectory: Post-breakout, the price action has been emphatically bullish, currently exhibiting a steep ascent within the marked green channel, indicating significant buying pressure.
Primary Price Target at Based on the measured move principle, often applied to symmetrical triangle breakouts (projecting the height of the pattern from the breakout point), our primary upside target for XAUUSD is 3800. This implies significant rally potential from current levels.
Disclaimer:
The information provided in this chart is for educational and informational purposes only and should not be considered as investment advice. Trading and investing involve substantial risk and are not suitable for every investor. You should carefully consider your financial situation and consult with a financial advisor before making any investment decisions. The creator of this chart does not guarantee any specific outcome or profit and is not responsible for any losses incurred as a result of using this information. Past performance is not indicative of future results. Use this information at your own risk. This chart has been created for my own improvement in Trading and Investment Analysis. Please do your own analysis before any investments.

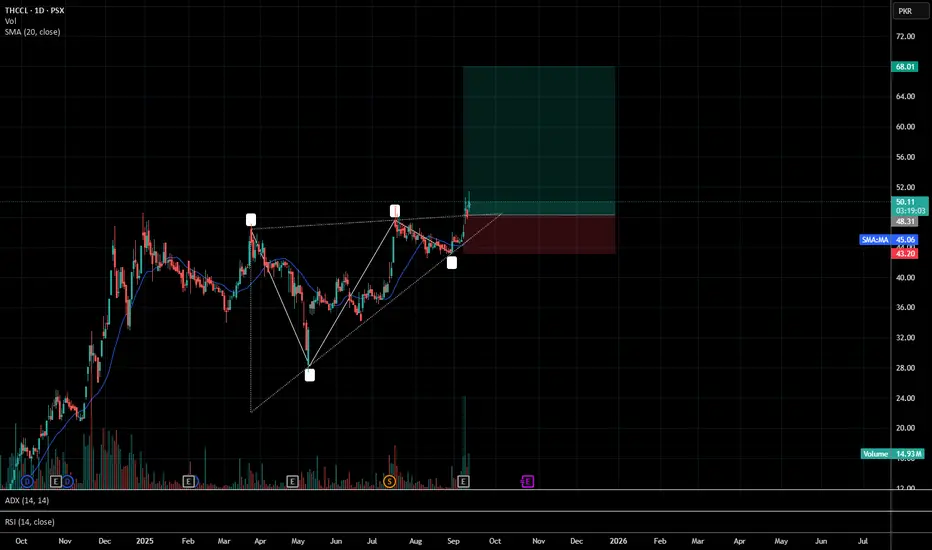
Long Trade for THCCL - Breaking out of a triangleTHCCL is currently in all time high zone. It is now breaking out of the consolidation on daily time frame and I believe in the target of 67.
The #1 Chart Pattern:Ascending Triangle - Amazon StockMan am doing my research
and did you know
that you can start a business
using your trading
skills?
This is mind blowing to me
i didn't think a skill
like trading can actually
be a full time
professional career.
So here i am banging my
head against the wall
thinking trading is a hustlers game
with no professional career
at the end of the tunnel.
But this thought is so false.Guys
trading is a real business
infact its the highest
form of business out here.
If you take this thing serious it can lead
to your financial freedom.
Because of this am going to have
a professional trading career
in the future you guys.
I didn't know that it gets this huge.
Am so humbled by this.
The fact that the government
recognises trading as a skill
has really humbled me
And now am starting to
appreciate people
like Robert Kiyosaki.
Who keep encouraging
young people to take up
financial education and change
their lives.
My life has changed or at least
my mindset has seen beyond
what my poor brain could imagine
man.
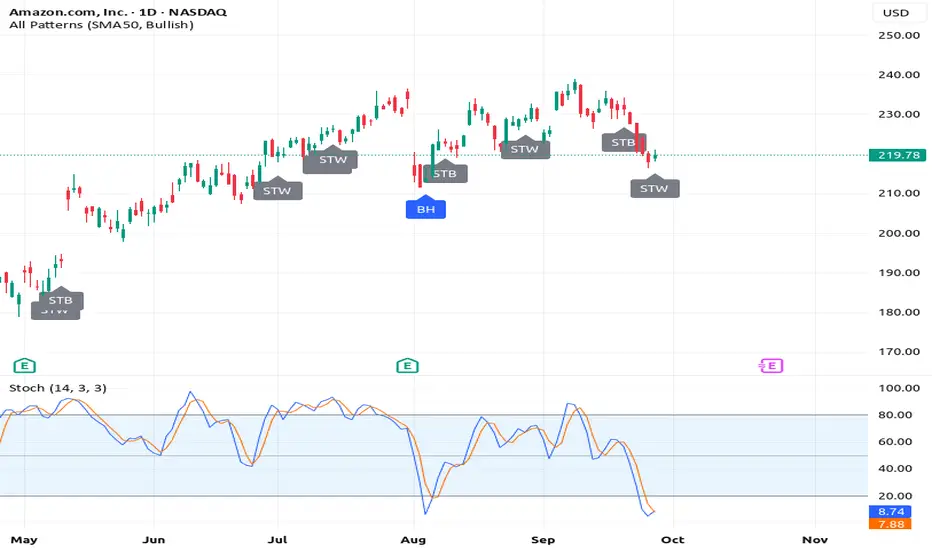
Anyway look at this chart. NASDAQ:AMZN
Look at the stochastic..(14,3,3)
When that blue line crosses above
the orange line
It will signal an entry signal.
But dont be excited and
expect the price to jump
up immediately.
The pattern is called "Ascending triangle"
This means the price will bounce off the resistance.
before it breakouts out..
That bounce from resistance will form
higher lows which get closer to
the breakout point.
The Spinning Top White Is
The Candlestick charting
technique am using here
Which i learnt from
reading Steve Nison's Book
On Japanese
Charting Techniques,
second edition.
Rocket boost this content to learn more.
Disclaimer: Trading is risky
please risk management
and profit taking strategies.
Also feel free to use a
simulation trading account.
Also dont trade Zero day
options that expire in one day,
please take this as a serious warning.
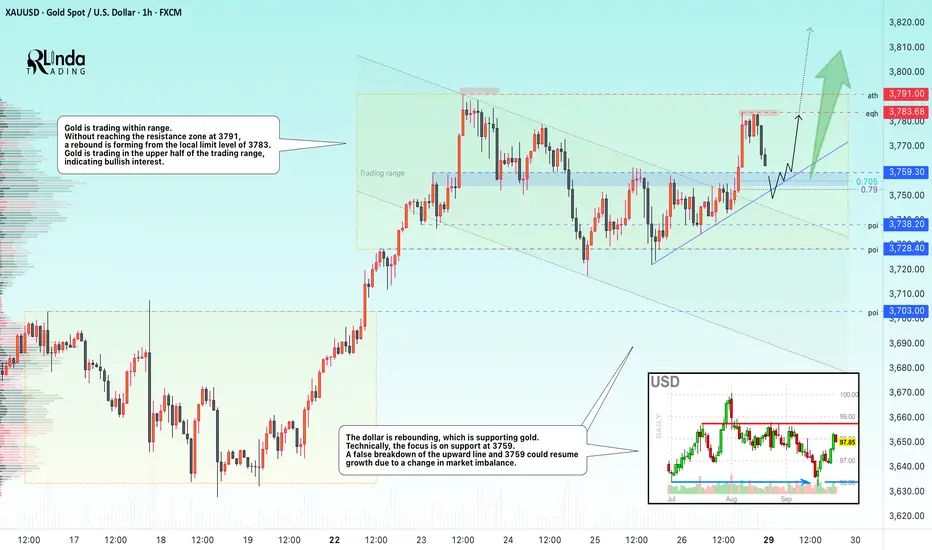
GOLD → The hunt for liquidity ahead of growth FX:XAUUSD . Technical analysis for the new trading session. On Friday, the local correction ended and there was a strong bullish impulse, which was sold off by the end of the session. What to expect next?
Gold is trading in the upper half of the current trading range of 3728-3791. The US session initiated the end of the technical correction, which ended with a breakout of the consolidation resistance at 3755. A momentum of 300 pips was formed, and the price hit the local limit resistance zone of 3783, from which the market began to sell off. However, the current correction of the bullish momentum is not so scary in the current perspective, as MM is forming a retest of the zone of interest to capture liquidity in order to continue the bullish trend. Thus, a false breakdown of the support zone 3759 - 3755 or the ascending line may shift the momentum towards the bulls, which in turn may lead to growth to 3783 - 3791.
Resistance levels: 3783, 3791, 3800, 3810
Support levels: 3759, 3755, 3743
If, during the retest of the support zone, the bulls keep the price above the blue zone at 3759, this will be a positive sign confirming the bullish structure, which could lead to a price recovery and a retest of the ATH.
Best regards, R. Linda!
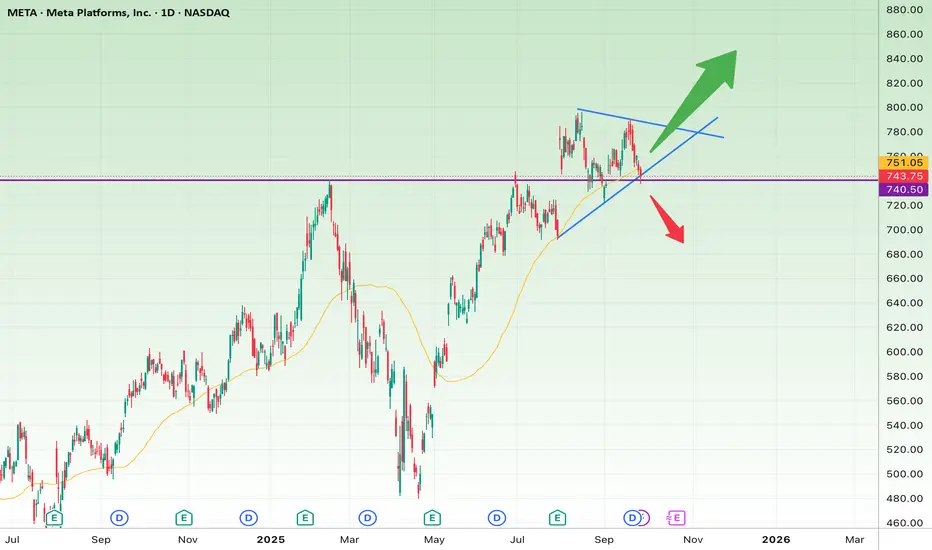
Meta’s Make-or-Break Triangle: Ready to Soar or Sink?Based on the daily chart of Meta Platforms (META):
🔹 Short-Term Outlook (1–3 weeks)
The price is consolidating within a symmetrical triangle pattern, usually a sign of an upcoming breakout.
Key support: $740–$745 (aligned with the rising trendline and 50-day moving average).
Key resistance: $770–$780 (downtrend line of the triangle).
📈 Bullish scenario (short-term):
A breakout above $780 with strong volume could trigger a move toward $805 (first target) and $830 (second target).
Stop-loss: A sustained close below $740.
📉 Bearish scenario (short-term):
A breakdown below $740 opens the door for a quick drop toward $710, and possibly $680.
Stop-loss: Recovery and close back above $760.
🔹 Long-Term Outlook (3–6 months)
The broader trend remains bullish, and the recent pullback looks more like a consolidation within the larger uptrend.
If the price breaks and holds above $805, the medium-term targets are $860 and then $920.
On the downside, losing $680 could trigger a deeper correction toward $620.
✅ Summary:
Short-term: The triangle is nearing completion; whichever side breaks first will define the next move.
Long-term: As long as $680 holds, the bigger picture remains bullish.
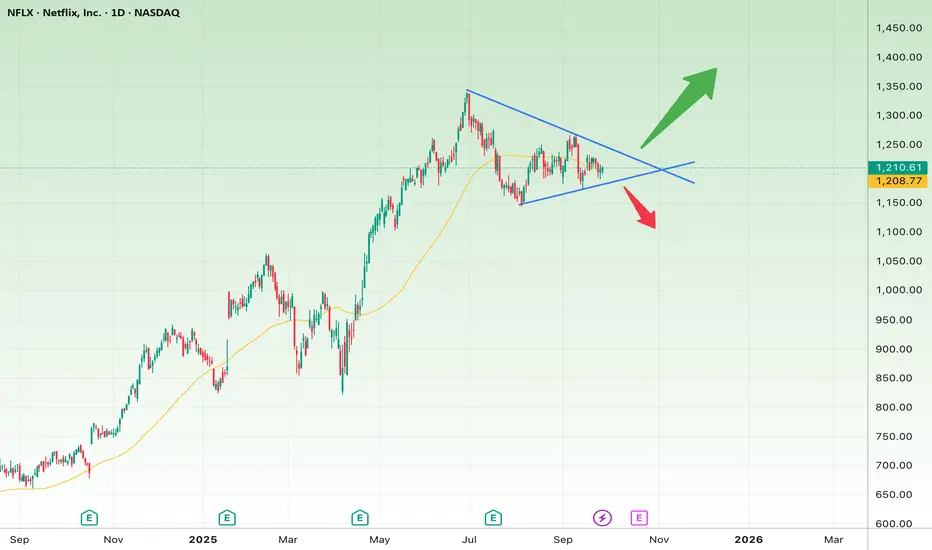
Netflix’s Make-or-Break Moment in a Symmetrical TriangleThe Netflix (NFLX) daily chart is showing a symmetrical triangle pattern. This usually forms before a strong breakout, and right now price is sitting at a decision point.
🔎 Short-Term Outlook (1–3 weeks)
Pattern: Symmetrical triangle around $1,200
Bullish Scenario:
A breakout above the upper trendline ($1,230–$1,240) could trigger strong buying momentum.
Targets:
First target: $1,300
Second target: $1,350
Stop-loss: Below $1,180
Bearish Scenario:
A breakdown below the lower trendline ($1,190) may lead to increased selling pressure.
Targets:
First target: $1,120
Second target: $1,050
Stop-loss: Above $1,240
🔎 Long-Term Outlook (2–6 months)
The overall trend since late 2024 has been bullish, with the 50-day moving average still supporting price action.
Bullish Scenario:
A confirmed breakout and consolidation above $1,240 could pave the way toward:
First target: $1,400
Second target (long-term): $1,500
Bearish Scenario:
If the triangle breaks downward and price holds below $1,150, the medium-term bullish structure could collapse.
Targets:
$1,050
$950 (key long-term support)
Stop-loss (long-term): Below $1,150
📌 Summary:
In the short term, the $1,190–$1,240 range is the key decision zone.
In the long term, the bias remains bullish unless price loses $1,150.
GOLD (XAUUSD): More Growth is Coming?!
Gold was very bullish on Friday.
A formation of a buying imbalance candle accompanied by a confirmed
breakout of a significant intraday resistance suggest a strong bullish pressure.
With a high probability, the market will update the ATH again and will aim at 3800 psychological level.
❤️Please, support my work with like, thank you!❤️
I am part of Trade Nation's Influencer program and receive a monthly fee for using their TradingView charts in my analysis.
