EURUSD → Breakthrough of consolidation resistance. Rally?FX:EURUSD ends correction with a breakout of consolidation resistance. The market is waiting for a positive driver in the form of economic news that could support the growth of the euro...
A breakout of the correction (consolidation) resistance has formed. However, the momentum is being replaced by a correction aimed at consolidating in the bullish plane, which could trigger continued growth in the medium term.
The dollar looks weak, and expectations of interest rate cuts are supporting the euro. If the bulls keep the price above 1.17 - 1.172 within the current correction, the price may start to rally to highs...
Support levels: 1.173, 1.1703
Resistance levels: 1.178, 1.183, 1.190
Before continuing to grow, liquidity may be captured relative to the previously broken consolidation resistance. A false breakdown of support at 1.173-1.170 could trigger a resumption of growth towards 1.190.
Best regards, R. Linda!
Triangle

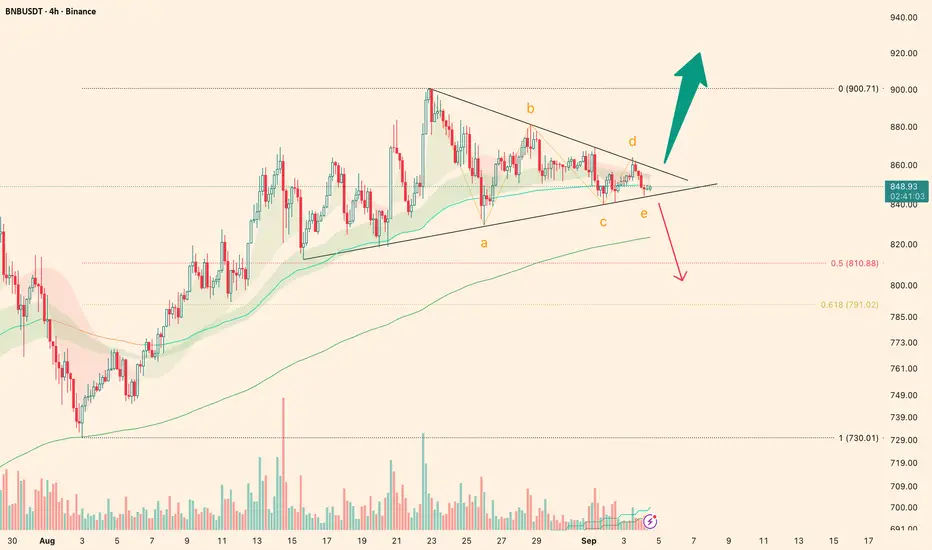
BNB Approaching Triangle Breakout — Long or Short Ahead?BNB’s price is consolidating within an ABCDE triangle . On the chart, two clear trendlines can be drawn: the descending line with 4 touches and the ascending line with 5 touches , highlighting the importance of both.
If the descending trendline breaks, I’ll be looking for long positions, as the price would likely aim to set a new ATH. However, there’s still a chance of a drop within a standard ABC correction.
If the ascending trendline breaks, I’ll be opening short positions with a target in the 810–790 range
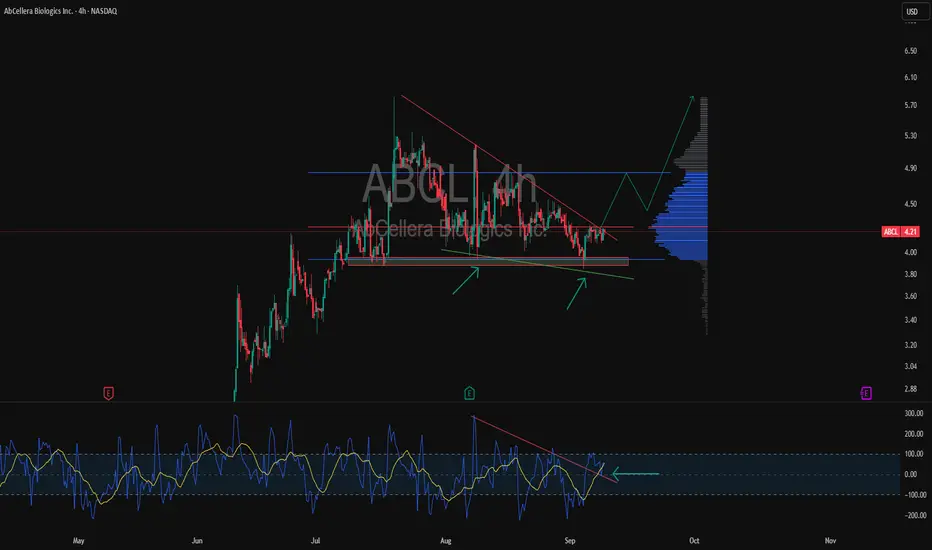
ABCL 4H support test and triangleAbCellera Biologics stock is trading inside a triangle pattern and testing the key support at 3.90–4.00.
Signals are showing that sellers are losing momentum: CCI prints a bullish divergence and the volume profile highlights accumulation above the current level. A breakout above the descending trendline around 4.30 could open the way towards 4.80 and even 5.60.
From a fundamental perspective the company remains an important biotech player focusing on antibody-based drug development. The sector is highly news driven and any announcement on trials or partnerships could trigger sharp moves.
As long as support holds buyers keep the advantage and the market looks like a spring that has been compressed too long and is ready to release.
BTC at a Crossroads: $114k Break or Retest $110k?BTC at a Crossroads: $114k Break or Retest $110k?
Bitcoin (BTCUSD) experienced a significant downtrend throughout mid-August, eventually finding robust support around the $108,000 level. This price action formed a "Double Bottom" pattern, which is a classic bullish reversal indicator, suggesting a potential shift in market mo-mentum.
Following this bullish reversal, BTC has initiated a recovery, currently navigating within an ap-parent ascending channel. It is now actively testing immediate resistance at the $114,000 mark, having recently demonstrated strength by bouncing off solid support established near $110,000.
Should Bitcoin successfully break and hold above the $114,000 resistance, the next substantial area of overhead supply and a critical psychological barrier is identified between $118,000 and $120,000. This zone would represent the next major hurdle for continued upward movement.
A definitive breakout above $114,000 to confirm sustained bullish momentum, or a rejection that could lead to a retest of the $110,000 support, potentially dictating the short-term direction.
Disclaimer:
The information provided in this chart is for educational and informational purposes only and should not be considered as investment advice. Trading and investing involve substantial risk and are not suitable for every investor. You should carefully consider your financial situation and consult with a financial advisor before making any investment decisions. The creator of this chart does not guarantee any specific outcome or profit and is not responsible for any losses incurred as a result of using this information. Past performance is not indicative of future results. Use this information at your own risk. This chart has been created for my own improvement in Trading and Investment Analysis. Please do your own analysis before any investments.

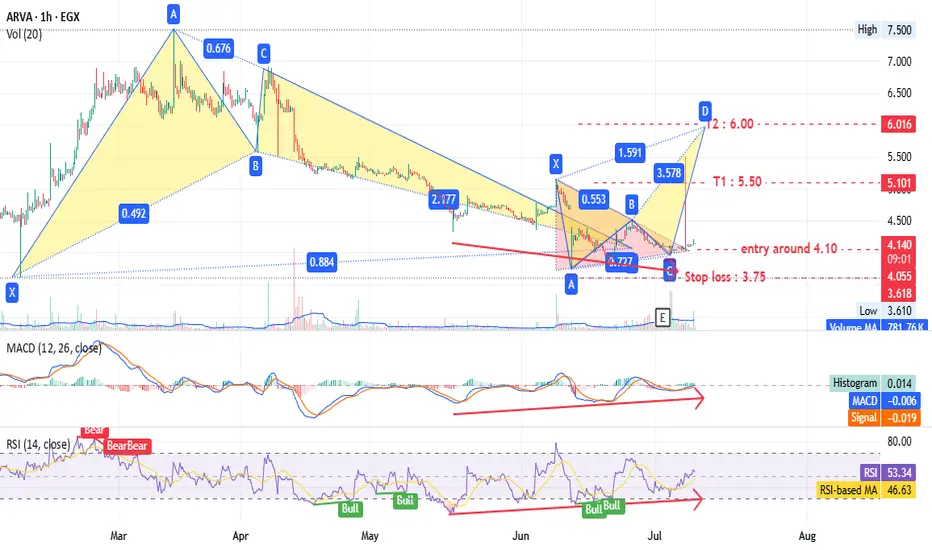
ARVA - many patterns give one target - Amazing EGX:ARVA timeframe 1 hour
Entry around 4.10
Stop loss at 3.75 (10% loss).
Targets at 5.50 and 6.00 (up to 44% profit).
Hourly chart shows a triangle pattern and bearish Gartley pattern.
Daily timeframe also indicates a bullish pattern with the same targets.
MACD and RSI support this analysis.
Note: This is not investment advice—only my analysis based on chart data. Consult your account manager before investing. Good luck!
BDP. Accumulation zone.BDP price is 70% higher than the previous historical low and probably by Oct '25 the price may touch $0.02 level and this is a great accumulation zone if that happens - RSI oversold here as an excellent indicator in addition to the main patterns.

POL - ready to fly!GM TEAM!
I see a Beautifull bullish candle close H4 on PSX:POL 📈
Time to moon?? 🚀

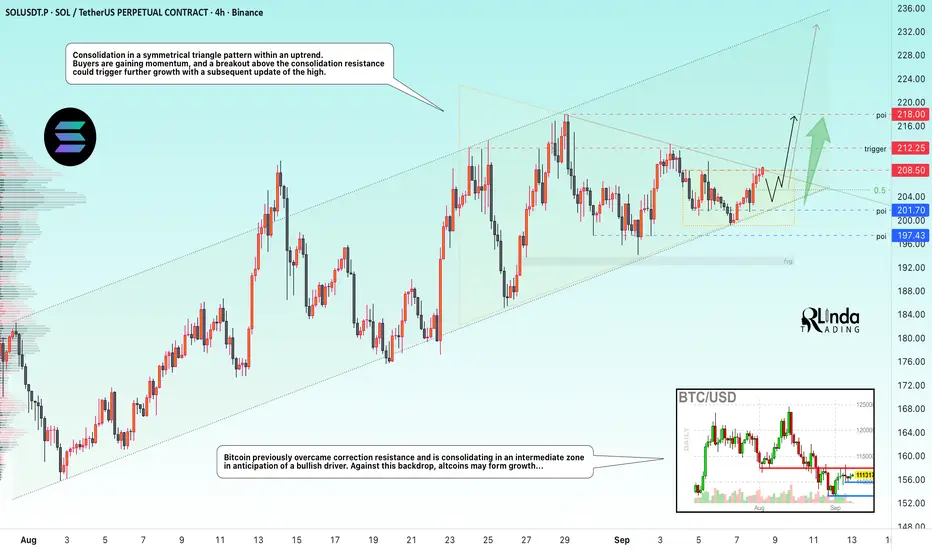
SOLUSDT → Consolidation before the rally. New high?BINANCE:SOLUSDT continues to form a bullish trend without reacting to market noise. The price is consolidating before a possible rise. Focus on the trigger...
Bitcoin previously overcame correction resistance and is consolidating in an intermediate zone in anticipation of a bullish driver, which could generally strengthen positive sentiment in strong altcoins. Against this backdrop, the market may form growth...
SOL is consolidating in a symmetrical triangle pattern within an uptrend. Buyers are gaining momentum, and a breakout of the consolidation resistance could trigger continued growth with a subsequent update of the maximum.
Resistance levels: 208.5, 212.25, 218.0
Support levels: 201.7, 197.4
Before the breakout and growth, a retest of the 205.0 - 201.7 zone may form, however, a breakout beyond the symmetrical triangle may trigger a spread. Growth targets may be 220, 245.
Best regards, R. Linda!
FLUOROCHEM | Buy above 3660 | SL below 3200 | Target 5450Disclaimer:
This is not financial advice. Please do your own research or consult with a financial advisor before making any investment decisions. Investments in stocks can be risky and may result in loss of capital.

Dogecoin Wave Analysis – 8 September 2025
- Dogecoin broke daily Triangle
- Likely to rise to resistance level 0.2600
Dogecoin cryptocurrency recently broke the resistance trendline of the daily Triangle from the middle of July.
The breakout of this Triangle should accelerate the active impulse wave iii of the short-term impulse wave 3 from the start of August.
Given the strongly bullish crypto sentiment seen today, Dogecoin cryptocurrency can be expected to rise toward the next resistance level 0.2600 (former monthly high from August).

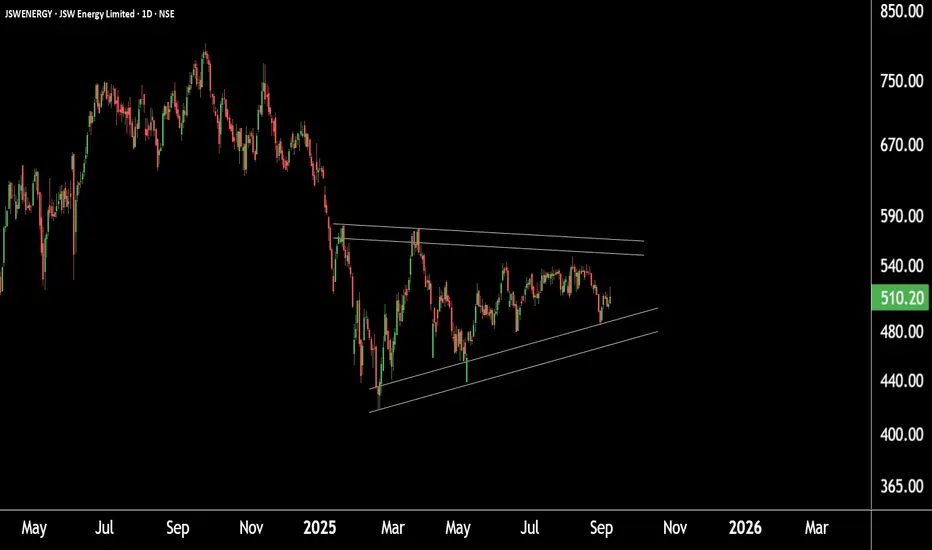
Chart Alert: Major Pattern Formation in JSW EnergyThis is the daily timeframe chart of JSW Energy.
The stock is currently forming a symmetrical triangle pattern with support around ₹465–₹475 and resistance near ₹564–₹570.
If JSW Energy sustains above this resistance zone, it could trigger a breakout, potentially leading to higher price levels in the coming sessions.
Thank you.
EURUSD: Correction Before the Impulse UpHello everyone, here is my breakdown of the current Euro setup.
Market Analysis
From a broader perspective, after exiting a prior Upward Channel, the price action has entered a lengthy period of consolidation. This price action has been forming a large ascending triangle, which is typically a bullish continuation pattern. The boundaries are defined by the horizontal Resistance at the 1.1740 level and an ascending support line.
Currently, the price is trading in the upper portion of this triangle, having recently bounced from the ascending Triangle Support Line. We are now approaching the critical flat resistance at the 1.1740 level for another significant test. This Resistance Zone has successfully capped all rallies for several weeks.
My Scenario & Strategy
My scenario is built on the idea of one final corrective dip before the potential bullish resolution of this triangle. I'm looking for the price to pull back from the current levels and make a move down to test the Triangle Support Line.
Therefore, the strategy is to watch for this bounce, which should then lead to a breakout above the 1.1740 Resistance. A confirmed break would validate the long scenario, with the primary target for the subsequent upward expansion set at 1.1840 points.
That's the setup I'm tracking. Thank you for your attention, and always manage your risk.

Solana's Price Coils in Rare Bullish FormationSolana's Price Coils in Rare Bullish Formation, Hinting at a Potential Rally to $230
Solana (SOL) has captured the attention of the cryptocurrency market, with its price charting a course that suggests a significant upward movement may be on the horizon. After a robust gain over the past month and a powerful rebound from its recent lows, the high-performance blockchain's native token is trading within a classic technical pattern known as a symmetrical triangle. A decisive breakout from this formation could propel SOL towards a price target of $230 in the coming days, a move supported by strengthening on-chain metrics, resurgent NFT market activity, and bullish sentiment in the derivatives market.
The digital asset has shown considerable strength, rallying to intraday highs well above the $200 mark before stabilizing. This price point not only marks a significant recovery but also positions SOL tantalizingly close to the upper boundary of its consolidation pattern. This technical setup, combined with strong fundamental tailwinds, is creating a compelling narrative for a potential bullish continuation.
The Anatomy of a Bullish Setup: The Symmetrical Triangle
At the heart of the current bullish thesis for Solana is the formation of a symmetrical triangle on its price chart, a pattern that has been developing over recent weeks. In technical analysis, a symmetrical triangle is characterized by two converging trendlines—one descending line connecting a series of lower highs and one ascending line connecting a series of higher lows. This pattern visually represents a period of consolidation and indecision in the market, where the trading range tightens and volatility contracts. It signifies a temporary equilibrium between buyers and sellers, often preceding a significant price move or "breakout."
While a symmetrical triangle is technically a continuation pattern—suggesting the price will likely resume the trend it was in prior to the triangle's formation—it can break in either direction. However, for Solana, which has been in a broader uptrend, a breakout to the upside is the more anticipated outcome. Analysts are closely watching for a decisive close above the triangle's upper trendline, ideally accompanied by a spike in trading volume, which would serve as confirmation of the breakout.
Multiple analyses converge on a significant price target should this breakout occur. The height of the triangle at its widest point, projected upward from the breakout point, suggests a potential rally that could take SOL to the $230 mark. Other technical strategists have identified targets in a similar range, with some pointing to the $230-$235 area and others looking at a near-term pivot range that could open the path toward higher targets.
Strengthening this possibility are key momentum indicators. The Moving Average Convergence Divergence (MACD), a popular trend-following indicator, has shown its primary line crossing above its signal line, a classic sign of a strengthening uptrend and building bullish momentum.
The Road to Recovery: A Powerful Rebound Ignites Momentum
Solana's current consolidation does not exist in a vacuum. It follows a period of impressive recovery that has renewed investor confidence. After dipping to a notable low in the preceding month, SOL has mounted a formidable comeback of over 30%. This rebound demonstrates strong buying pressure at lower price levels and has established a solid foundation for the current market structure.
Over the past month alone, SOL has registered a double-digit percentage increase in value, a period during which the symmetrical triangle began to take shape. This price action suggests that the recent consolidation is a healthy pause, allowing the market to digest recent gains before a potential next leg up. The series of higher lows established since late August is particularly constructive, indicating that buyers remain active and are stepping in to defend key support levels.
The cryptocurrency is currently consolidating above a critical support level in the high $190s. This price zone is considered highly significant by on-chain analysts, as a massive volume of tokens has historically been traded at this level, creating a strong foundation of support that bulls are actively defending.
Beyond the Charts: Fundamental Tailwinds Gathering Strength
While the technical picture is compelling, a confluence of fundamental factors is adding significant weight to the bullish case for Solana.
The NFT Ecosystem Reawakens
A notable catalyst has been a sharp resurgence in activity within Solana's non-fungible token (NFT) ecosystem. In a recent notable 24-hour window, sales volume for Solana-based NFTs experienced a dramatic spike, more than doubling from the previous day's figures and reaching well into the millions of dollars. This surge propelled Solana to become the second-largest NFT market globally by daily sales volume, trailing only Ethereum.
This spike was largely driven by the explosive popularity of certain new collections, which saw their daily sales volumes skyrocket by orders of magnitude. Other collections also posted significant gains. While the broader NFT market has seen fluctuations, Solana's performance showcases a notable relative strength and a growing appeal for its high-speed, low-cost architecture among NFT creators and collectors. This renewed retail and speculative interest in Solana's NFT scene could be a powerful driver of market momentum.
Bullish Bets in the Derivatives Market
Sentiment among professional traders, especially in the derivatives market, has shifted decisively toward a bullish outlook. Open interest in SOL futures, which represents the total value of all outstanding futures contracts, has seen a substantial increase over the past month, climbing by several billion dollars. This indicates a high degree of speculative interest and suggests a growing number of traders are positioning for a future price increase.
Furthermore, SOL's weighted funding rate has remained consistently positive for an extended period. The funding rate is a mechanism used by perpetual futures exchanges to keep the contract price in line with the spot price. A positive funding rate indicates that traders holding long positions are paying a premium to those holding short positions, a clear sign that the prevailing sentiment is bullish and traders expect the price to continue rising.
The Institutional Stamp of Approval
A steady drumbeat of institutional adoption continues to provide a strong fundamental floor for Solana's valuation. The launch and subsequent inflows into Solana-focused Exchange-Traded Funds (ETFs) in North America have signaled growing confidence from traditional finance. These products have seen millions of dollars in inflows on strong trading days.
This trend extends to corporate treasuries. The listing of Solana-focused companies on major stock exchanges, holding significant amounts of SOL tokens, brings considerable Wall Street exposure to the asset. This institutional demand, coupled with whale accumulation, where large holders have been observed adding to their positions, provides a powerful source of buying pressure.
The Alpenglow Upgrade
Adding to the long-term bullish case is the anticipated Alpenglow network upgrade. Approved by an overwhelming majority of validators, this upgrade is set to slash transaction finality times significantly, bringing them down to a fraction of a second. This enhancement would provide Solana with Web2-level settlement speeds, dramatically increasing its competitiveness in high-frequency applications like decentralized finance (DeFi) and gaming, and potentially driving a new wave of developer and user adoption.
Navigating the Hurdles: Resistance and Risks on the Horizon
Despite the overwhelmingly bullish confluence of factors, investors should remain aware of the potential risks and key resistance levels that lie ahead. The symmetrical triangle, until a breakout is confirmed, remains a pattern of indecision. A break below the lower support trendline could invalidate the bullish thesis and trigger a move to the downside, with potential targets at lower support levels.
Even with an upward breakout, the path to $230 is not without obstacles. Solana faces immediate resistance in the zone just above its current trading range, an area that has been tested multiple times. A more significant band of resistance is anticipated in the range between $210 and $250, where sellers may look to take profits.
Furthermore, some on-chain metrics suggest that while momentum is building, some long-term holders may be taking the opportunity to distribute their holdings, which could create selling pressure. The broader cryptocurrency market remains subject to volatility, and a downturn in major assets like Bitcoin or Ethereum could negatively impact altcoins like Solana, regardless of their individual technical and fundamental strength.
Conclusion
Solana currently presents one of the most compelling risk-reward setups in the cryptocurrency market. The formation of a rare symmetrical triangle on its price chart, following a powerful rebound, has laid the technical groundwork for a potential rally toward $230. This bullish structure is not merely a product of chart patterns; it is underpinned by a potent combination of fundamental drivers. A re-energized NFT ecosystem, overwhelmingly positive sentiment in the derivatives market, growing institutional adoption, and a landmark network upgrade on the horizon all contribute to a powerful narrative of growth and expansion.
While traders and investors must remain vigilant of key resistance levels and the inherent risks of the crypto market, the evidence suggests that Solana is coiling for a potentially explosive move. A confirmed breakout in the coming days could validate the bullish setup and send SOL on the next major leg of its upward journey, solidifying its position as a leading blockchain platform for the future of decentralized applications.

Gold. Bull Trap "triangle". 28/July/25XAUUSD, by checking gold latest speed of chart with its cycle. we might have a bull 'trap" triangle. A base for rallying to ATH again before a very deep pullback toward 233 Daily EMA which have not been "touched" for long time...

HYPEUSDT → Upward consolidation. One step away from a rally BINANCE:HYPEUSDT.P continues to consolidate while maintaining an ascending triangle structure. Any bullish driver, even a weak one, could trigger a breakout of resistance and distribution with an ATH update...
Against the backdrop of weak Bitcoin and falling altcoins, HYPE looks positive. The market is holding an upward support line and a bullish trend, and the update of the local maximum as a manifestation of bullish strength is a positive sign. The price is changing the local market structure to bullish and is ready to continue growing after a correction. Focus on the 46.15 and 45.5 - 45.08 areas. A false breakdown and closing above the level will confirm the readiness to continue growing.
Resistance levels: 47.78, 49.54
Support levels: 46.15, 45.08, 44.45
As part of the correction, the price may test the specified areas of liquidity and interest, which may provoke a change in the market imbalance in favor of buyers. If, after a false breakdown of key areas, the bulls keep the price above, then in the short and medium term, we can expect continued growth.
Sincerely, R. Linda!

Buy zone of Nas100If we start trading inside the triangle again, then there is a possibility sellers will step in the market and push the market lower to the buy zone area. The triangle pattern is a strong indication of sell - however, the overall market structure of Nas100 is bullish, therefore, I will not be taking sells if sellers do step in the market, I will still wait for buy entries.
If the market trades up, and breaks resistance, I will look for buy entries on smaller TF and continue with the bullish momentum.

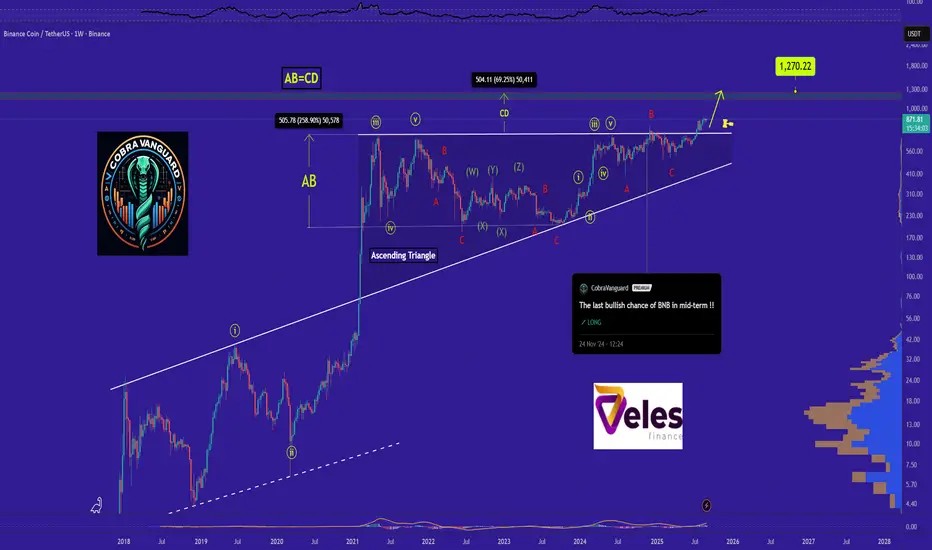
BNB is bullish now and many Traders don't see it !!As I said, BNB broke the triangle, it could surge to $1000 , and you still think I'm joking!!
The price is currently supported well, which can increase the price.
Stay Awesome , CobraVanguard
Previous analysis
The Reversal Overture: " Bitcoin's Ascent from the Depths"In the quiet hum of the market's pulse, a story begins to unfold on the 4-hour chart of Bitcoin (BTC/USD). Like a phoenix rising from the ashes, the price stirs from the depths of recent lows, hinting at a shift — a new bullish tale whispered through candlelight.
The Setup
This chart paints a scene of recovery and hope. A descending trendline, once a symbol of persistent decline, has been decisively broken. The price now emerges above it — a clear sign of strength. From the valley of support around $107,270 and a wick low near $105,692, Bitcoin claws its way upward, challenging resistance with fresh momentum.
Marked clearly are two destinations:
Destination 1: $117,218 — a waypoint on this journey, where price may briefly rest.
Destination 2: $123,125 — a higher peak, nestled beneath the looming **Major Resistance** zone that stretches toward $124,517.
The trend is now bullish, supported by a clean breakout and the formation of higher lows — the market's silent nod of approval.
The Bullish Causes are :
1. Break of the Descending Trendline
Like the first light after a storm, this break signals a potential change in character — from fear to optimism.
2. Strong Support Reaction
Price bounced with conviction from the $107K–$105K support zone. Buyers stepped in with purpose, defending a key level.
3. Higher Highs & Higher Lows in Formation
The rhythm of the market now beats in a bullish cadence — stair-stepping upward, each level stronger than the last.
4. Momentum Builds into Resistance
As the chart eyes the major resistance zone, it does so not with hesitation, but with increasing volume and energy — the lifeblood of bullish continuation.
Timeless truth:
"If there is no managed risk, one cannot take profit."
This is no flash-in-the-pan rally. It is a setup for the long run, crafted with patience and vision. The path may be winding, but the direction is clear — Bitcoin is trending, and the bulls are once again writing their chapter in this ever-evolving market tale.

BITCOIN → Sale on positive news? What to expect? 100K or 130K?BINANCE:BTCUSDT.P unsuccessfully ended another attempt to break through the 112K-113K zone. The positive background (NFP) did not affect the price, and a bearish setup formed on D1...
D1 is forming a pin-bar relative to the strong resistance zone of 112K - 113K, positive news is quickly sold off, and the price, rebounding from the resistance of the trading range, closes near the bearish trigger of 110500. Bitcoin looks quite uncertain as it faces selling pressure in the 112K-113K zone. The price cannot consolidate above this area despite the previously broken correction resistance. There is logic in this maneuver... The market is betting on a more than 90% chance of interest rate cuts, and by that point, the price of Bitcoin may fall to the maximum permissible limits before further growth. Areas of interest may be 107K - 105K - 100K
Resistance levels: 111.9K, 113.3K, 117K
Support levels: 110.5K, 107.4K, 105.0K
A breakdown of the 110.5K support could trigger further sell-offs towards the support of the key trading range. Within the current downward cycle, the price may well test 105,000, which is a fairly strong liquidity zone. The fundamental background is positive, and the current sell-off may be manipulative movement before the emergence of a bullish driver...
Best regards, R. Linda!

Douglas Elliman (DOUG) – NeoWave Structural OutlookThis chart presents a NeoWave structural interpretation of DOUG, combining the higher-degree schematic (left) with the real market data (right).
On the 6-month structural model (left panel), we label the decline as (W), followed by an intervening (X), and now developing into a potential (Y) = upsloping contracting triangle.
On the daily chart (right panel), starting from the end of wave (X), price action subdivides into a five-legged contracting triangle: A–B–C–D–E.
The upper boundary is flat, repeatedly tested by waves B and D.
The lower boundary is rising, defined by waves A, C, and E.
Wave B is the most violent, while E is smaller in price but longer in time – acceptable under NeoWave guidelines.
Implications:
If the labeling is correct, this triangle represents wave (Y).
Upon completion, two scenarios are possible:
Continuation – If the larger pattern is a W–X–Y, the triangle could be the terminal corrective structure, followed by a strong breakout.
Extension – If the correction is not yet complete, the triangle as (Y) could be followed by another X–Z to form a full W–X–Y–X–Z complex.
👉 Key Level: If price breaks out of the triangle to the upside and holds above 3.00, this would strongly suggest the start of a new trend or the beginning of another upward (X) wave.
👉 Target Projection: Based on the triangle’s height (B–C range = 2.60–1.48 ≈ 1.12), the potential upside target lies near 4.10–4.15.

EURUSD Long: Impulse Up from Demand Line of TriangleHello, traders! The price auction for EURUSD has been consolidating for an extended period, forming a large symmetrical triangle pattern. This structure signifies a period of balance and contracting volatility, with key pivot points establishing the upper supply line near the 1.1735 SUPPLY level and the lower demand line originating from the 1.1575 DEMAND level. The market has been coiling within these boundaries, building energy for a decisive move.
Currently, the auction is at a critical inflection point. Following a rejection from the supply line, the price has completed a full rotation to the downside and is now directly testing the ascending demand line. This area represents a key potential support, where the market will decide if the bullish initiative can absorb the recent selling pressure and maintain the pattern's integrity.
The primary scenario anticipates a successful defense of this ascending demand line by buyers. A confirmed bounce from this dynamic support would validate the triangle pattern and signal that a bullish rotation back towards the upper boundary is underway. The take-profit is therefore set at 1.1730 points, targeting the descending supply line of the triangle, which is the logical objective for this rotational play. Manage your risk!

SOLUSDT → Stronger than the market. Correction before growthBINANCE:SOLUSDT updated its maximum to 218 and entered another phase of correction for consolidation. The altcoin looks quite strong against the backdrop of the rest of the cryptocurrency market...
Bitcoin continues its aggressive decline after yesterday's trap (false breakout of the trend line). Despite relatively positive fundamental and technical developments, the cryptocurrency market is in the red. Against this backdrop, SOL stands out as a strong altcoin compared to Bitcoin, which has been falling for two weeks. SOL updated its maximum and entered a correction phase. Within the current structure, the price may test the liquidity zone of 202.5 - 195.3 before continuing to grow to 220 - 240.
The reaction to false breakouts of local highs is weak, there is no reversal, and the nature of the current structure is “consolidation.” If the bulls keep the price above 200 during the correction, the further outlook will be positive.
Resistance levels: 216.5, 220, 244
Support levels: 202.5, 198.0, 195.3
Focus on the current correction. We need to wait for a slowdown and the end of the structure. Focus on the specified support zones, from which the market may resume bullish trading, which in turn may lead to a breakout of intermediate resistance and growth to the specified targets.
Best regards, R. Linda!

RGTI - let's gambleHigh risk RGTI gamble with good 4:1 ratio. Not sure why TW is forcing me to write more to publish this degen gamble.
