NZDJPY → A false breakout of resistance will trigger a declineFX:NZDJPY entered a correction phase after a sharp decline. The main trend is downward, with a countertrend movement aimed at consolidating potential before further decline.
A countertrend correction is forming against the backdrop of the main downward trend. The current movement may be aimed at hunting for liquidity before continuing its movement. Focus on the resistance zone at 86.67
The currency pair is trading below key resistance within the global downtrend. As part of the correction, the price may test 86.67 - 87.10 before continuing the main trend.
Resistance levels: 86.67, 86.97, 97.11
Support levels: 85.97, 85.6
If a false breakout of the key zone of interest forms during the correction without the possibility of continuing growth, we will receive confirmation that the market is ready to move down. Consolidation below the level may trigger a downward impulse.
Best regards, R. Linda!
Triangle

GBPJPY : IMPORTANTHello friends
You can see that the downward waves are getting longer and the upward waves are getting shorter, which indicates the strength of the sellers, and a triangle has also formed, which compresses the price and can, in the event of a valid failure, go down another downward step, which will become a continuation triangle.
Don't forget risk and capital management.
*Trade safely with us*

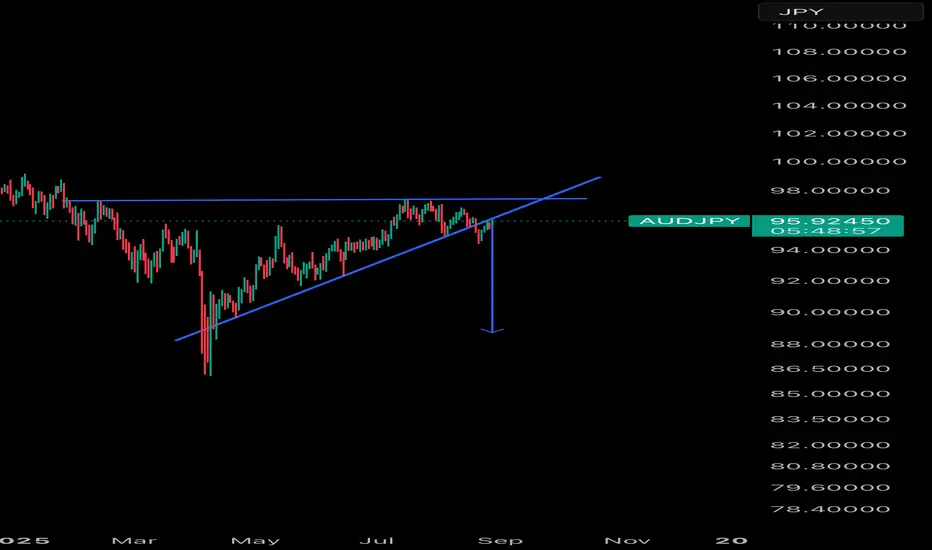
AUD/JPY is retesting breakout Looking for the 88.71 target in the upcoming days. Stop loss:96.90
Note: Education purpose only.
INJ | Big Move Loading?#INJ has been moving sideways for weeks and is now forming a triangle pattern on the 1D chart.
After the downtrend, this looks like a classic accumulation phase…
Which often comes before a bullish breakout.
Here’s what I’m watching:
✅ Break of the triangle
✅ Strong volume on breakout
✅ Retest of resistance → Long entry
Setup looks bullish, but patience + risk management is key.
What’s your take on #INJ? 🚀 or 😴?
💬 Drop your thoughts below & hit 👍 + Follow for more setups!
#INJ #Injective #Crypto #Altcoins #Trading #Breakout #CryptoCharts #BullishSetup

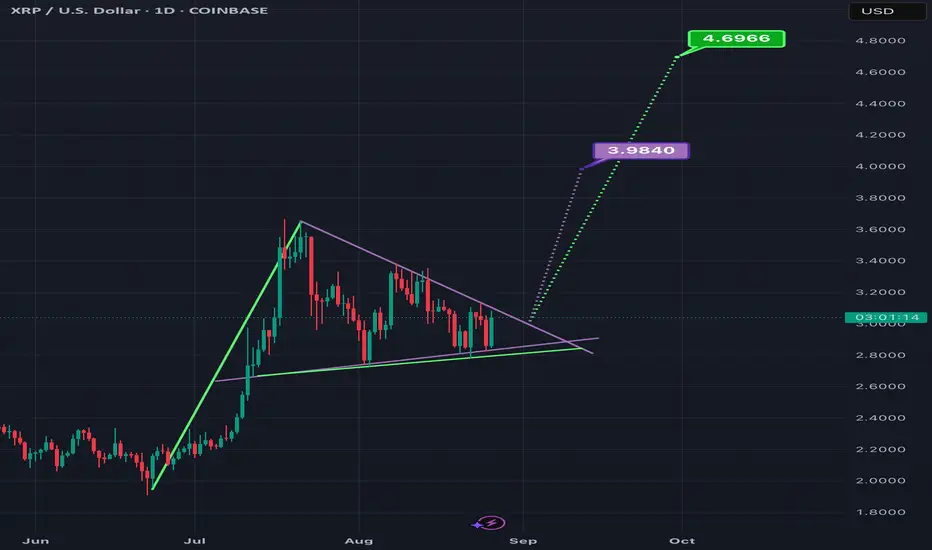
Symmetrical Triangle/ Bull Pennant on XRPUSD Nearing its ApexThe bottom trendline of this triangle definitely seems to have finally been narrowed down to this purple line and green line with multiple touch points to back that up. *not financial advice*
Gold Wave Analysis – 26 August 2025- Gold reversed from the key support level 3315.00
- Likely to rise to resistance level 3450.00
Gold recently reversed up from the key support level 3315.00, intersecting with the support trendline of the daily Triangle from April.
The upward reversal from the support level 3315.continues the active short-term impulse wave iii of the higher order impulse waves 3 and (5), from May.
Given the clear daily uptrend, Gold can be expected to rise to the next resistance level of 3450.00 (the former monthly high from July).

DJT.....Potential Breakout Soon!- Symmetric Triangle (Potential Breakout Soon)
- Partnering with Crypto.com for digital assets
Recommended Trade: Buy Shares

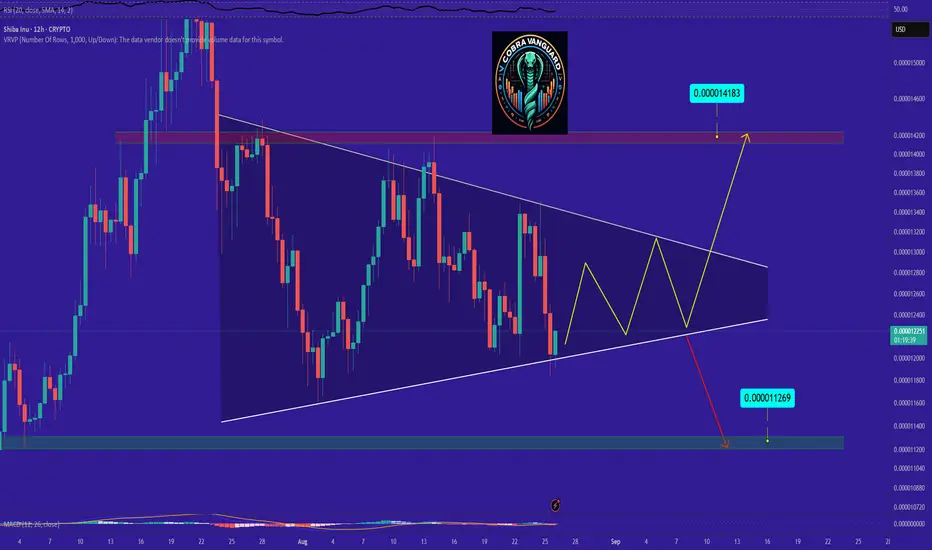
SHIB Ready for PUMP or what ?The triangle pattern will break in the direction it is breached, and the price will move in that direction.
BNBUSDT → Strong altcoin. Correction before growth.BINANCE:BNBUSDT.P , after forming an ATH, entered a correction, which may stop at 10-15%, after which the market may enter a recovery phase. The coin looks quite strong, especially against the backdrop of a bullish trend...
BNB looks quite stronger than Bitcoin. While the flagship is forming a deep correction, the altcoin is testing local support within the bullish trend.
BNB has quite positive dynamics. There is a strong bullish trend, the ATH has been updated, but a correction is forming, which is 8% of the permissible 30% (there is still room to move). The liquidity zone of 820-815 may serve as an area of interest. By the time the mirror level and strong area of interest are retested, Bitcoin may move into a recovery phase, which in turn will trigger growth in BNB.
Support levels: 820, 816, 796
Resistance levels: 861, 884, 901
At the moment, the entire cryptocurrency market is in a downtrend. As part of this cycle, BNB may test support at 820-816. A false breakdown of support and consolidation above this level may indicate that bulls are interested in further growth. This could trigger a recovery within the main trend.
Best regards, R. Linda!

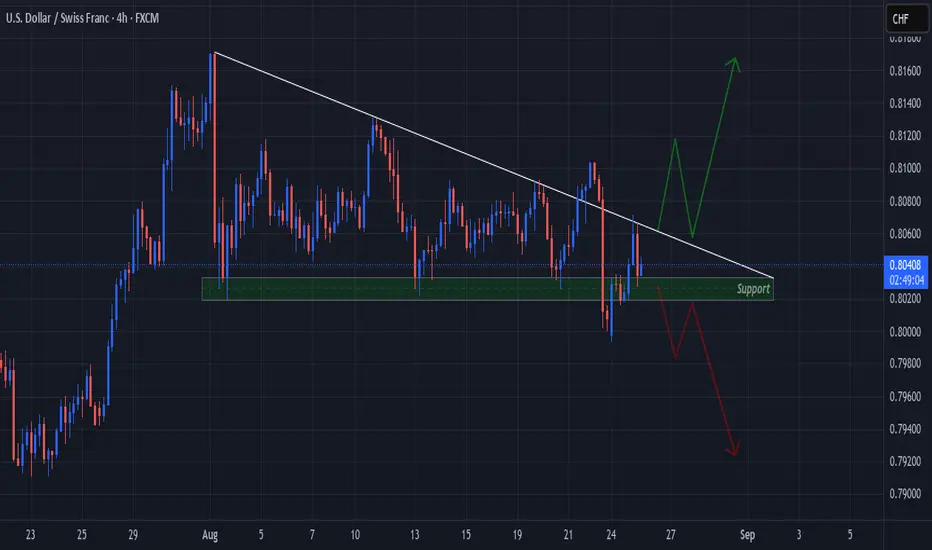
USDCHF "Descends" Into Multiple False Breakouts of the Triangle!Price on OANDA:USDCHF has been falling in a Descending Triangle Pattern shown here on the 4Hr Chart.
Price ending last week created 2 False Breakouts of both the Falling Resistance and Horizontal Support!
Price soon will be looking to make a Breakout with it consolidating tighter into the Apex of the Triangle.
Once a Breakout is validated, we will want to see a Retest!
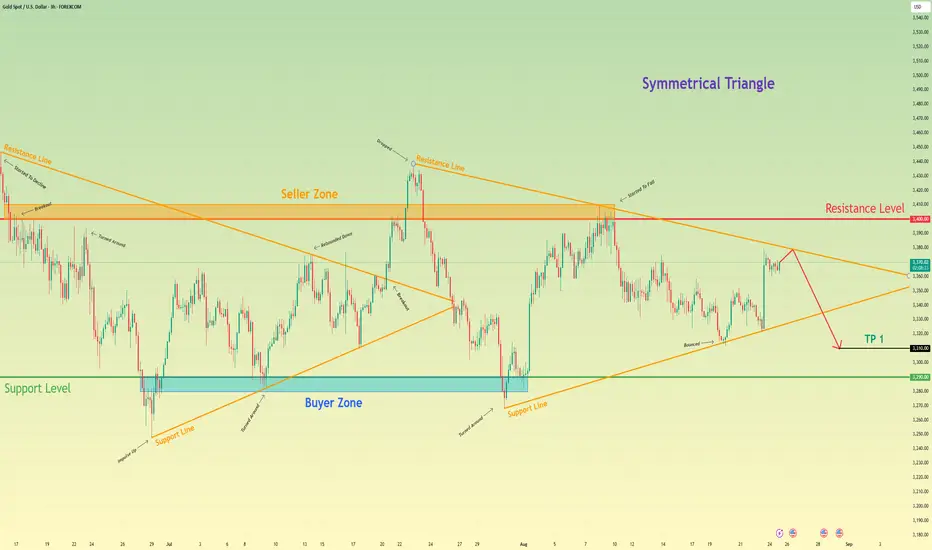
Gold will drop from resistance line of triangle to 3310 pointsHello traders, I want share with you my opinion about Gold. The market for Gold is currently defined by a large symmetrical triangle, a pattern of equilibrium that has formed after a strong rebound from the 3290 buyer zone halted the previous downward trend. This new market structure indicates a period of contracting volatility, with the price action for XAU being methodically squeezed between a descending resistance line and an ascending support line. These boundaries are anchored by the major seller zone around the 3400 resistance level and the aforementioned 3290 buyer zone. At present, the asset is at a critical inflection point, having rallied to test the descending resistance line of this triangle. The primary working hypothesis is a short scenario, based on the expectation that the 3400 seller zone will hold and that sellers will re-emerge to defend this territory. A confirmed rejection from this upper boundary would validate the integrity of the symmetrical triangle and likely initiate another major downward rotation within the pattern. This fall would target the ascending support line and the underlying horizontal support. Therefore, the TP for this rotational play is logically placed at 3310 points. Please share this idea with your friends and click Boost 🚀
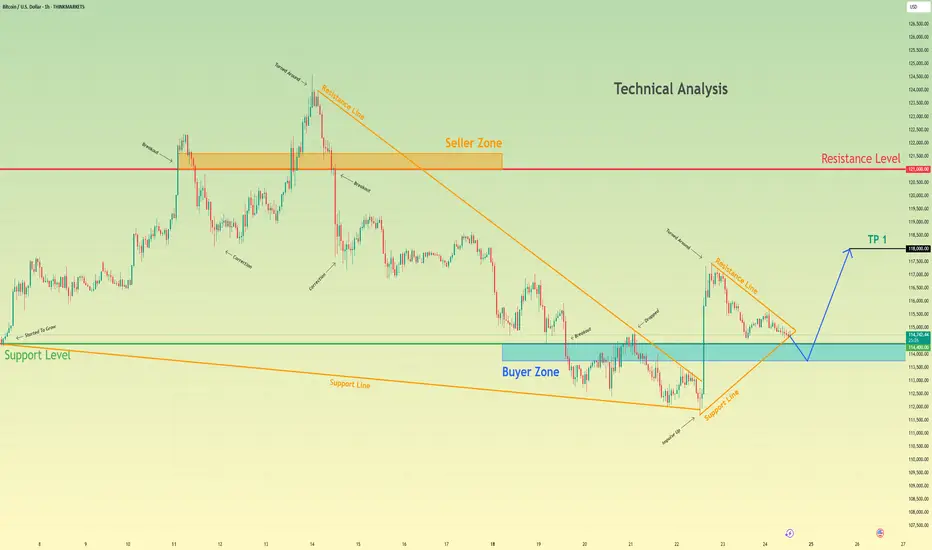
Bitcoin will exit of triangle and then bounce up from buyer zoneHello traders, I want share with you my opinion about Bitcoin. Following a decisive breakout from a prior downward wedge, Bitcoin entered a phase of balance and consolidation that is currently forming a symmetrical triangle. This new market environment signifies contracting volatility, with the price being methodically squeezed between a descending resistance line and an ascending support line. The asset has reached a critical juncture, as it is now at the apex of this formation, where the ascending support line converges with a strong horizontal support level at 114400. The primary working hypothesis is a long scenario, based on the expectation of a 'fake breakdown' or 'liquidity hunt'. It is anticipated that the price may briefly dip below the support line and into the buyer zone to trigger stops before staging a strong reversal. A swift reclaim of the 114400 level would be the ultimate confirmation of this bullish thesis, validating the original uptrend. This reversal is then expected to trigger a significant upward rebound. Therefore, the TP is logically placed at the 118000 level, as this represents a key area of prior price interaction and serves as a prudent first objective for a rally of this nature. Please share this idea with your friends and click Boost 🚀
Disclaimer: As part of ThinkMarkets’ Influencer Program, I am sponsored to share and publish their charts in my analysis.
XAUUSD: Gold's Tightly Wound TriangleOn the daily timeframe, Gold (XAUUSD) is currently consolidating within a well-defined symmetrical triangle pattern, indicative of a period of indecision and tightening price action. This formation suggests that a significant directional move is likely on the horizon.
Symmetrical Triangle Formation: Price action is confined within a symmetrical triangle, characterized by converging upper and lower trendlines. This pattern typically precedes a breakout in either direction.
Key Resistance Level: The immediate overhead resistance is identified around the 3450 mark. This area aligns with the upper boundary of the triangle and represents a critical zone of supply where liquidity is likely resting. A decisive break above this level would signal a strong bullish impulse.
Crucial Support Zone: On the downside, strong support is established at 3250. This zone corresponds with the lower boundary of the triangle and is expected to attract demand. A breakdown below this level would indicate a shift towards a bearish trend.
Anticipating Volatility: As the price continues to coil within this triangle, volatility is expected to increase as we approach the apex. Be prepared for an impulsive move once a clear breakout or breakdown occurs from these boundaries.
Strategic Outlook: The current price action suggests a wait-and-see approach until Gold definitively breaks out of this consolidation pattern. The direction of this break will be pivotal for establishing the next major trend.
Disclaimer:
The information provided in this chart is for educational and informational purposes only and should not be considered as investment advice. Trading and investing involve substantial risk and are not suitable for every investor. You should carefully consider your financial situation and consult with a financial advisor before making any investment decisions. The creator of this chart does not guarantee any specific outcome or profit and is not responsible for any losses incurred as a result of using this information. Past performance is not indicative of future results. Use this information at your own risk. This chart has been created for my own improvement in Trading and Investment Analysis. Please do your own analysis before any investments.

GOLD → Correction before continuing distribution to 3400FX:XAUUSD entered a correction phase at the start of the session after Friday's rally, triggered by positive fundamentals...
Gold is falling after Friday's rise, triggered by Powell's unexpectedly dovish comments in Jackson Hole. He confirmed the Fed's readiness to cut rates in September amid risks to employment and economic growth. The probability of a September rate cut has risen to 88%.
Gold is correcting after a sharp jump, but the downside potential is limited. Market attention is focused on PCE inflation data this week
Technically, the decline in gold prices may be temporary as the market continues to reassess the prospects for the Fed's dovish policy. The key factor will be Friday's PCE data, which will confirm or adjust expectations for an aggressive rate cut.
Support levels: 3358, 3350, 3340
Resistance levels: 3375, 3405
The 3358-3350 area acts as a strong support zone, and it is also worth paying attention to the previously broken downward consolidation resistance. The market may test the support zone before rising, and a false breakdown and consolidation above the support level could have a bullish impact on the market...
Best regards, R. Linda!

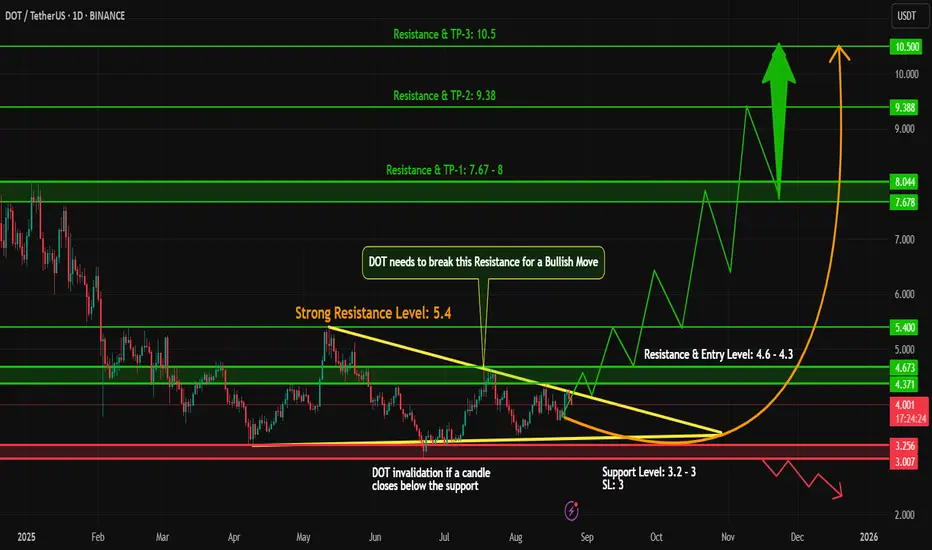
DOT (Polkadot) | Triangle Breakout Setup Loading!#DOT is currently moving sideways and forming a triangle pattern on the 1D timeframe. At the moment, there are no bearish signs on the chart, which indicates strength in the structure.
Key Points:
#DOT is consolidating within a triangle pattern.
A breakout with strong volume will confirm the next big move.
For confirmation, I will wait for the break of the resistance level.
After the breakout, the retest zone will be the ideal entry for a long trade with proper risk management.
Risk Management Reminder: Always wait for confirmation and manage your positions wisely.
This setup looks promising for swing traders who are waiting for the next big leg up.
What are your thoughts on #DOT? Do you think we will see a bullish breakout soon, or is more consolidation ahead? Drop your views in the comments!
If you found this analysis helpful, don’t forget to like, comment, and follow for more updates on #DOT and other altcoins!
Ascending Triangle Alert: Maruti Suzuki 15-Min Setup..!Maruti Suzuki is forming an Ascending Triangle pattern on the 15-minute chart – a potential breakout setup. Keep a close watch for confirmation moves.

OXYSymmetrical Triangle i go for Long when price beark mention levels.
Buy Stop
EP: 47.47
Stop Loss 41.73
Take profit 53.19
RRR 1:1
(12% Trade plan)

XAUUSD Short: Sellers to Maintain Control at 3380 SupplyHello, traders! The macro structure for the XAU price auction has been defined by two critical pivot points, establishing a wide and volatile consolidation range. A major pivot point high was formed at the 3390 supply zone, while a subsequent pivot point low anchored the market at the 3300 demand zone. All price action since has occurred between these two dominant control zones, transitioning the market into a state of balance.
Currently, the price action is contracting within a large symmetrical triangle, signaling a compression of volatility. The auction is now at a critical inflection point, as it is directly testing the upper boundary of this formation. This area represents a powerful confluence of resistance, where the descending supply line and the horizontal 3380 - 3390 supply zone intersect, providing a key battleground for market participants.
The working hypothesis is a short scenario, predicated on sellers successfully defending this resistance confluence. It is anticipated that the price will make a final push into the supply zone before being rejected. A confirmed failure to break higher would validate the triangle's integrity and initiate a full rotation to the downside. The take-profit is therefore set at 3330, targeting the high-liquidity area where the ascending demand line converges with the horizontal demand zone. Manage your risk!

AVAX/USDT – Major Breakout on the Daily Timeframe!AVAX has finally broken out from its long-term descending trendline, signaling the potential start of a powerful bullish move. Let’s break down the setup:
🔎 Chart Analysis:
Pattern: Falling Wedge on the Daily timeframe.
Breakout Zone: Price has successfully closed above the resistance trendline around $25–26.
Support Zone: Strong accumulation support around $24–26
🎯 Trade Setup:
Entry Zone: $24–26 (current breakout retest levels)
Targets:
TP1: $35
TP2: $48
TP3: $60+
Stop Loss: $21 (below wedge & accumulation box)
📊 Risk/Reward:
R/R ratio: ~5:1
High conviction setup with breakout confirmation.
⚡ Key Takeaway:
If AVAX holds above the breakout zone, it could deliver a 2x–3x run in this cycle. Watch closely for volume confirmation on daily candles to strengthen the breakout signal.
🔥 Conclusion: AVAX looks primed for a strong bullish rally after months of consolidation. Accumulation zones are done — breakout traders could be rewarded big here!

Possible Neutral Triangle Breakout – Key Level at 11.07The chart appears to show a completed neutral triangle (a–b–c–d–e), with a breakout emerging above the upper boundary at 11.07.
Wave a looks like a complex structure (possibly elongated flat or flat + zigzag).
The rest of the legs are mostly zigzag forms, consistent with triangle rules.
False breakdown below wave e followed by a strong reversal.
MACD is confirming momentum during the breakout attempt.
As long as price stays above 11.07, this breakout may be sustained. If confirmed, the next target zone could align with the height of the triangle projected upward.

Searle Analysis Searle taking resistance from the trendline and Fib 0.382 level. It has tested the trendline and Fib 0.382 twice and got rejected. It can take support from MA100 (104) and try once again. to break the trendline.
On a bigger view, it is making a symmetric triangle. Once it breaks this triangle, price will move towards next levels.
Target as per symmetric triangle can be 227 - 230 (Fib 0.786 level).
However, this may take some time and fundamental turn around will drive it.

GOLD → Consolidation and news. What are the chances for growth?FX:XAUUSD is consolidating in a symmetrical triangle pattern. Market uncertainty remains high. The global trend is bullish, while the local trend is neutral. What can we expect from gold?
Gold is falling ahead of Powell's speech in Jackson Hole. The dollar is strengthening on strong US economic data (housing sales and PMI growth), which reduces the likelihood of an early easing of Fed policy.
Key factors:
Powell may confirm a cautious approach to rate cuts. The probability of a rate cut in September has fallen to 75%. The rise of the dollar as a “safe haven” is putting pressure on gold
Scenarios after the speech:
Hawkish tone from Powell → dollar rises → gold falls below $3300.
Soft signal → dollar correction → gold recovery
Technically , the gold casino continues and it is difficult to determine in advance which way the symmetrical triangle will break, but if we bet on a bullish trend and the likelihood of an imminent interest rate cut, the most likely scenario is a rebound from the support zone followed by a breakout of resistance and a rise to local levels
Resistance levels: 3350, 3358, 3370
Support levels: 3323, 3320, 3315
A false breakout of the key support level, which is being defended quite aggressively by the bulls, could trigger an active recovery phase. However, it is important to keep an eye on Powell's speech, as well as Trump's, who will also be commenting this afternoon.
Best regards, R. Linda!

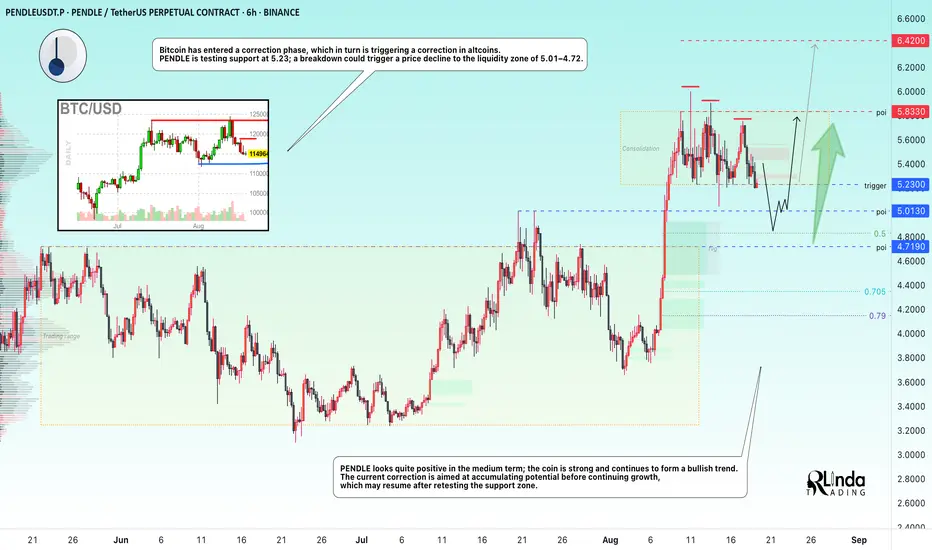
PENDLEUSDT → Retest of the 5.0 liquidity zone before rising to 7BINANCE:PENDLEUSDT is still consolidating, but is preparing to enter a correction phase, which could be triggered by a breakdown the 5.23 support level. Correction is a vital stage for further growth.
Bitcoin has entered a correction phase, which in turn is triggering a correction in altcoins. PENDLE is testing support at 5.23, and a break of this support level, which is already being tested for the sixth time, could trigger a price decline to the liquidity zone of 5.01 - 4.72
PENDLE looks quite positive in the medium term, the coin is strong and continues to form a bullish trend. The current correction is aimed at accumulating potential before continuing growth, which may resume after retesting the support zone.
Resistance levels: 5.833, 6.42
Support levels: 5.23, 5.013, 4.719
On the weekly chart, PENDLE is consolidating above the strong support level of 5.013. As part of the correction, the market may confirm this support and continue its growth towards the ATH from the mirror level.
Best regards, R. Linda!